Author: Alyaziah Hayat
-
USDCAD at the key trend resistance
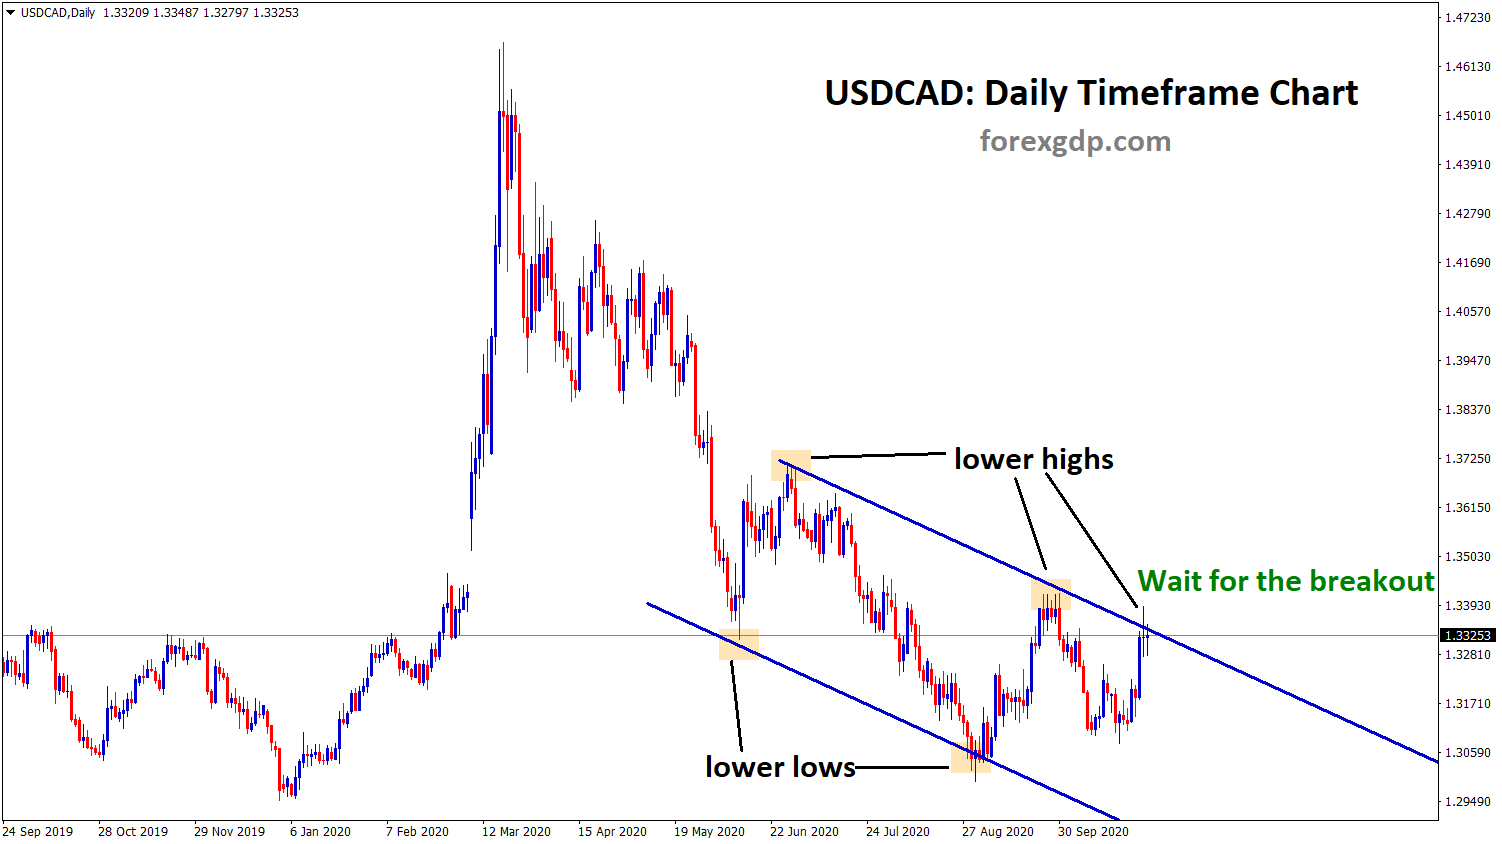
USDCAD is moving in a downtrend for a long time in the daily timeframe chart. Now, USDCAD is standing at…
-
Descending Triangle Pattern: USDJPY at the key bottom
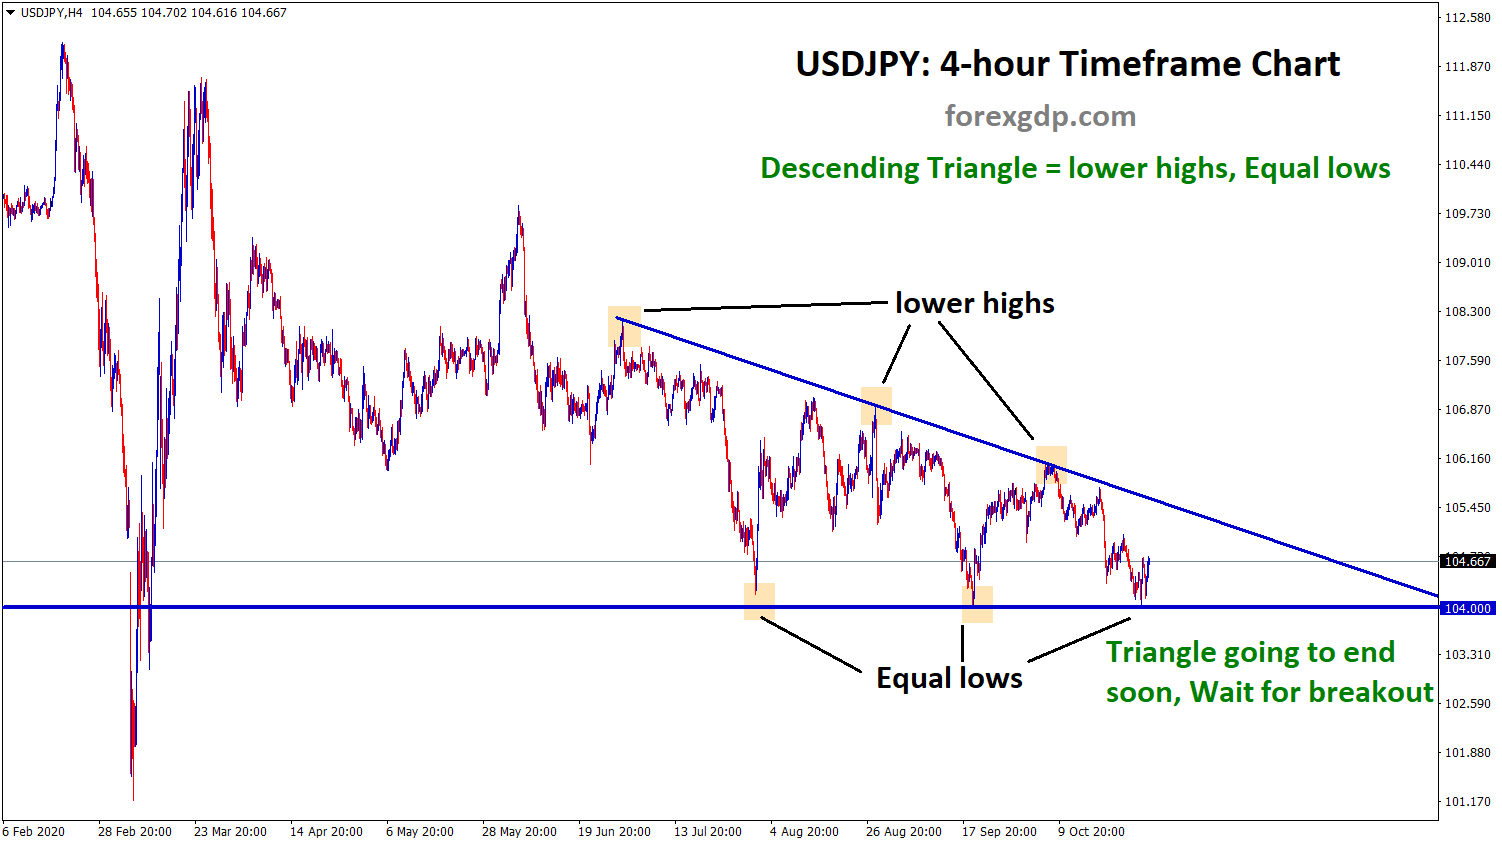
USDJPY Triangle analysis USDJPY has formed a Descending Triangle pattern by creating lower highs and equal lows in the 4-hour…
-
NZDUSD is moving in a sideways range.
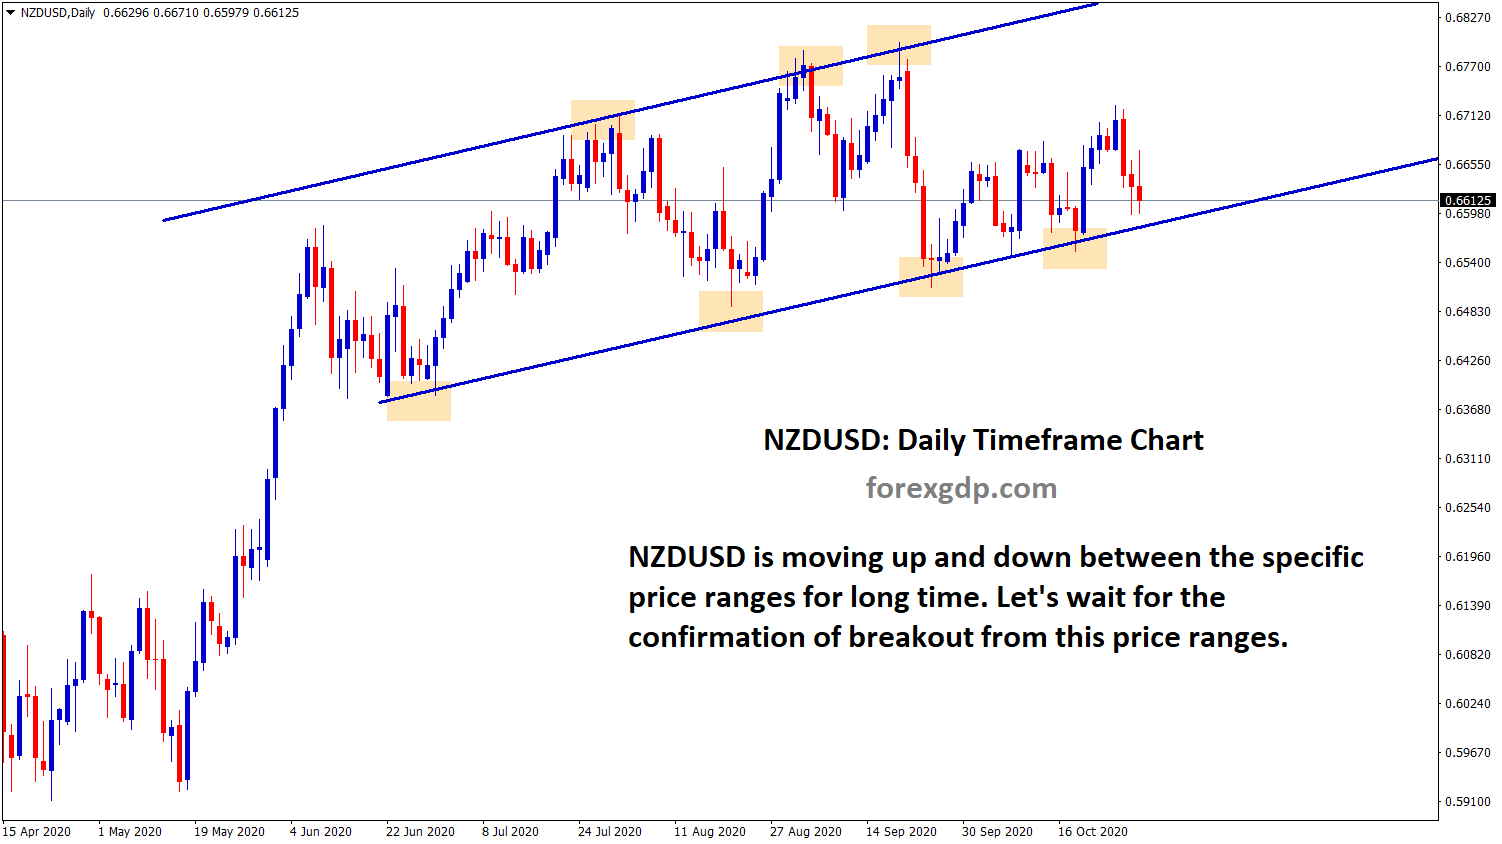
NZDUSD Sideway Analysis NZDUSD is moving up and down between the specific price ranges for a long time. Let's wait…
-
Gold is at the Low price level. Going to fall further?
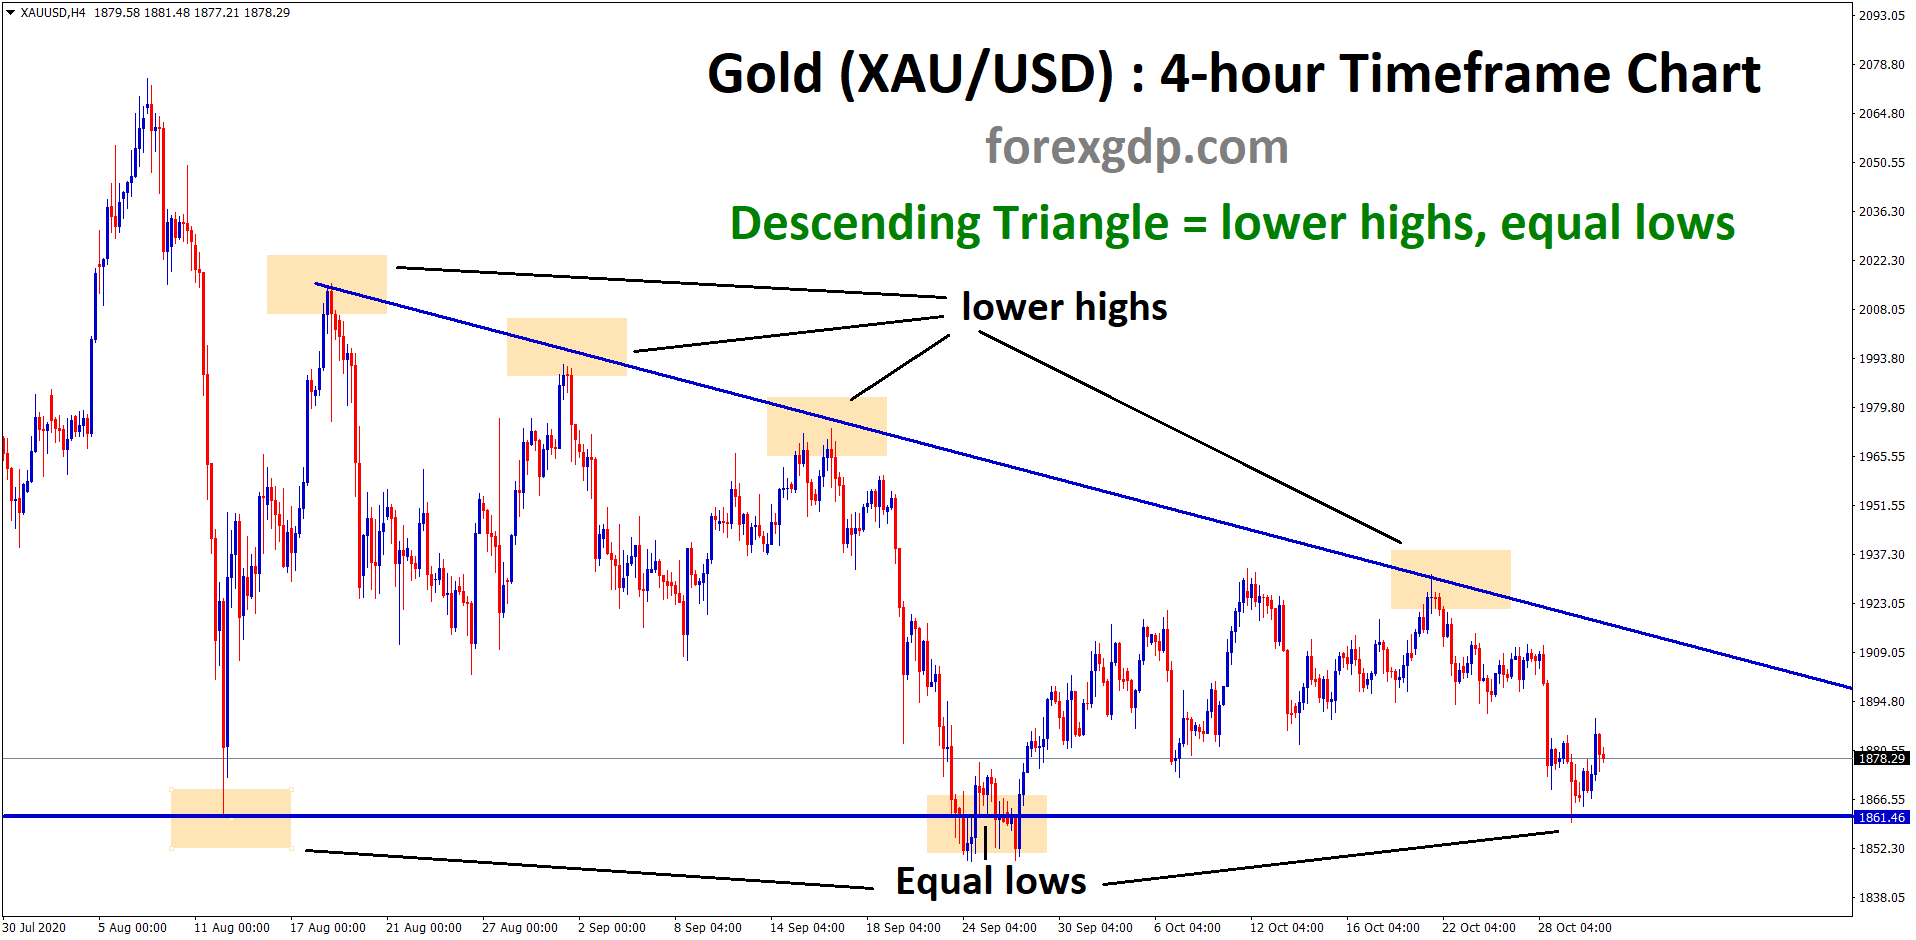
Gold has reached the bottom zone of the Descending Triangle in the 4-hour timeframe chart. Let's wait for the confirmation…
-
GBPJPY at the higher low, wait for breakout or reversal
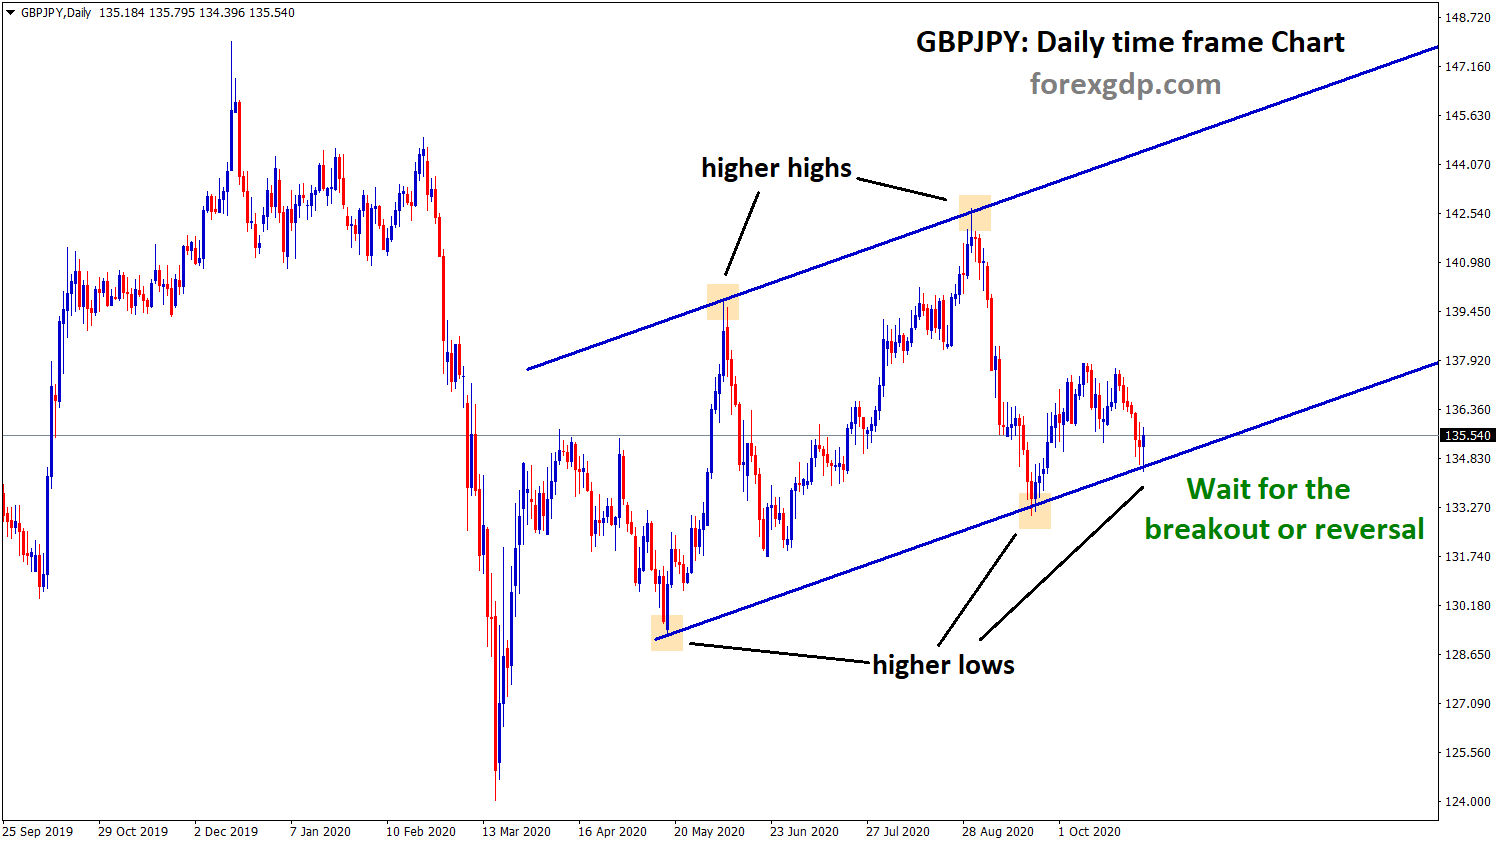
GBPJPY is moving in an Ascending channel by forming higher highs, higher lows in the daily timeframe chart. Now, GBPJPY…
-
Ascending Channel has broken in the EURNZD
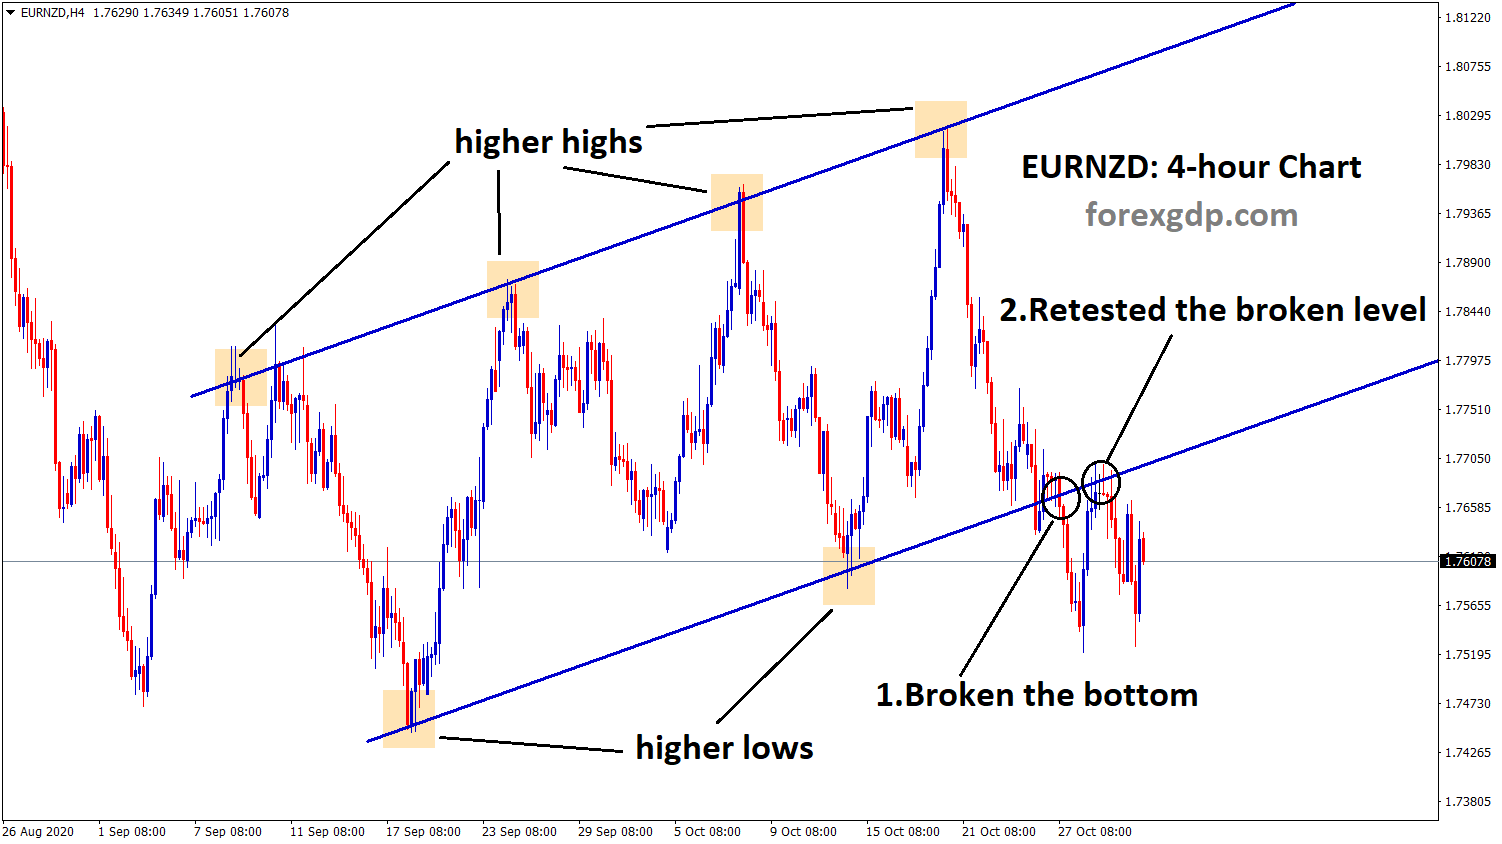
EURNZD has broken the bottom zone of the Ascending channel. After the breakout, it has retested the broken level. Now,…
-
EURAUD has formed an Ascending Channel Pattern
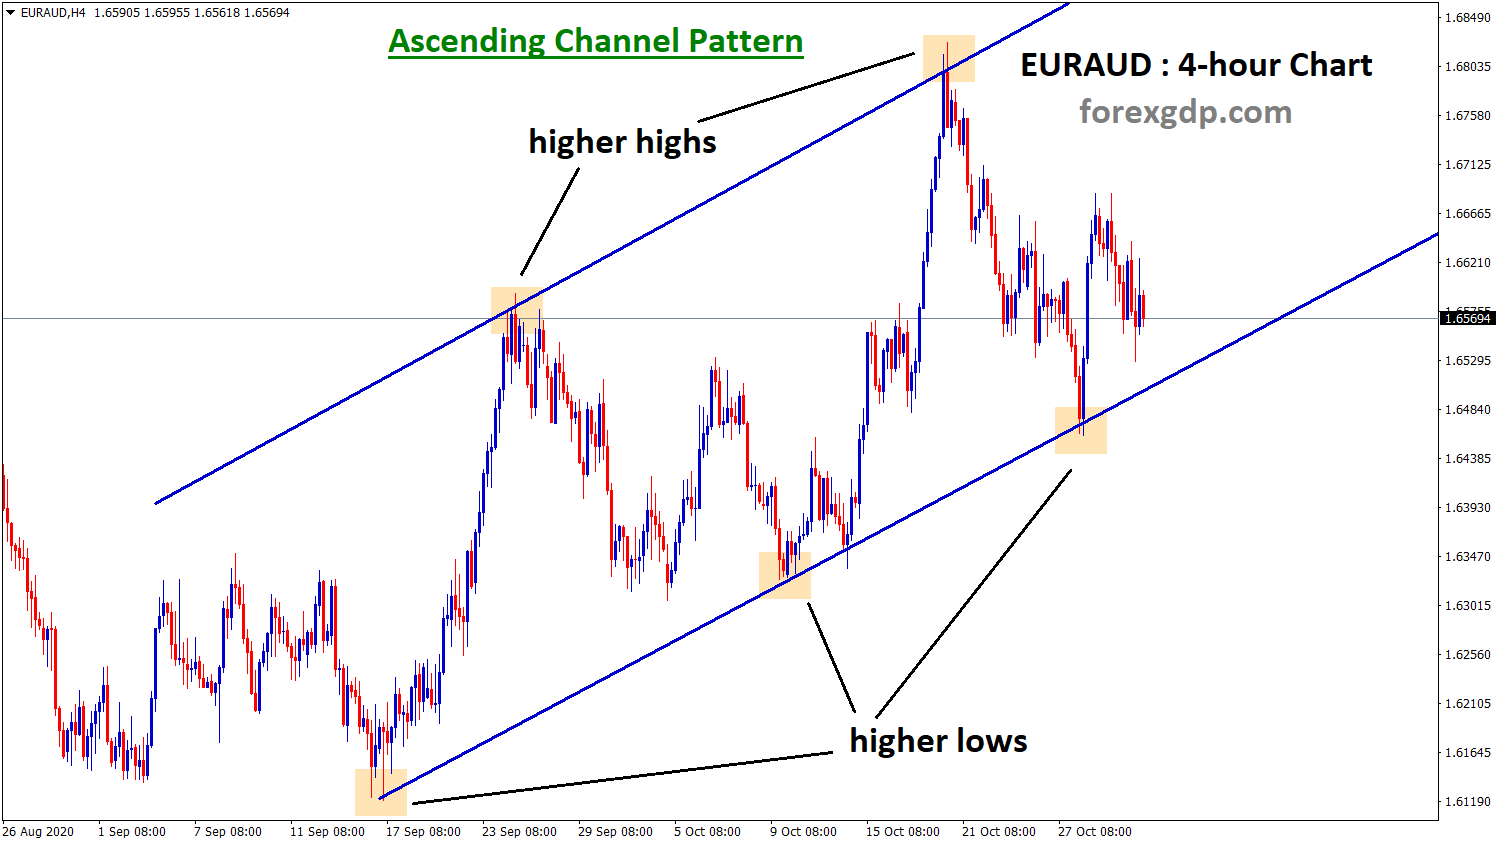
EURAUD has formed an Ascending channel pattern by forming higher highs, higher lows in the 4-hour timeframe chart. Now, the…
-
CHFJPY is moving in a downtrend range
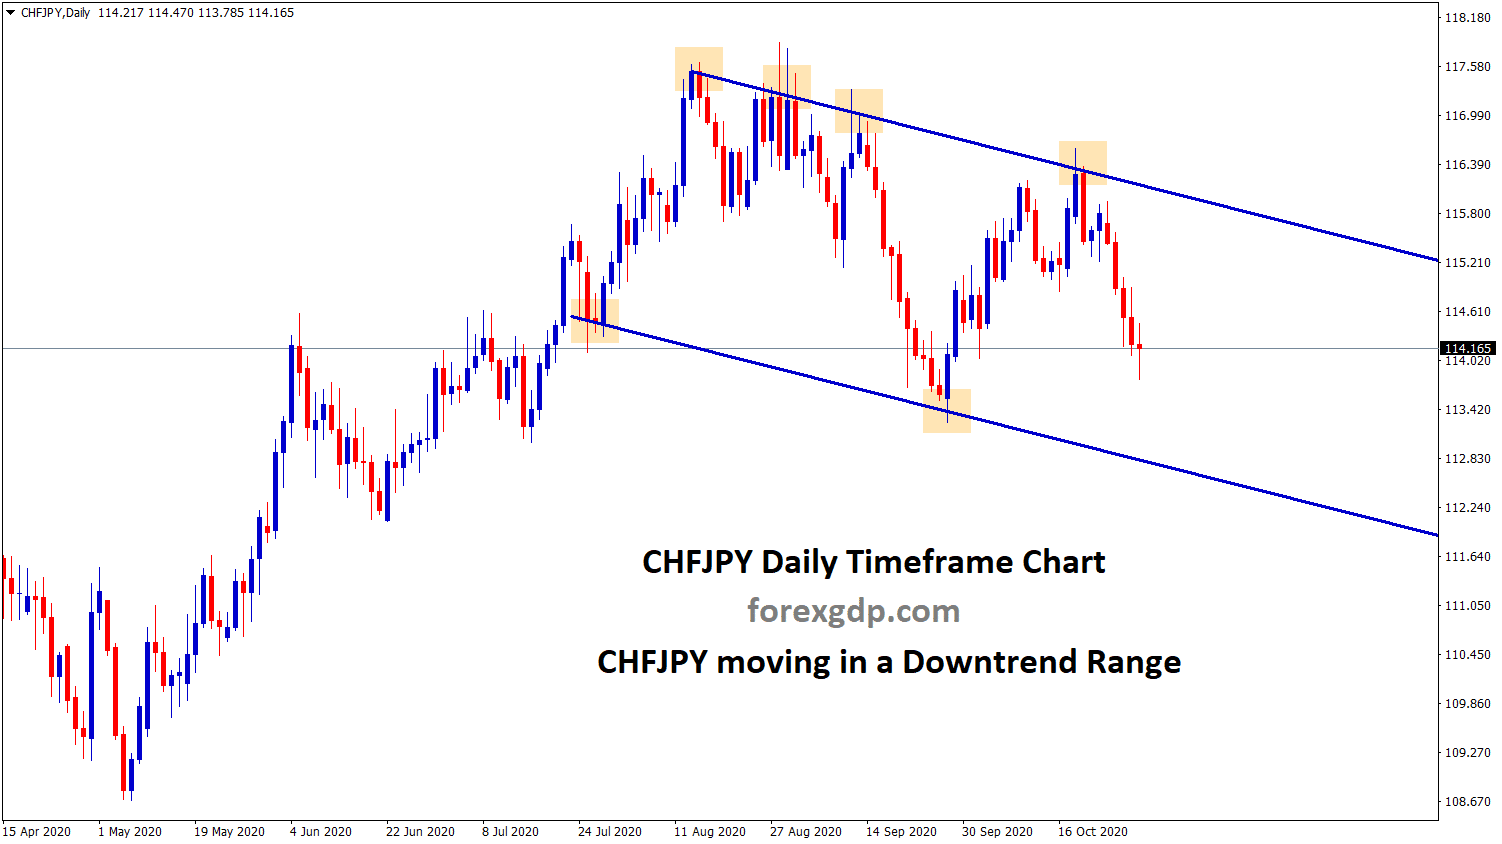
CHFJPY is moving in a downtrend range in the daily timeframe chart. The market will break this range soon, let's…
-
Symmetrical Triangle going to break in CADCHF
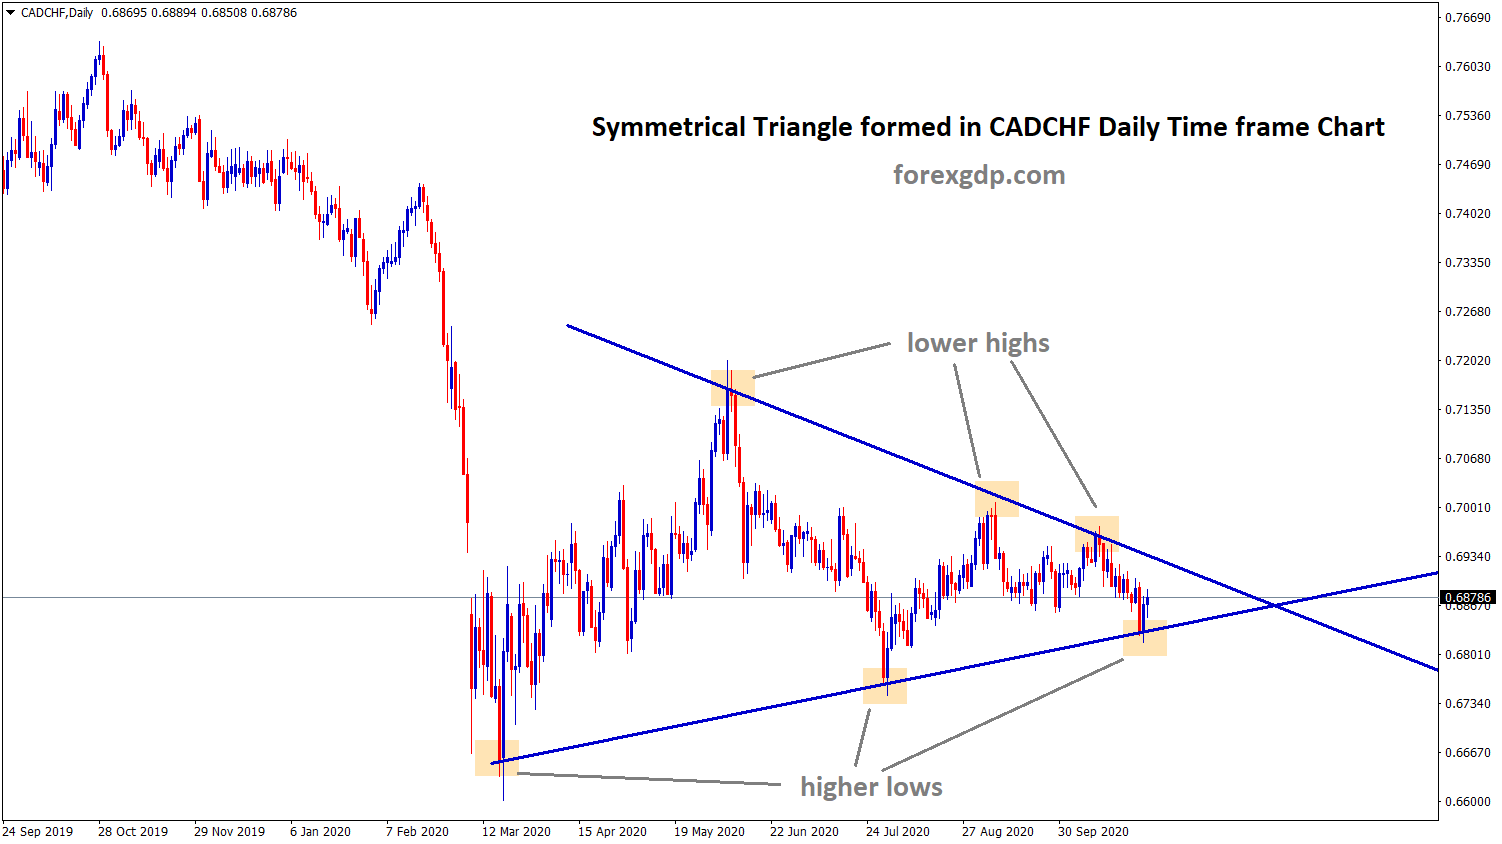
CADCHF has formed a symmetrical triangle by creating lower highs and higher lows in the daily timeframe chart. This Symmetrical…
-
+800 Points Achieved in EURUSD after breaking the Uptrend line
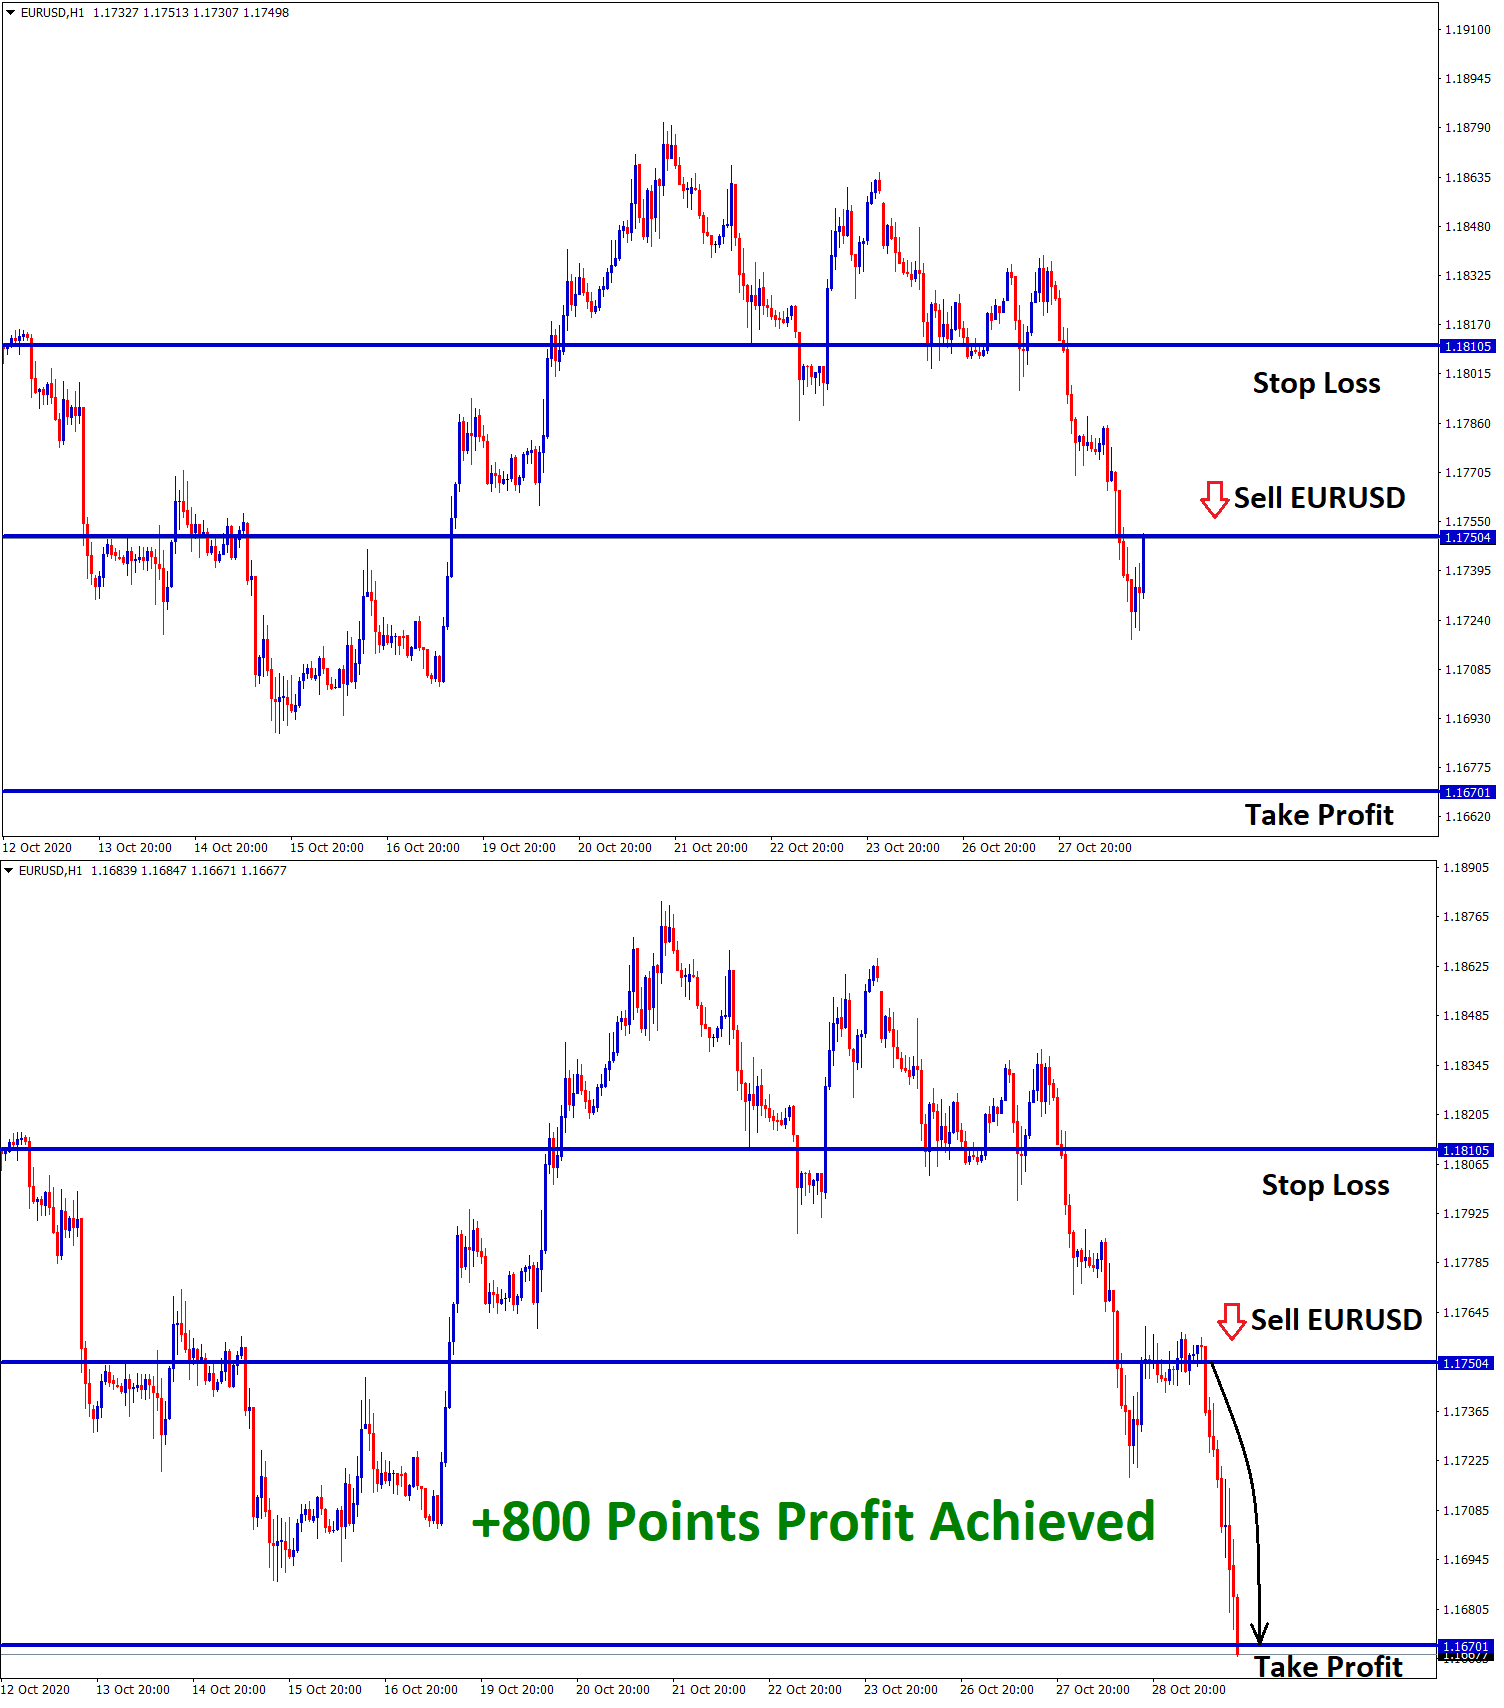
EURUSD Analysis EURUSD has reached the bottom level (higher low) of the uptrend line. USD becomes strong due to Non-releasing…
-
+550 Points reached in NZDUSD after breaking the bottom
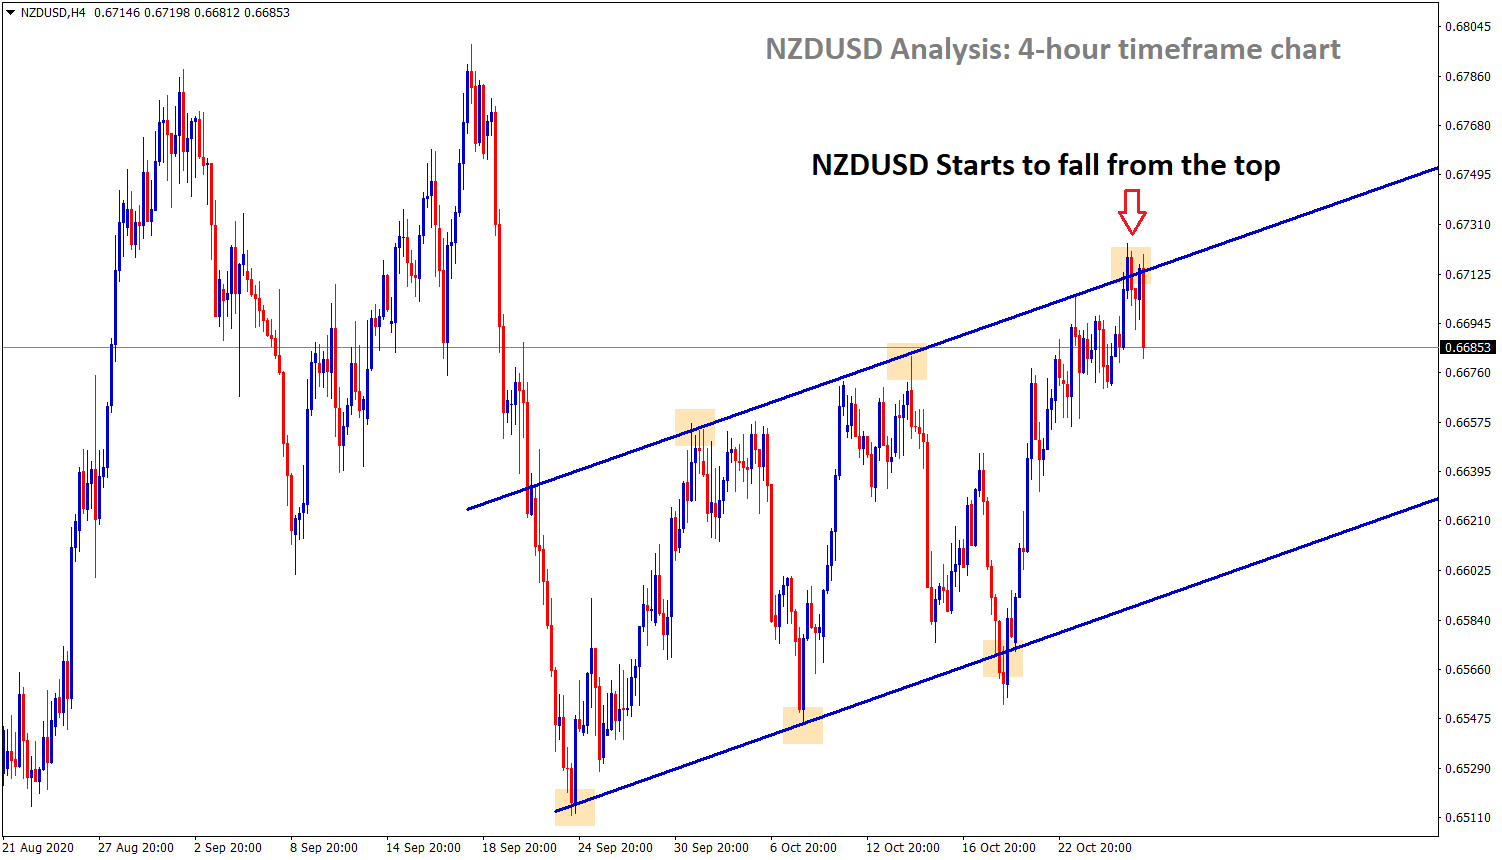
NZDUSD Sell Analysis NZDUSD starts to fall from the top level of the Ascending channel in the 4-hour time frame…
-
EURUSD at the bottom level of the Uptrend line
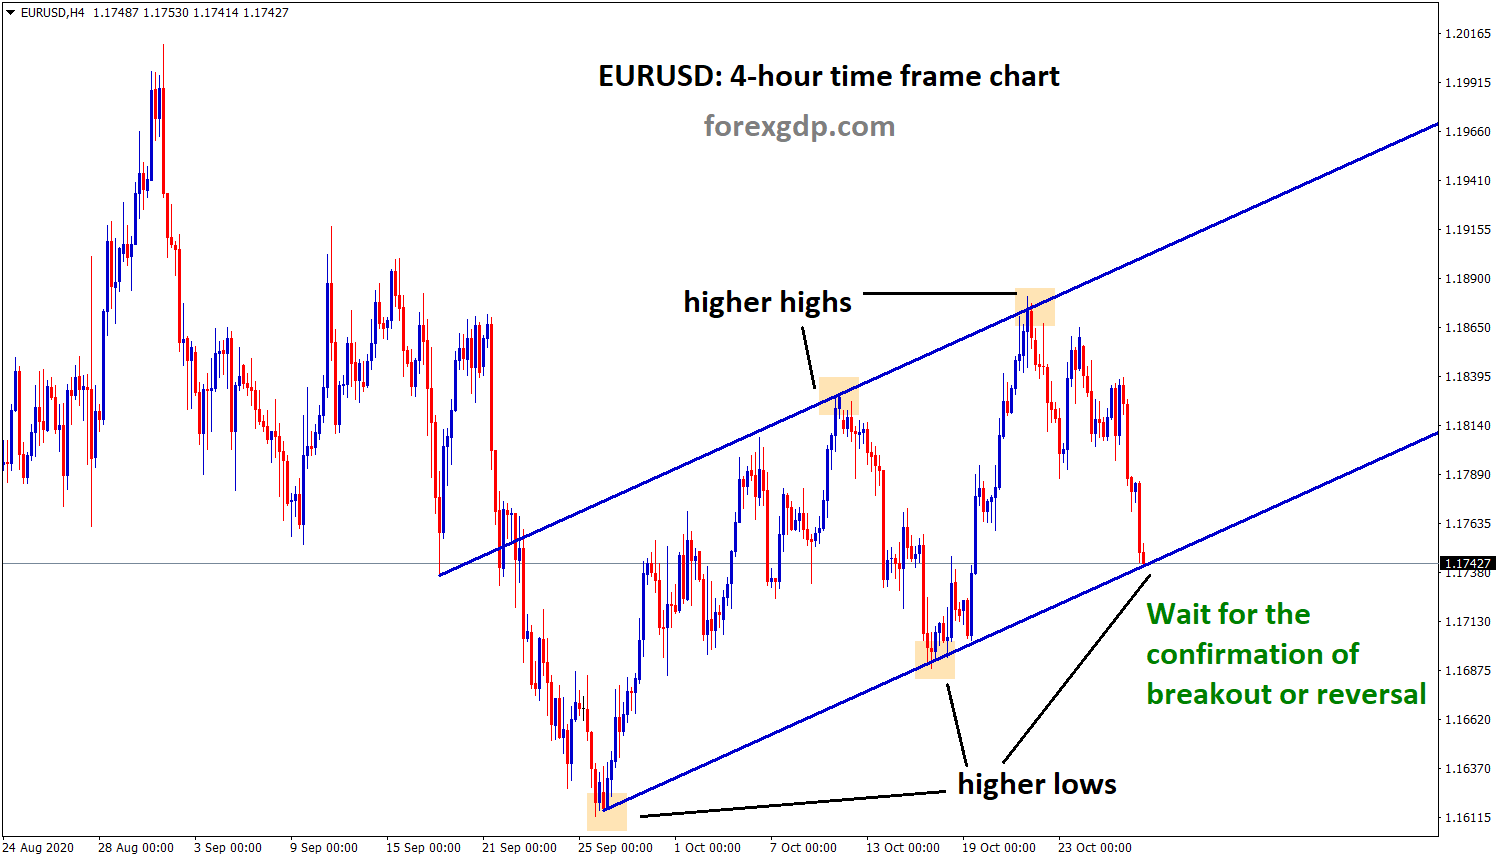
EURUSD Analysis EURUSD has reached the bottom level (higher low) of the uptrend line. Let's wait for the confirmation of…