Author: Alyaziah Hayat
-
Descending Triangle Broken in USDJPY
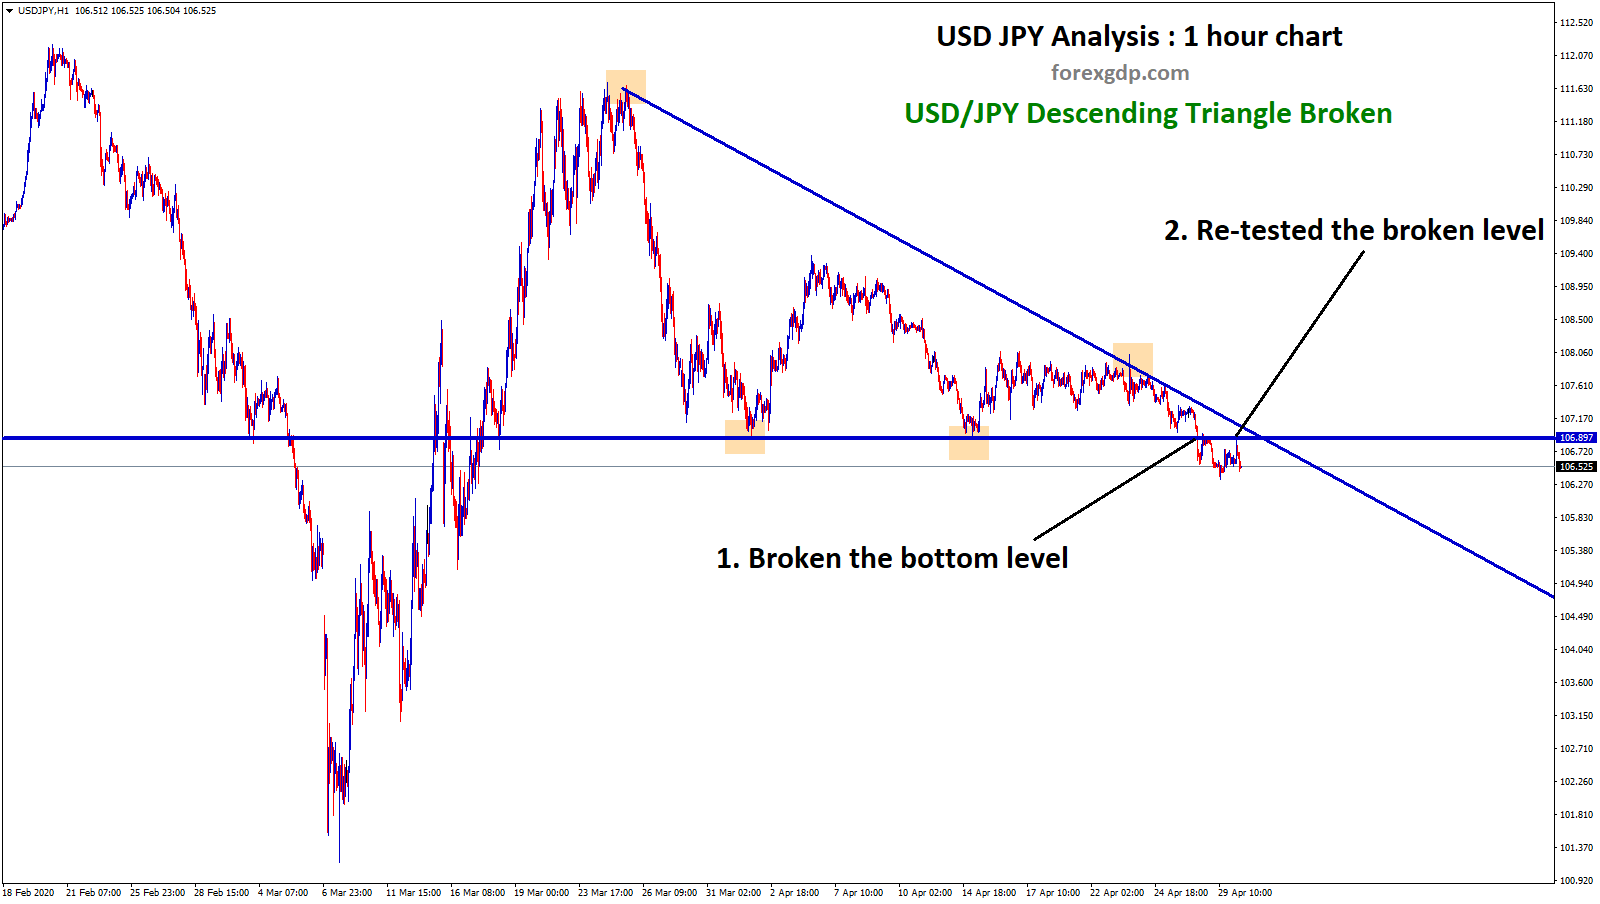
USDJPY Descending Triangle Analysis USDJPY formed a Descending Triangle pattern in 1 hour forex chart. 1) Recently, USDJPY broken the…
-
EUR/CAD reached -600 points
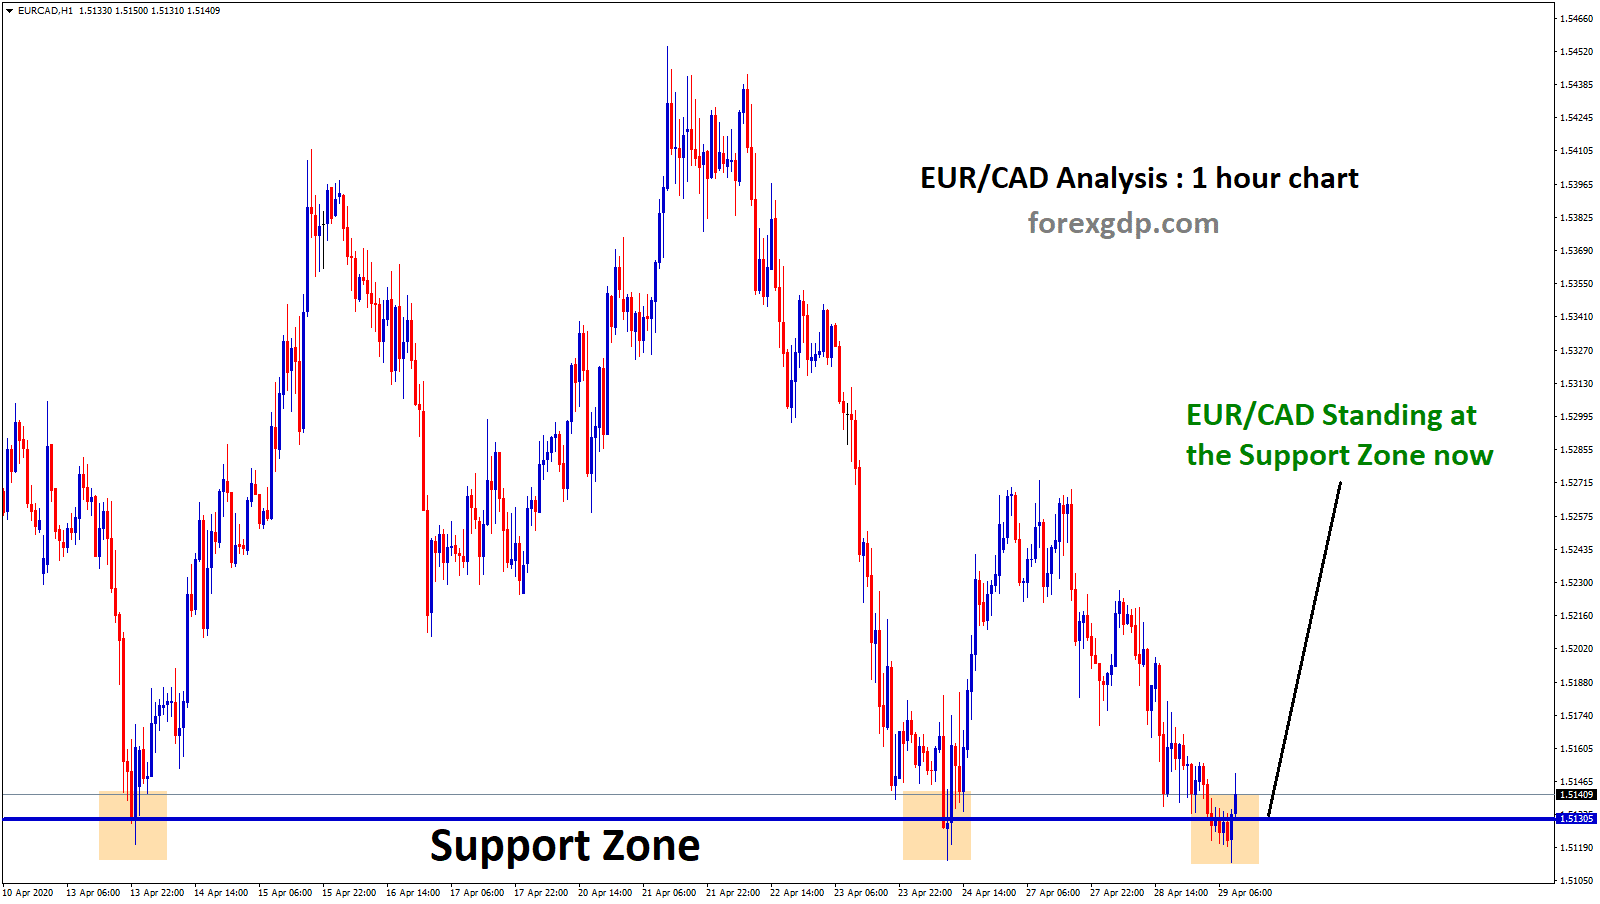
EURCAD Technical reason for Buying: After EURCAD reaching the bottom support zone. we expect for the bounce back. check the…
-
CADCHF Buy reached +851 Points
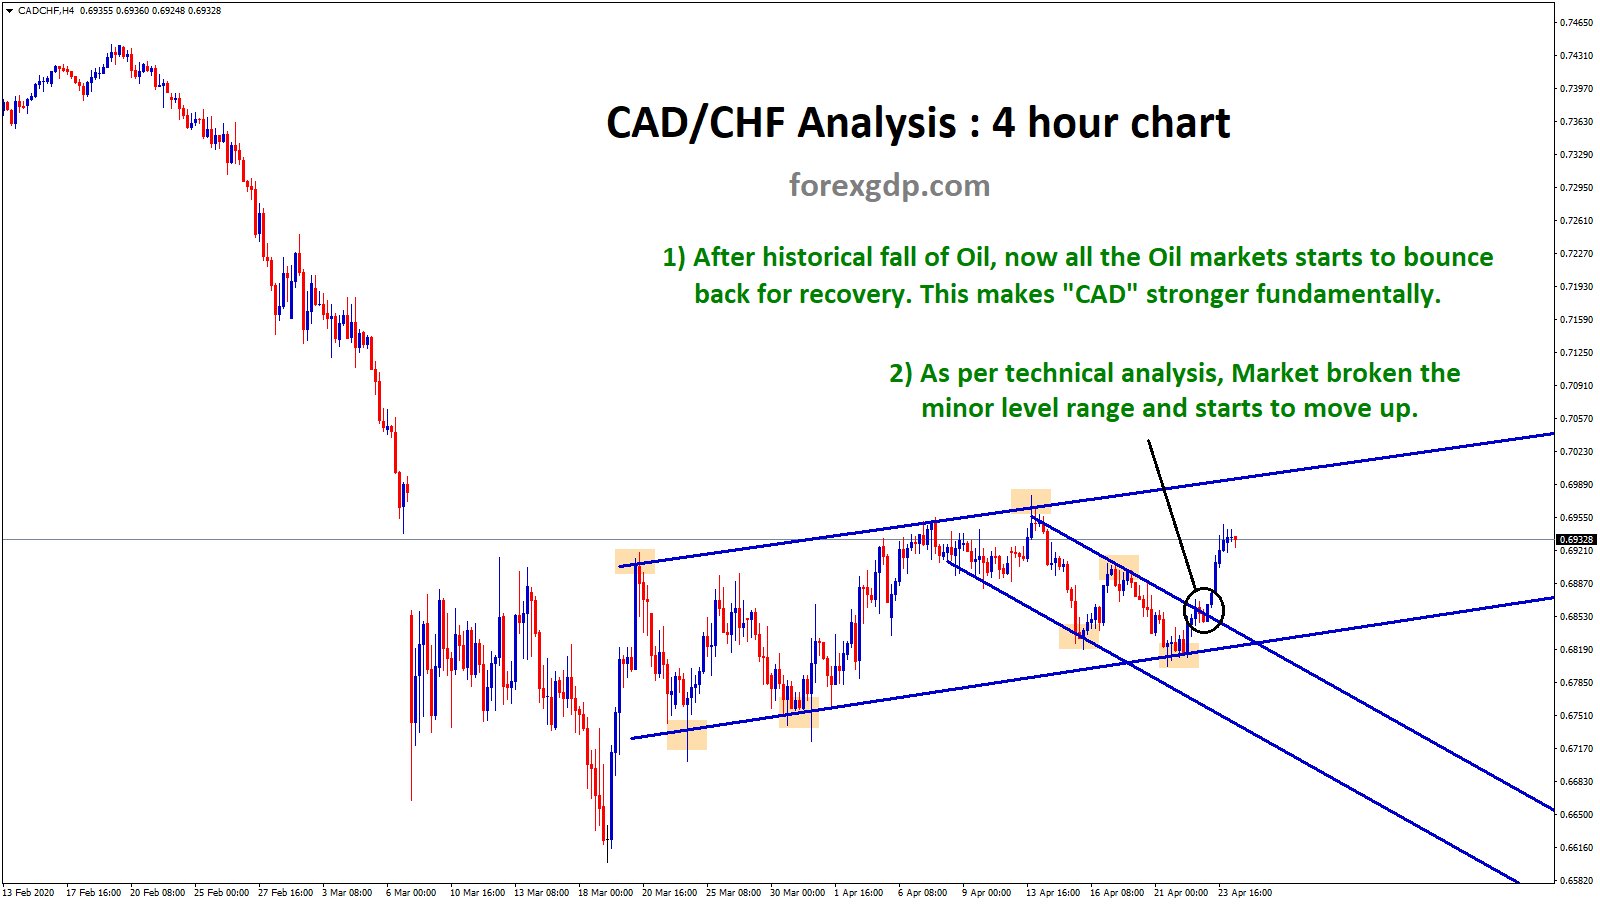
Reason for Buying CADCHF after breakout As per long term forecast view, CADCHF is moving in an Uptrend in 4…
-
Support Zone reached in EUR/CAD
EUR/CAD Technical support analysis EURCAD forecast EUR/CAD moving up and down between specific prices ranges in 1 hour chart. Now,…
-
EUR/USD standing at the top zone of Triangle
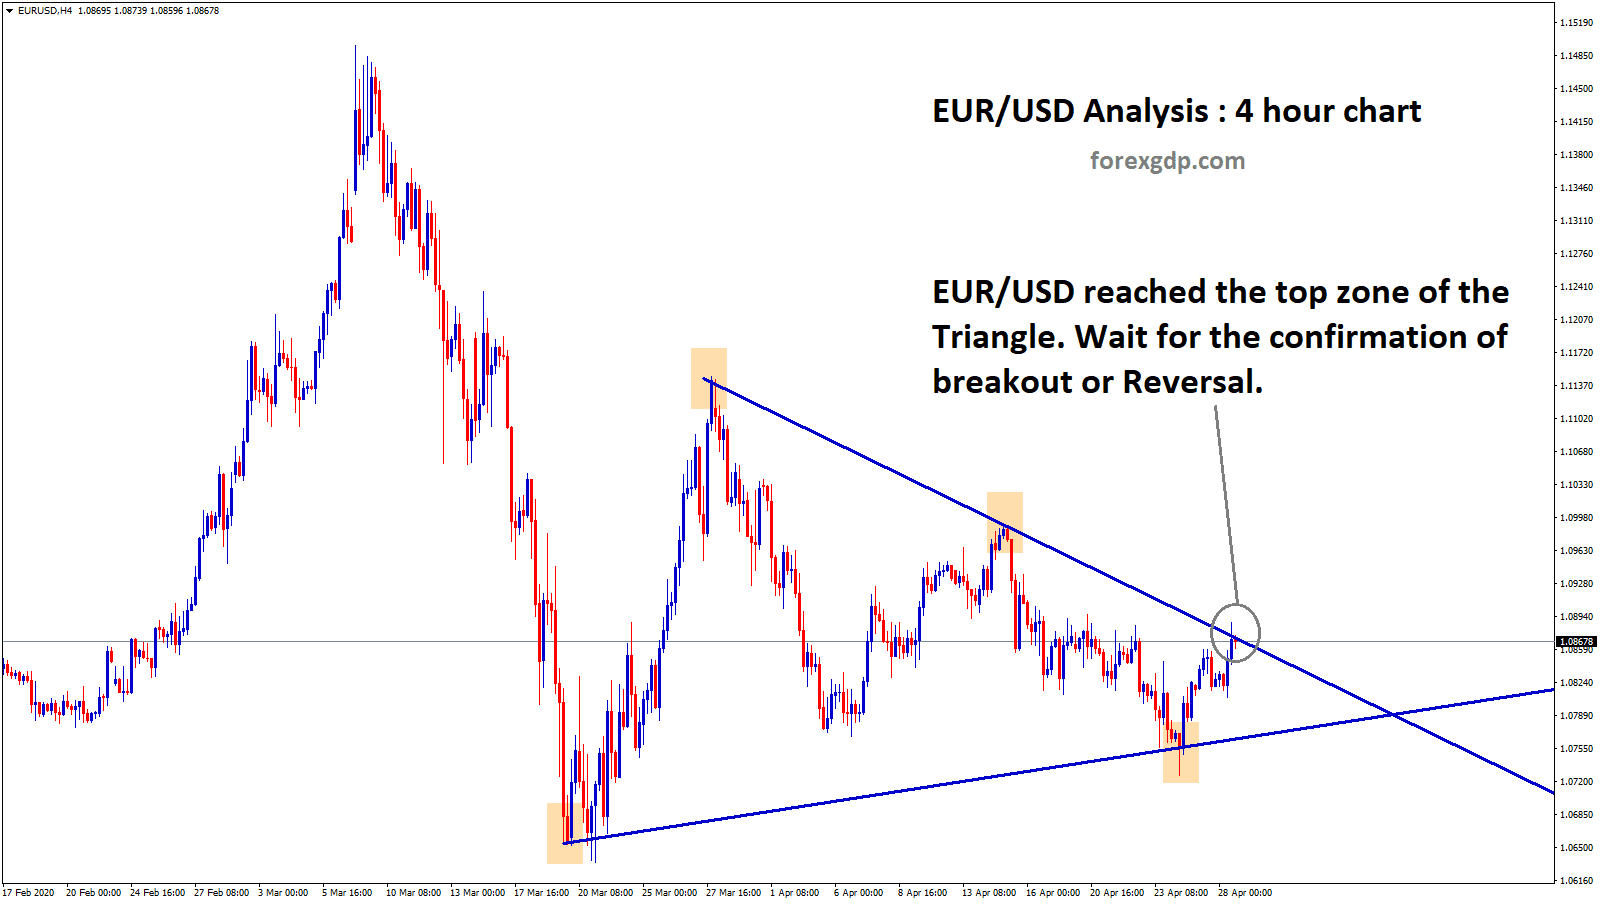
Traingle Pattern Analysis in EURUSD EUR/USD is moving sideways for long time. As it formed a Triangle Pattern on EUR/USD…
-
+650 Points Profit achieved in USD/CHF
Technical Analysis for Buying USD/CHF As per our USDCHF forecast : click here to view. While the market is standing…
-
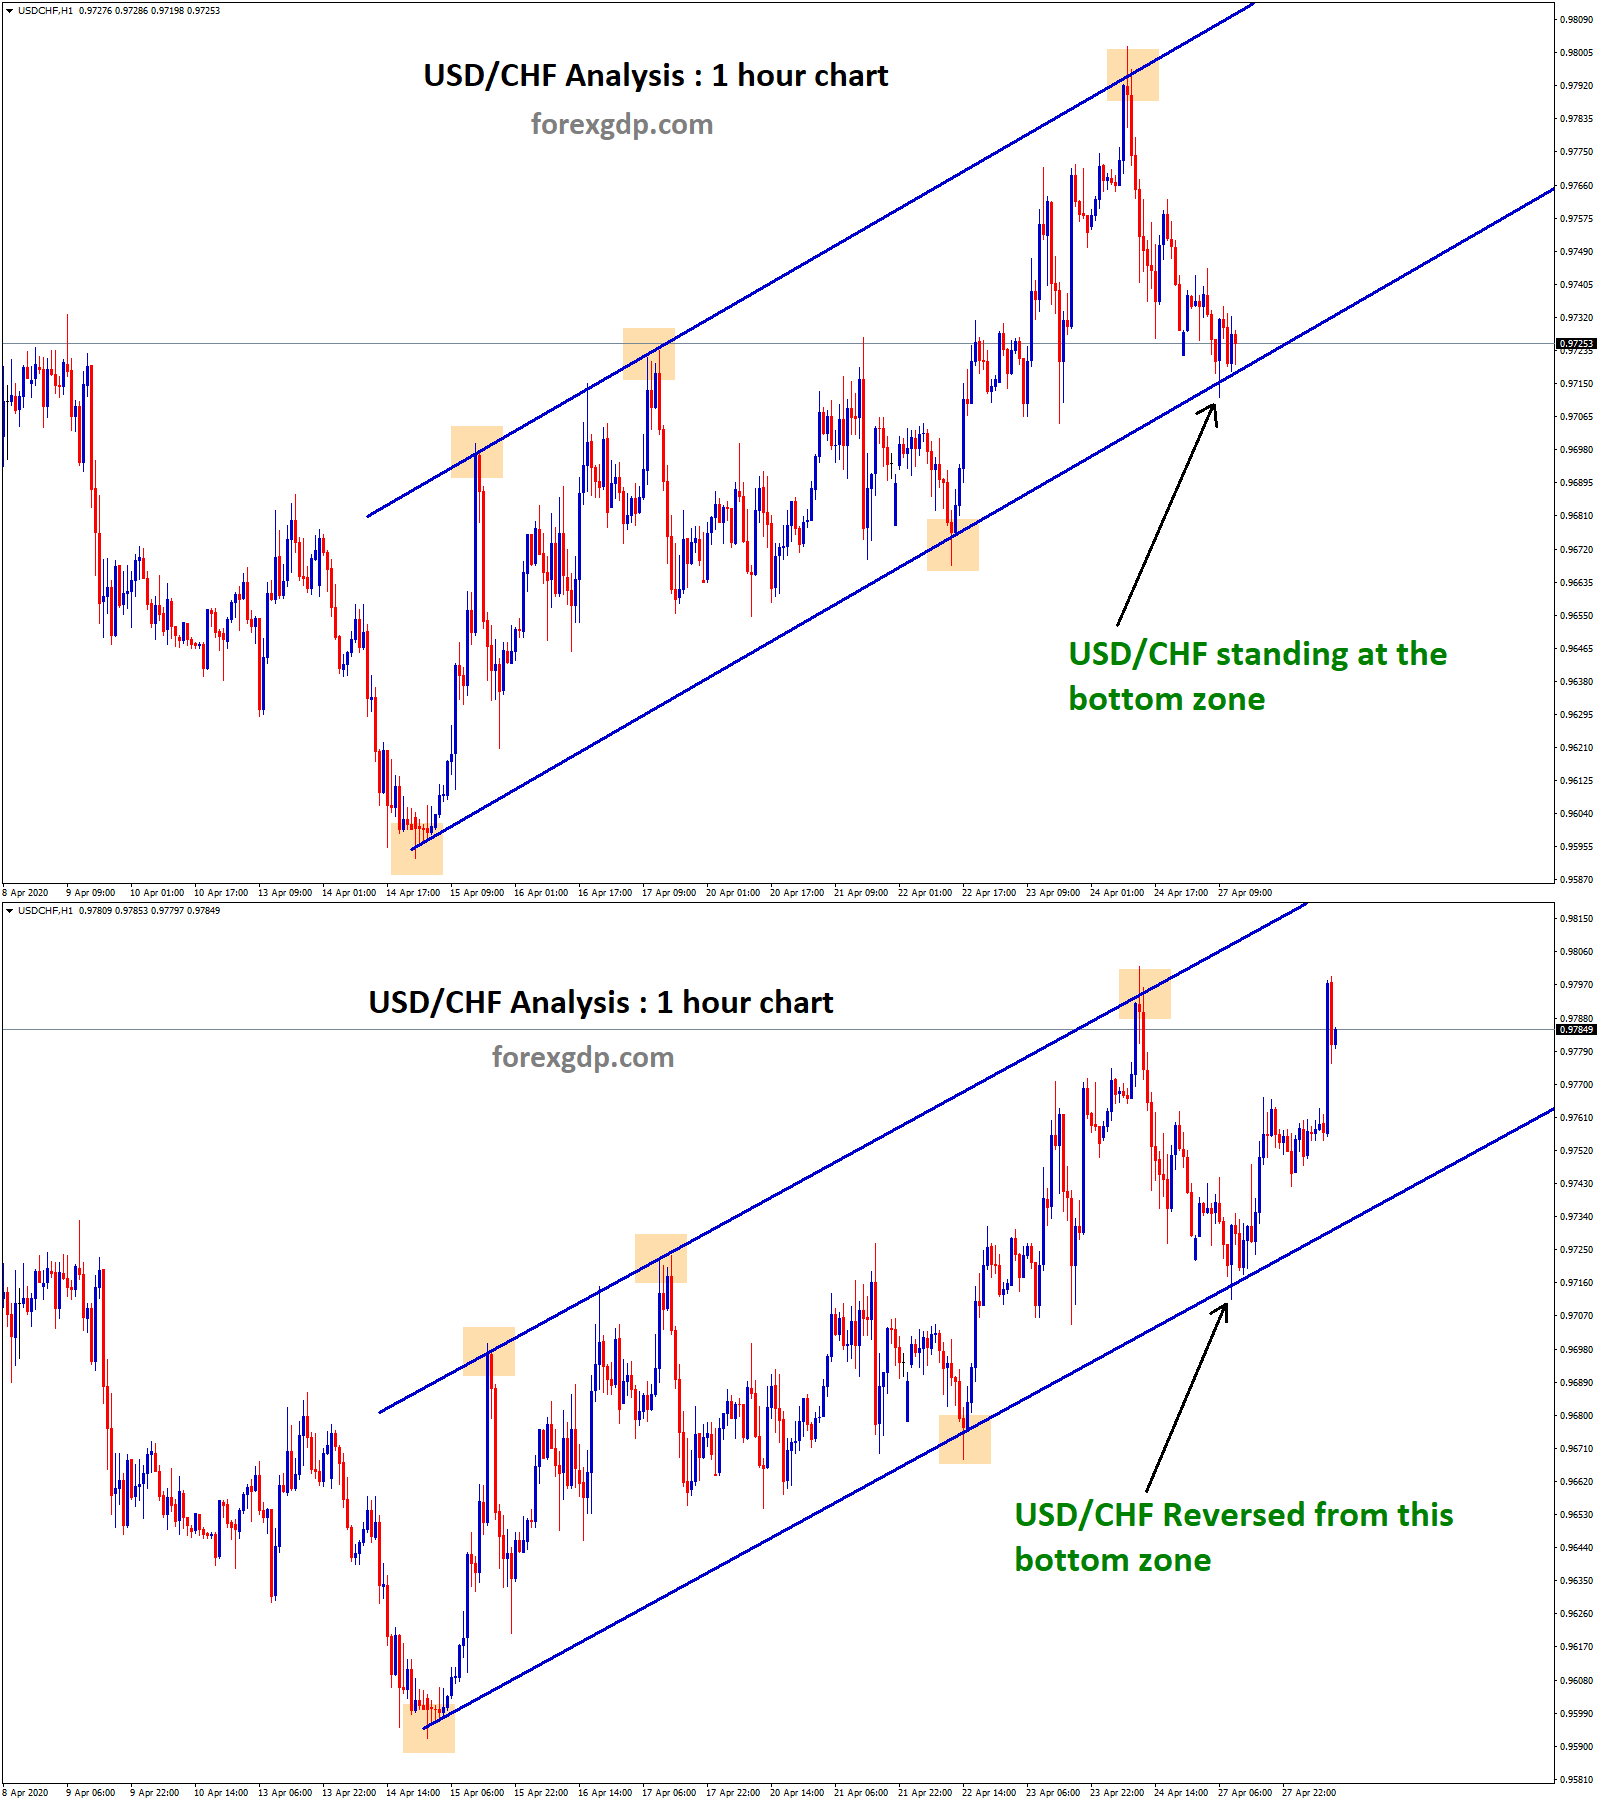
USDCHF standing at the bottom of trendline
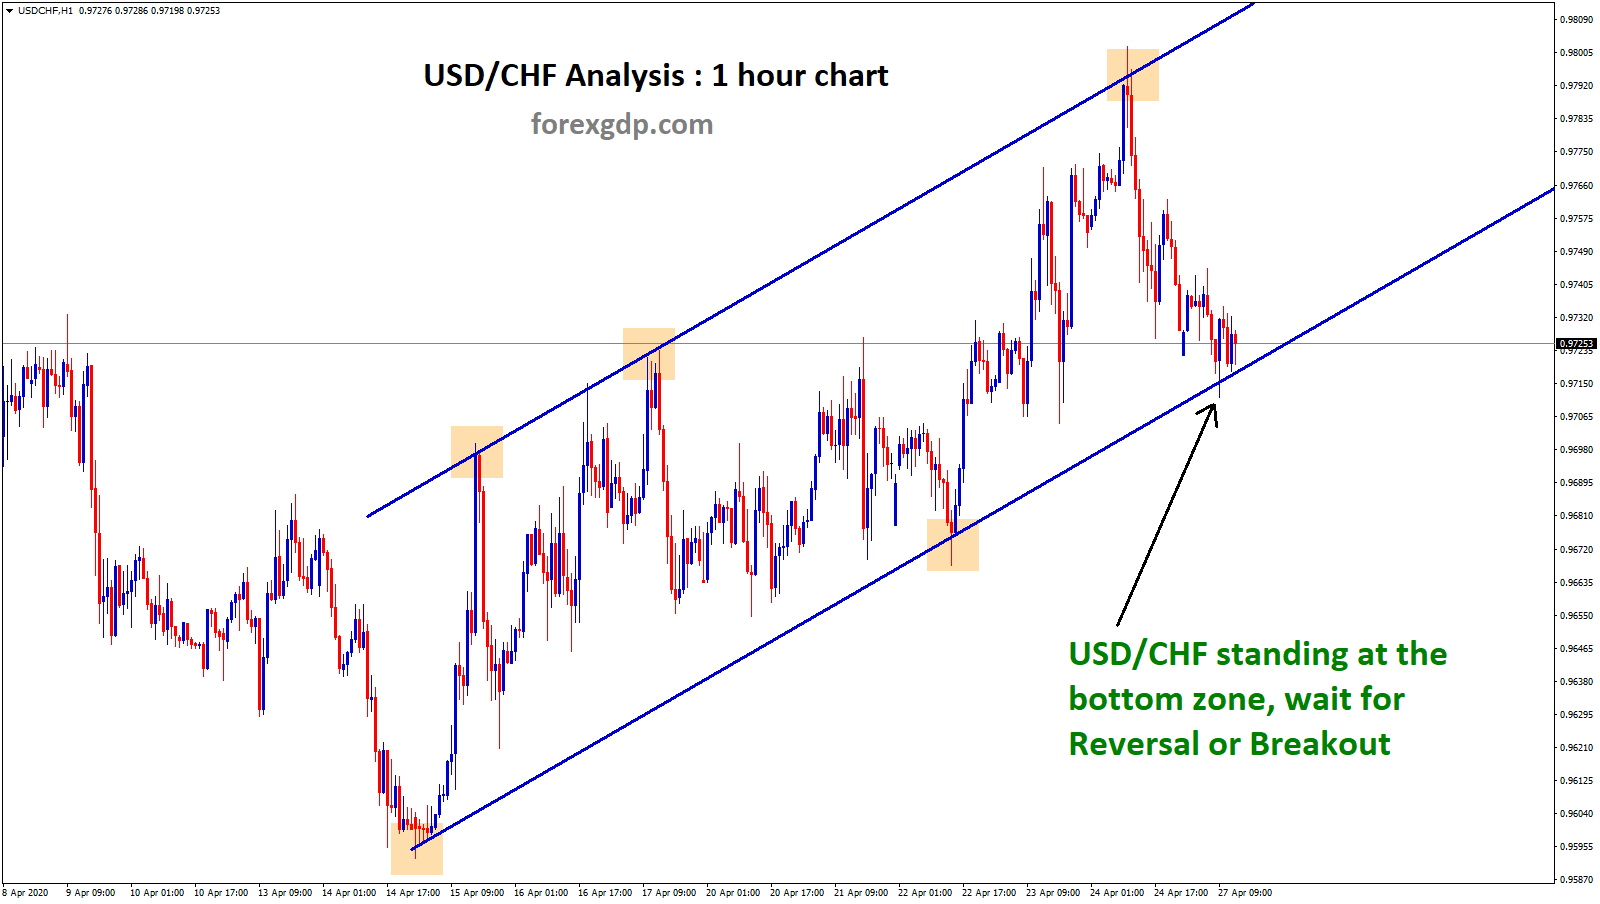
USDCHF Trendline analysis at the bottom zone USDCHF is moving in an up trendline by forming higher highs, higher lows…
-
CAD currency getting strong due to crude oil recovery
CAD Currency correlation analysis with Crude Oil markets After historical fall of Oil, now all the Crude oil markets starts…
-
EUR/GBP reached -654 points
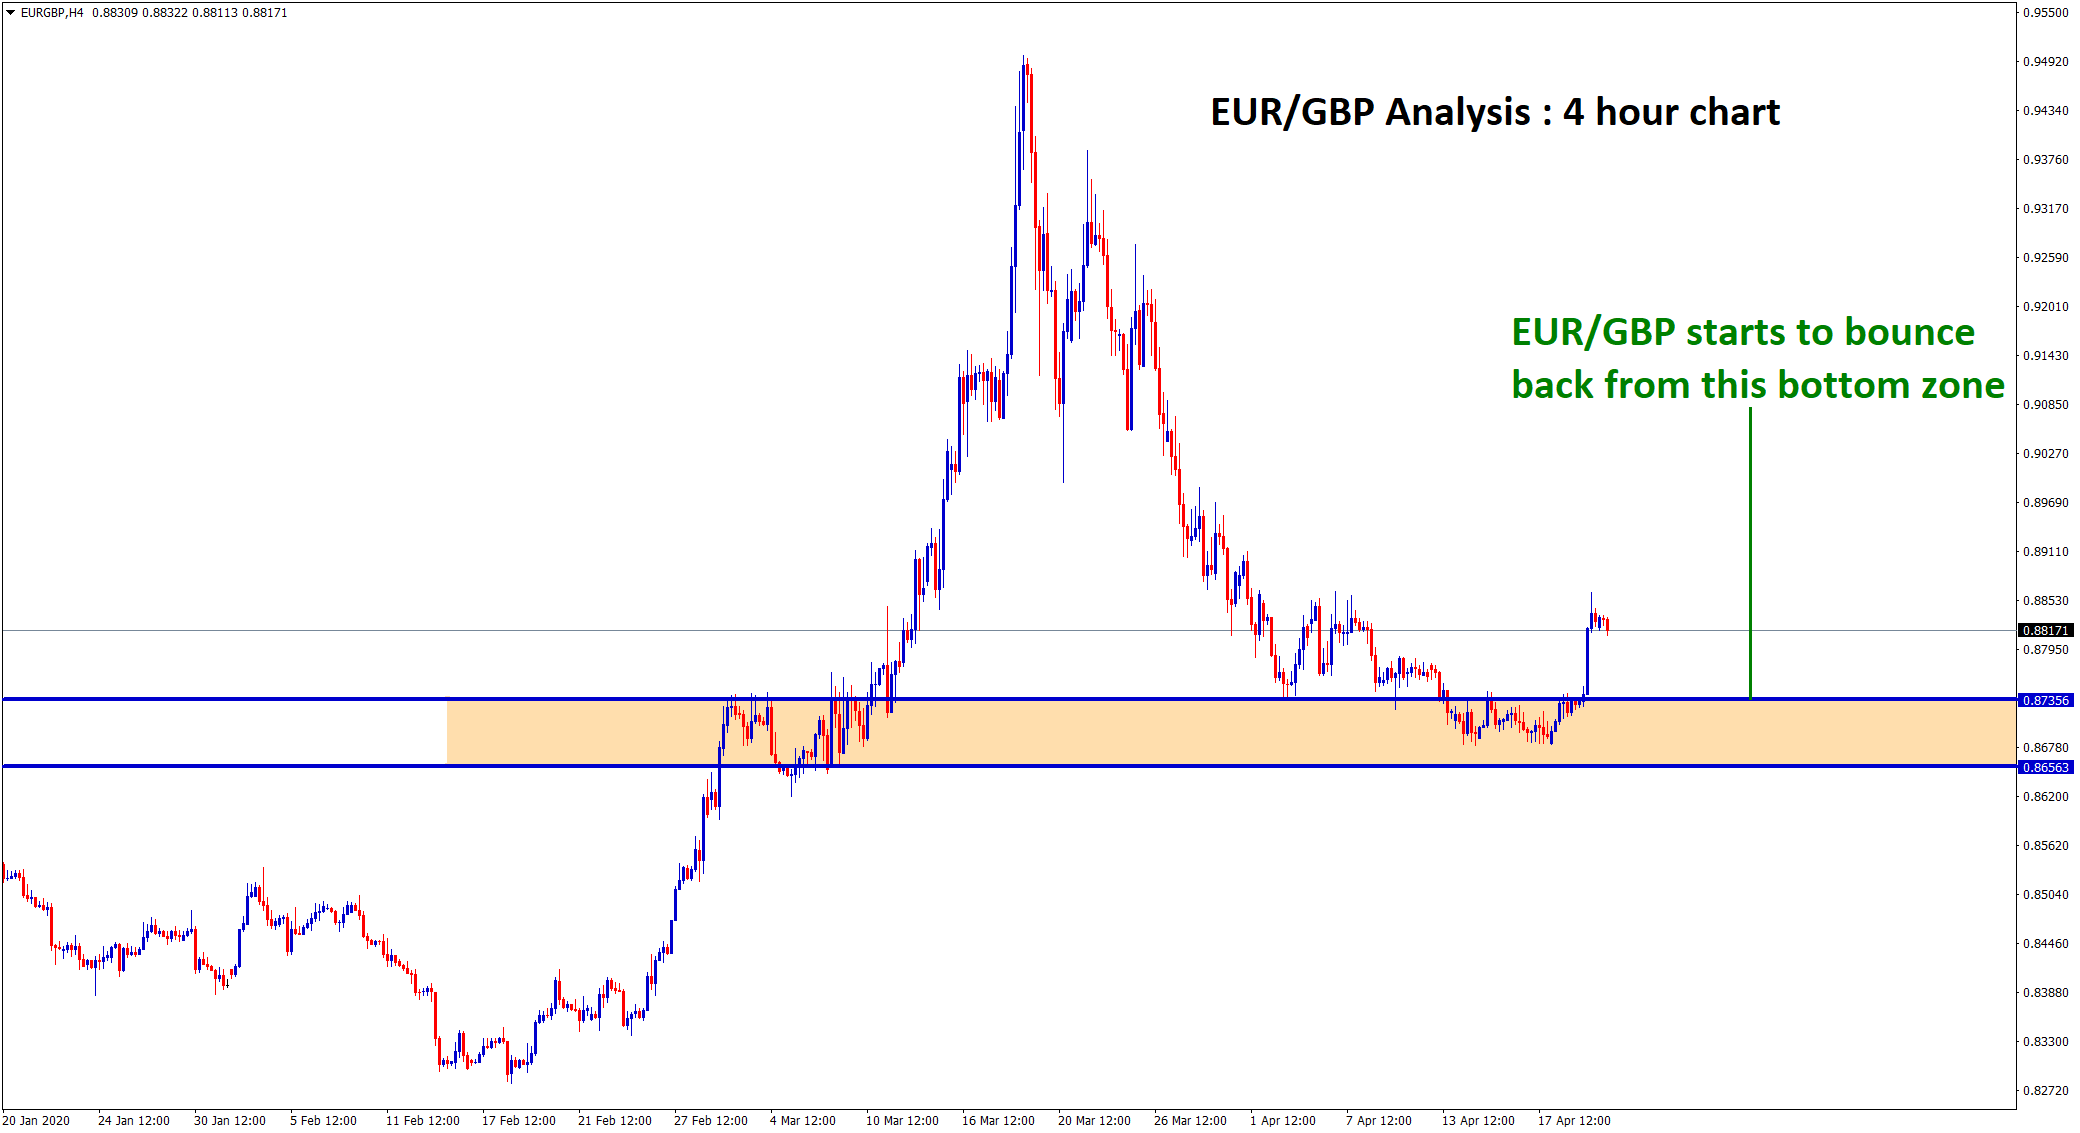
EUR/GBP Analysis : h4 chart EUR/GBP moved in a downtrend for long time without any retracements. Recently market surged from…
-
CAD/JPY Sell signal hit +650 points after triangle breakout
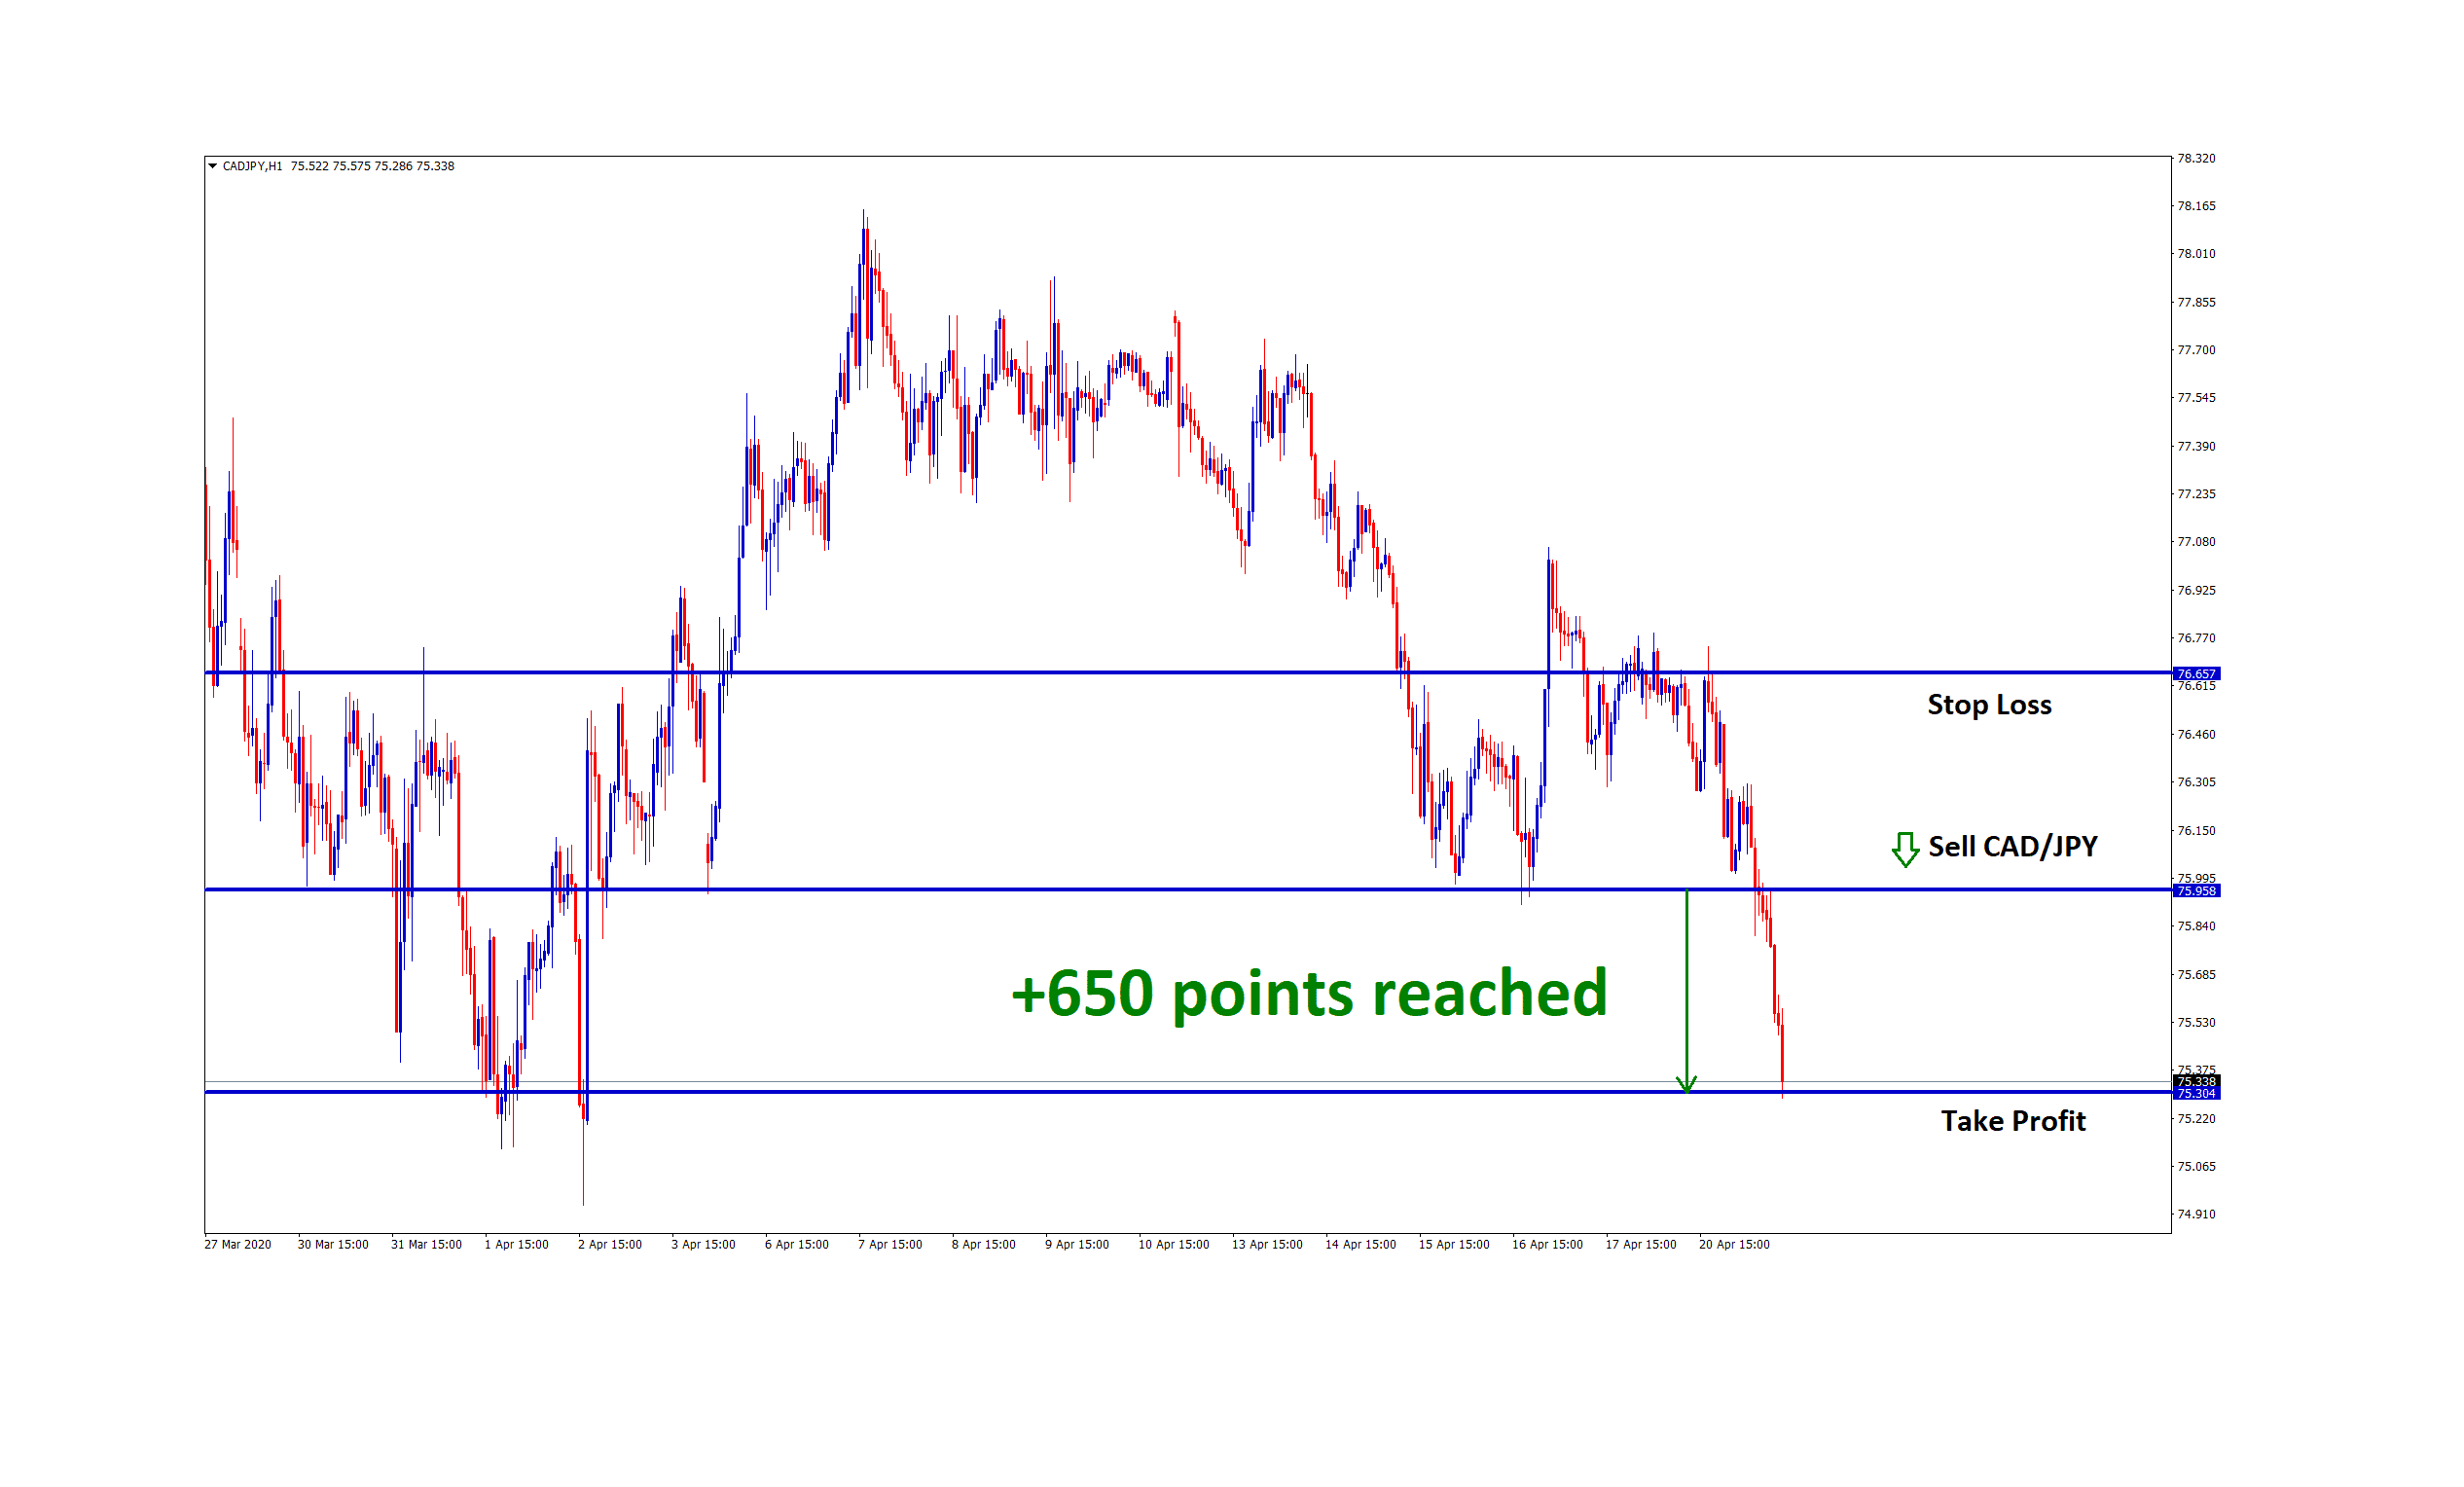
As per our previous CAD/JPY Sell Technical analysis (click here to see) CAD/JPY broken the bottom zone of the Triangle…
-
Traingle pattern broken in CADJPY H4 Chart
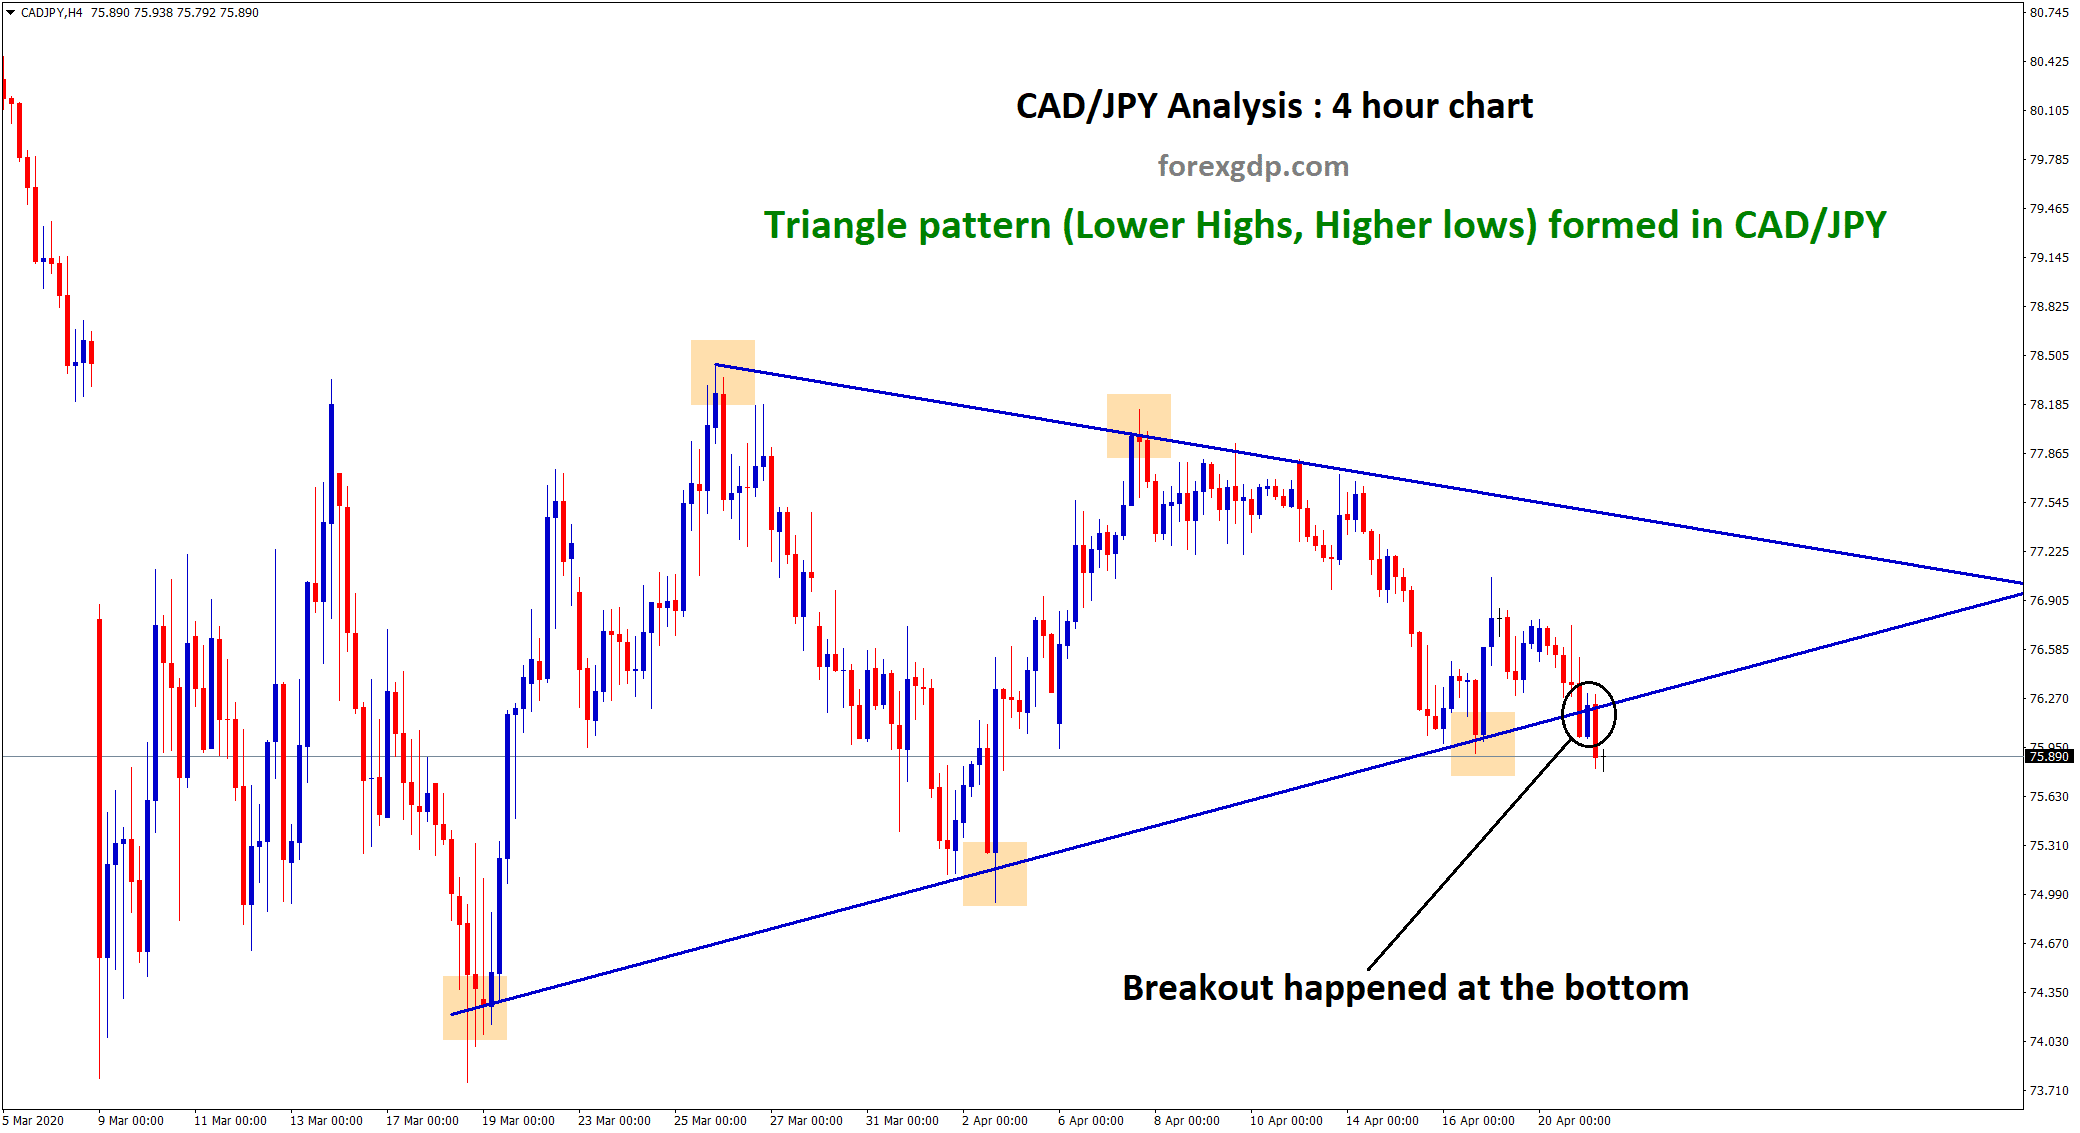
CADJPY Triangle pattern analysis CADJPY formed Lower highs, Higher lows in 4 hour chart analysis which leads to the triangle…
-
NZD/USD buy signal reached -600 points
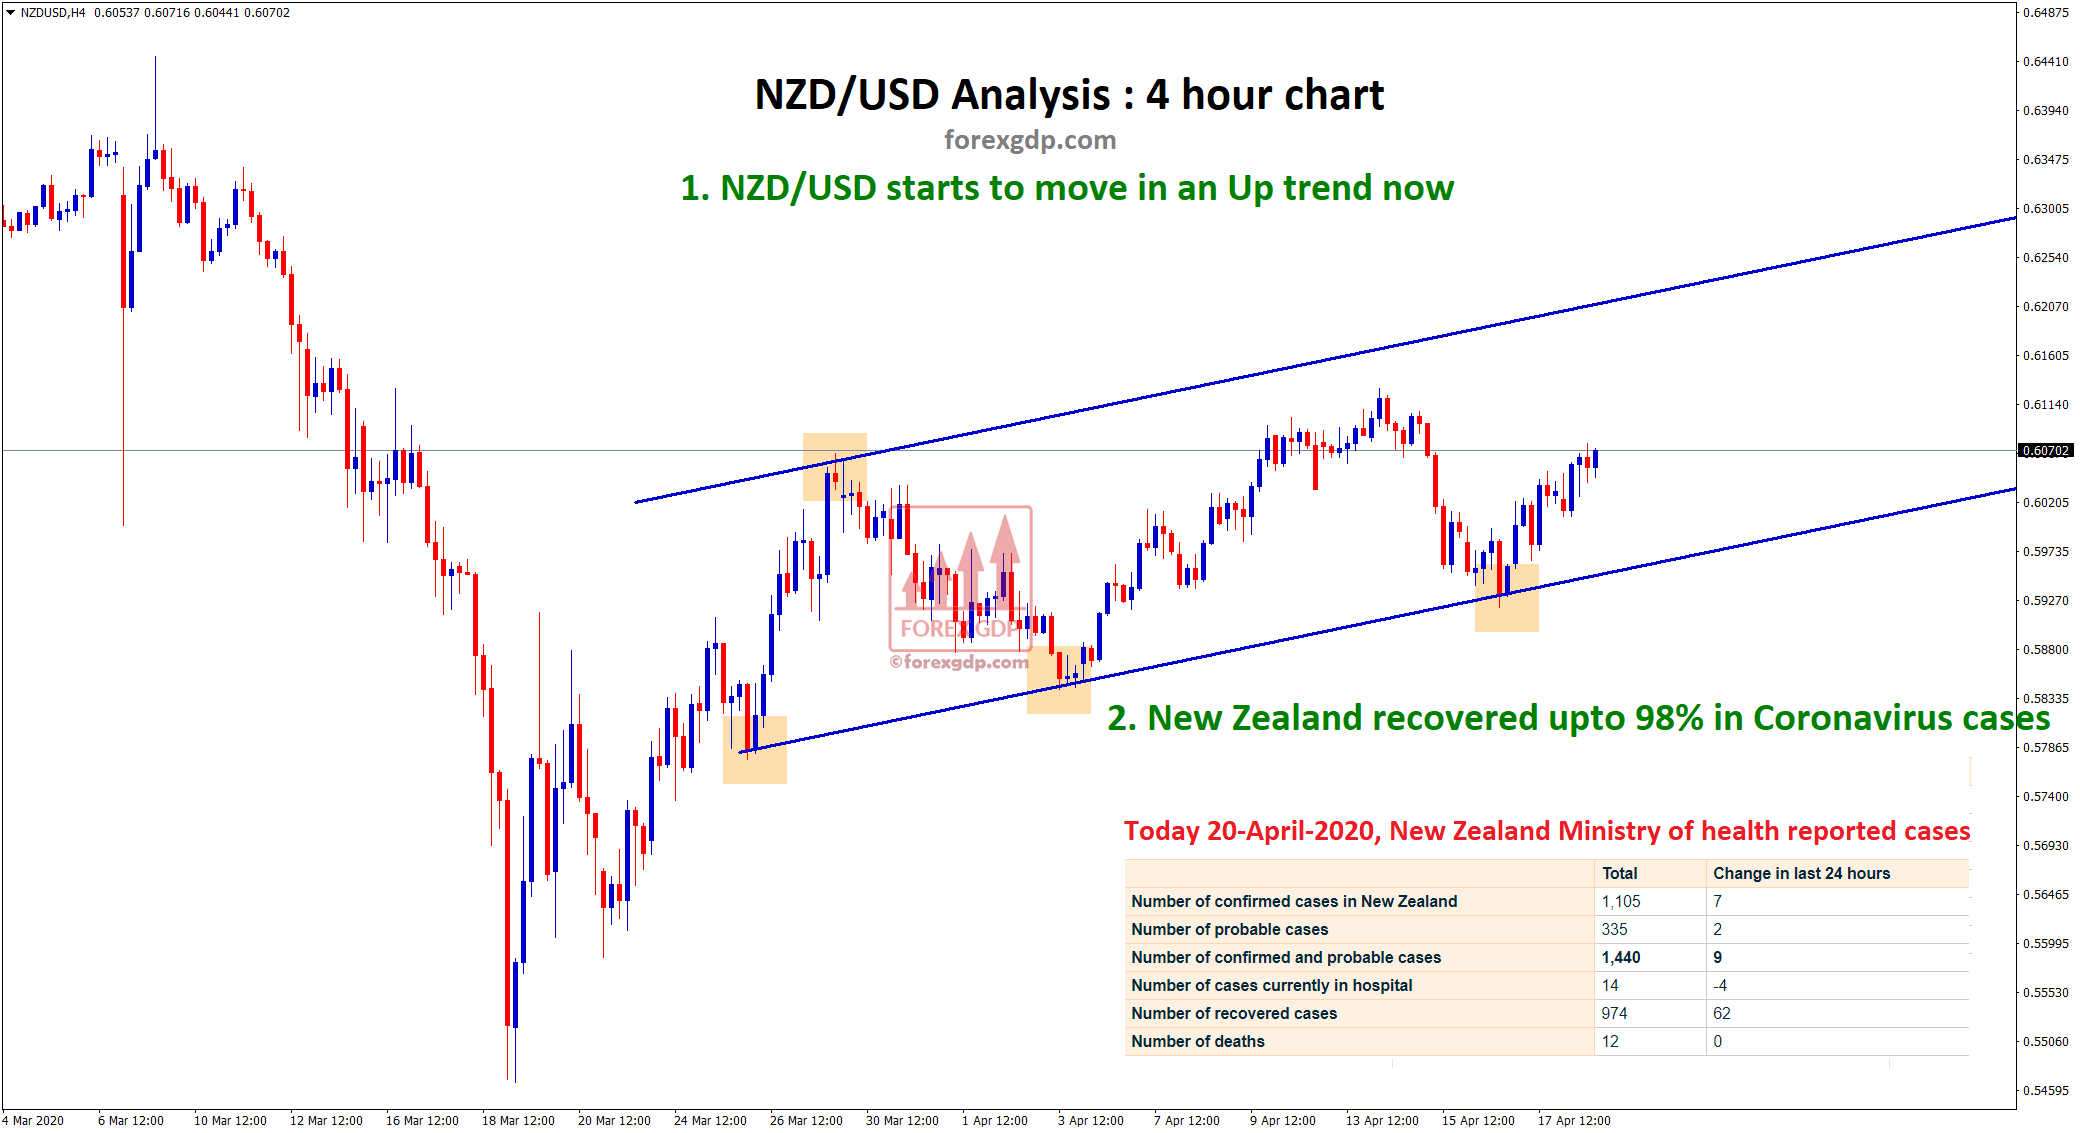
NZD/USD Analysis for Buying Check the technical analysis here : Click here to see NZD/USD was moving in an Uptrend…