Author: forexadmin
-
+2192 Points Reached in CADJPY Buy signal after rebounding from the support area
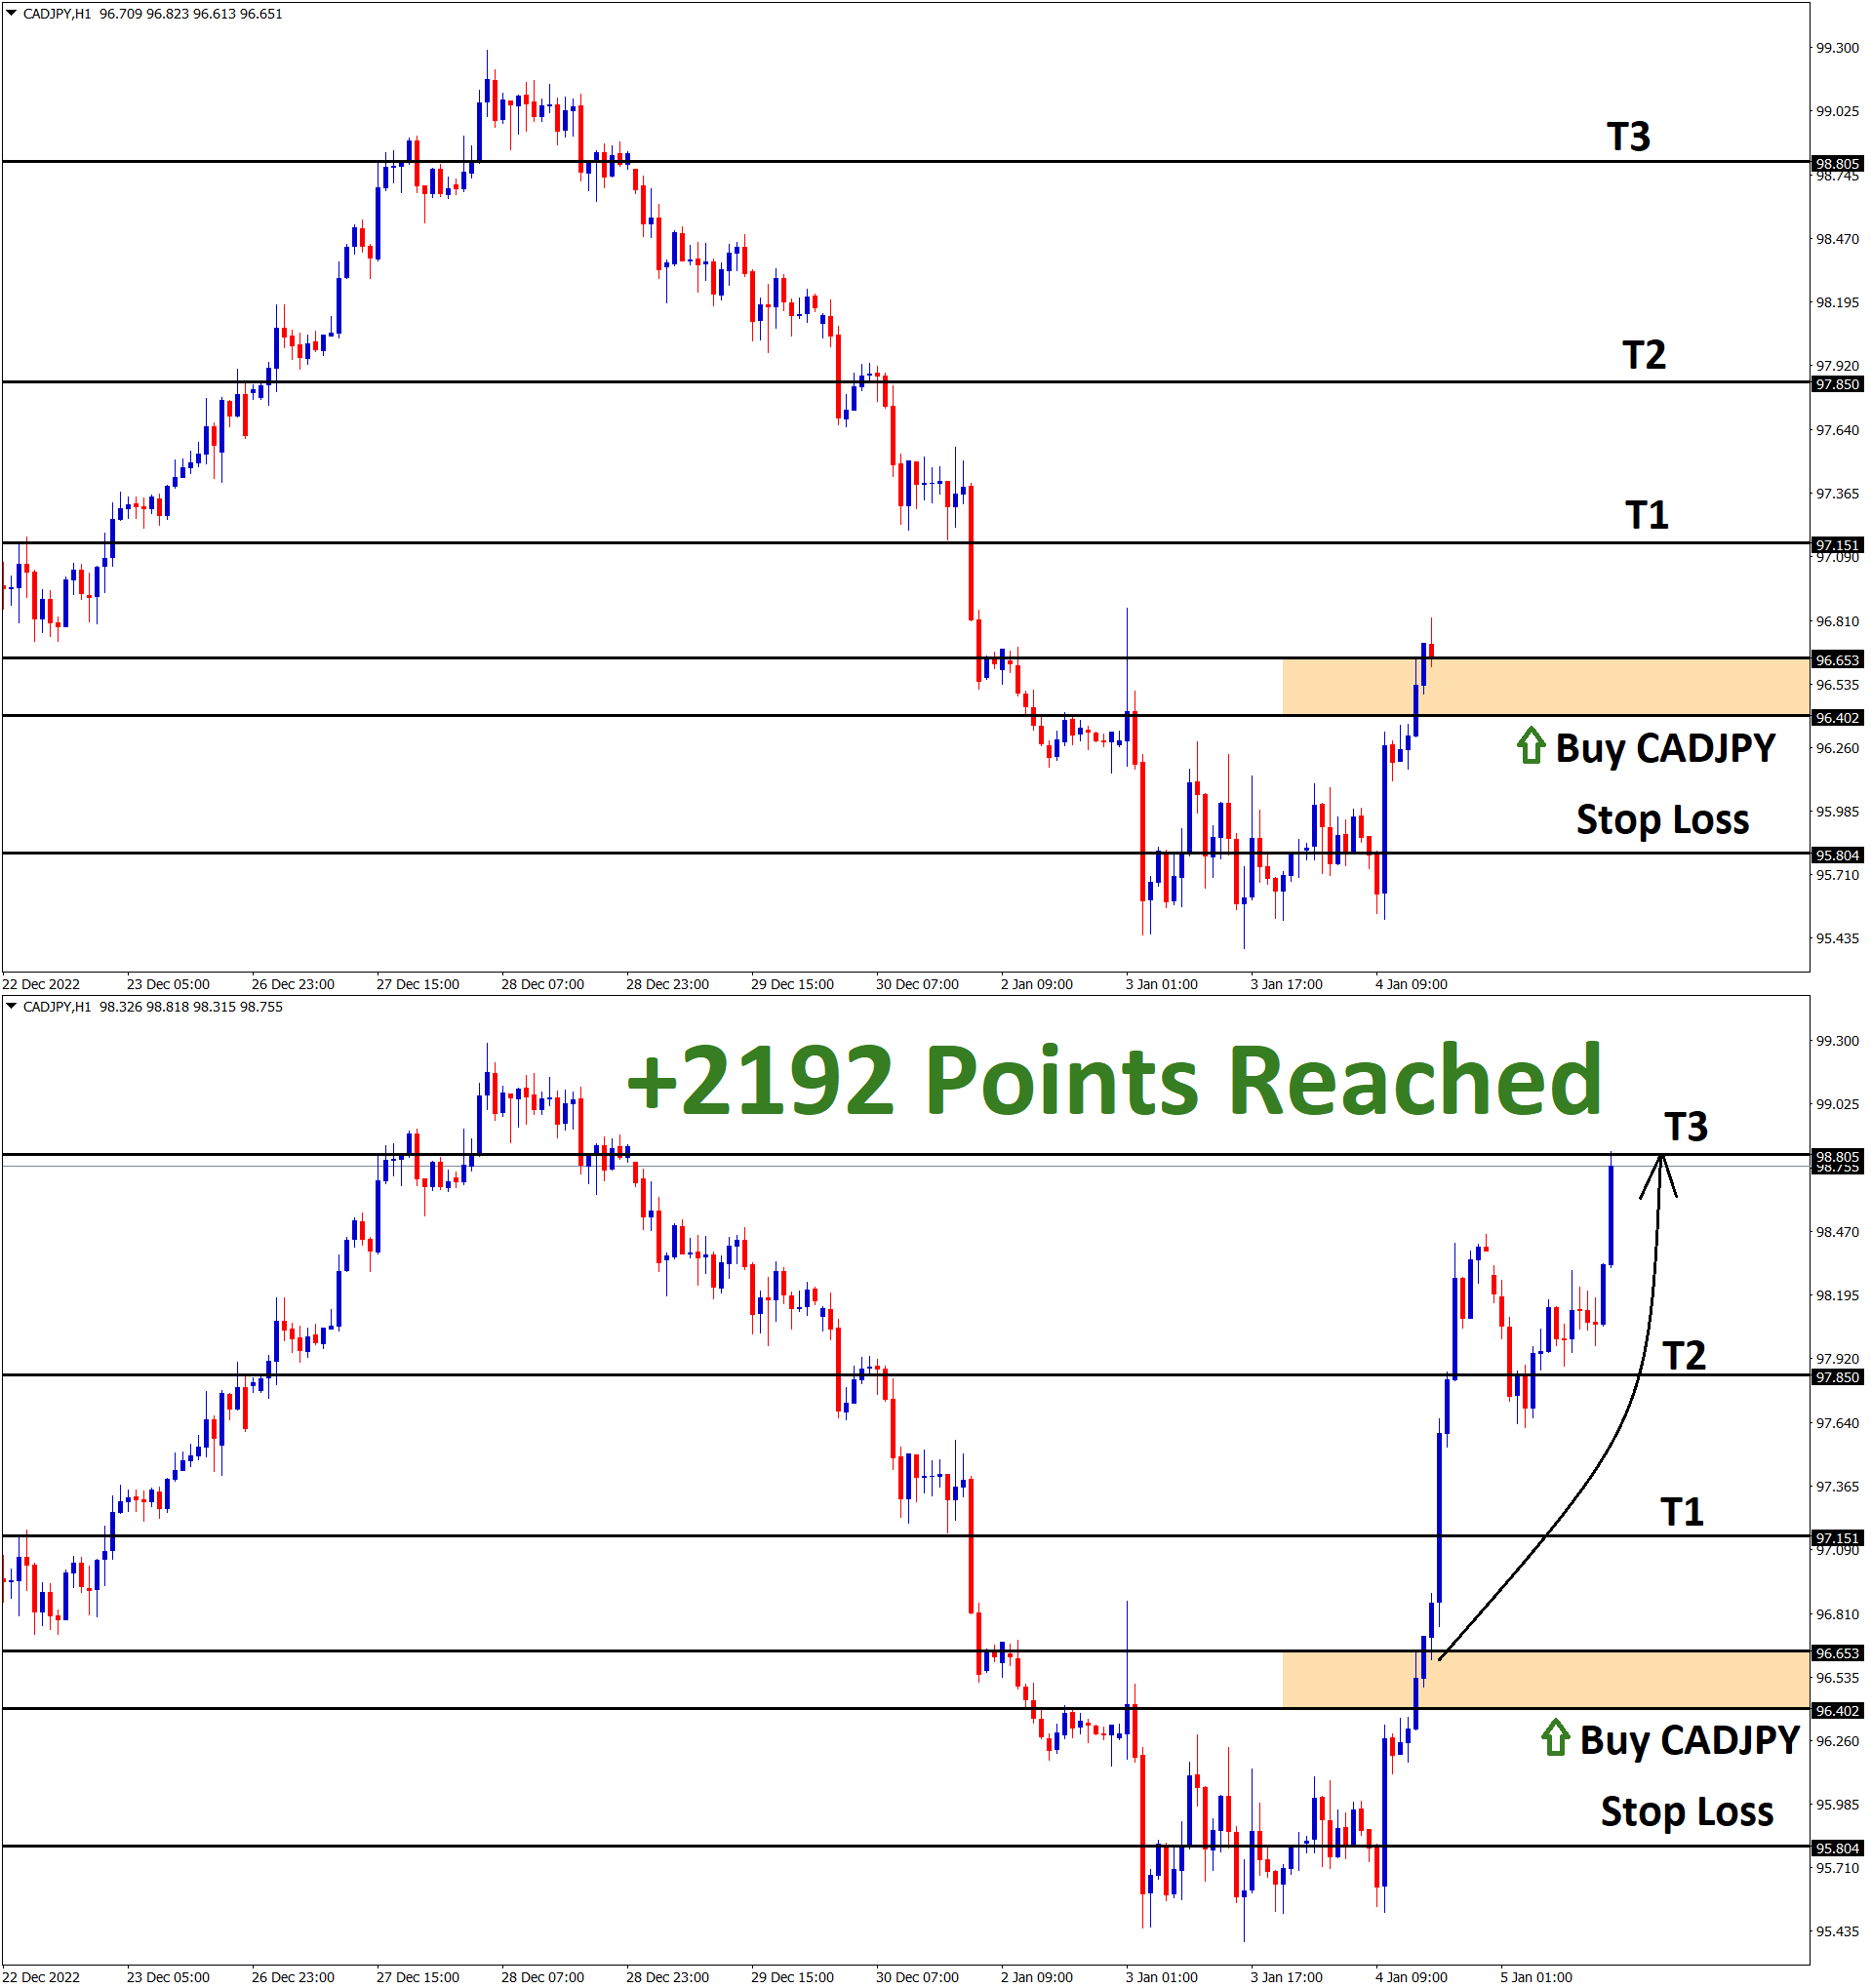
CADJPY Analysis: CADJPY is rebounding from the support area of the descending Triangle in the 4-hour timeframe chart. After the…
-
+450 Points Reached in USDCHF Buy signal after breaking and rebounding from the retest area
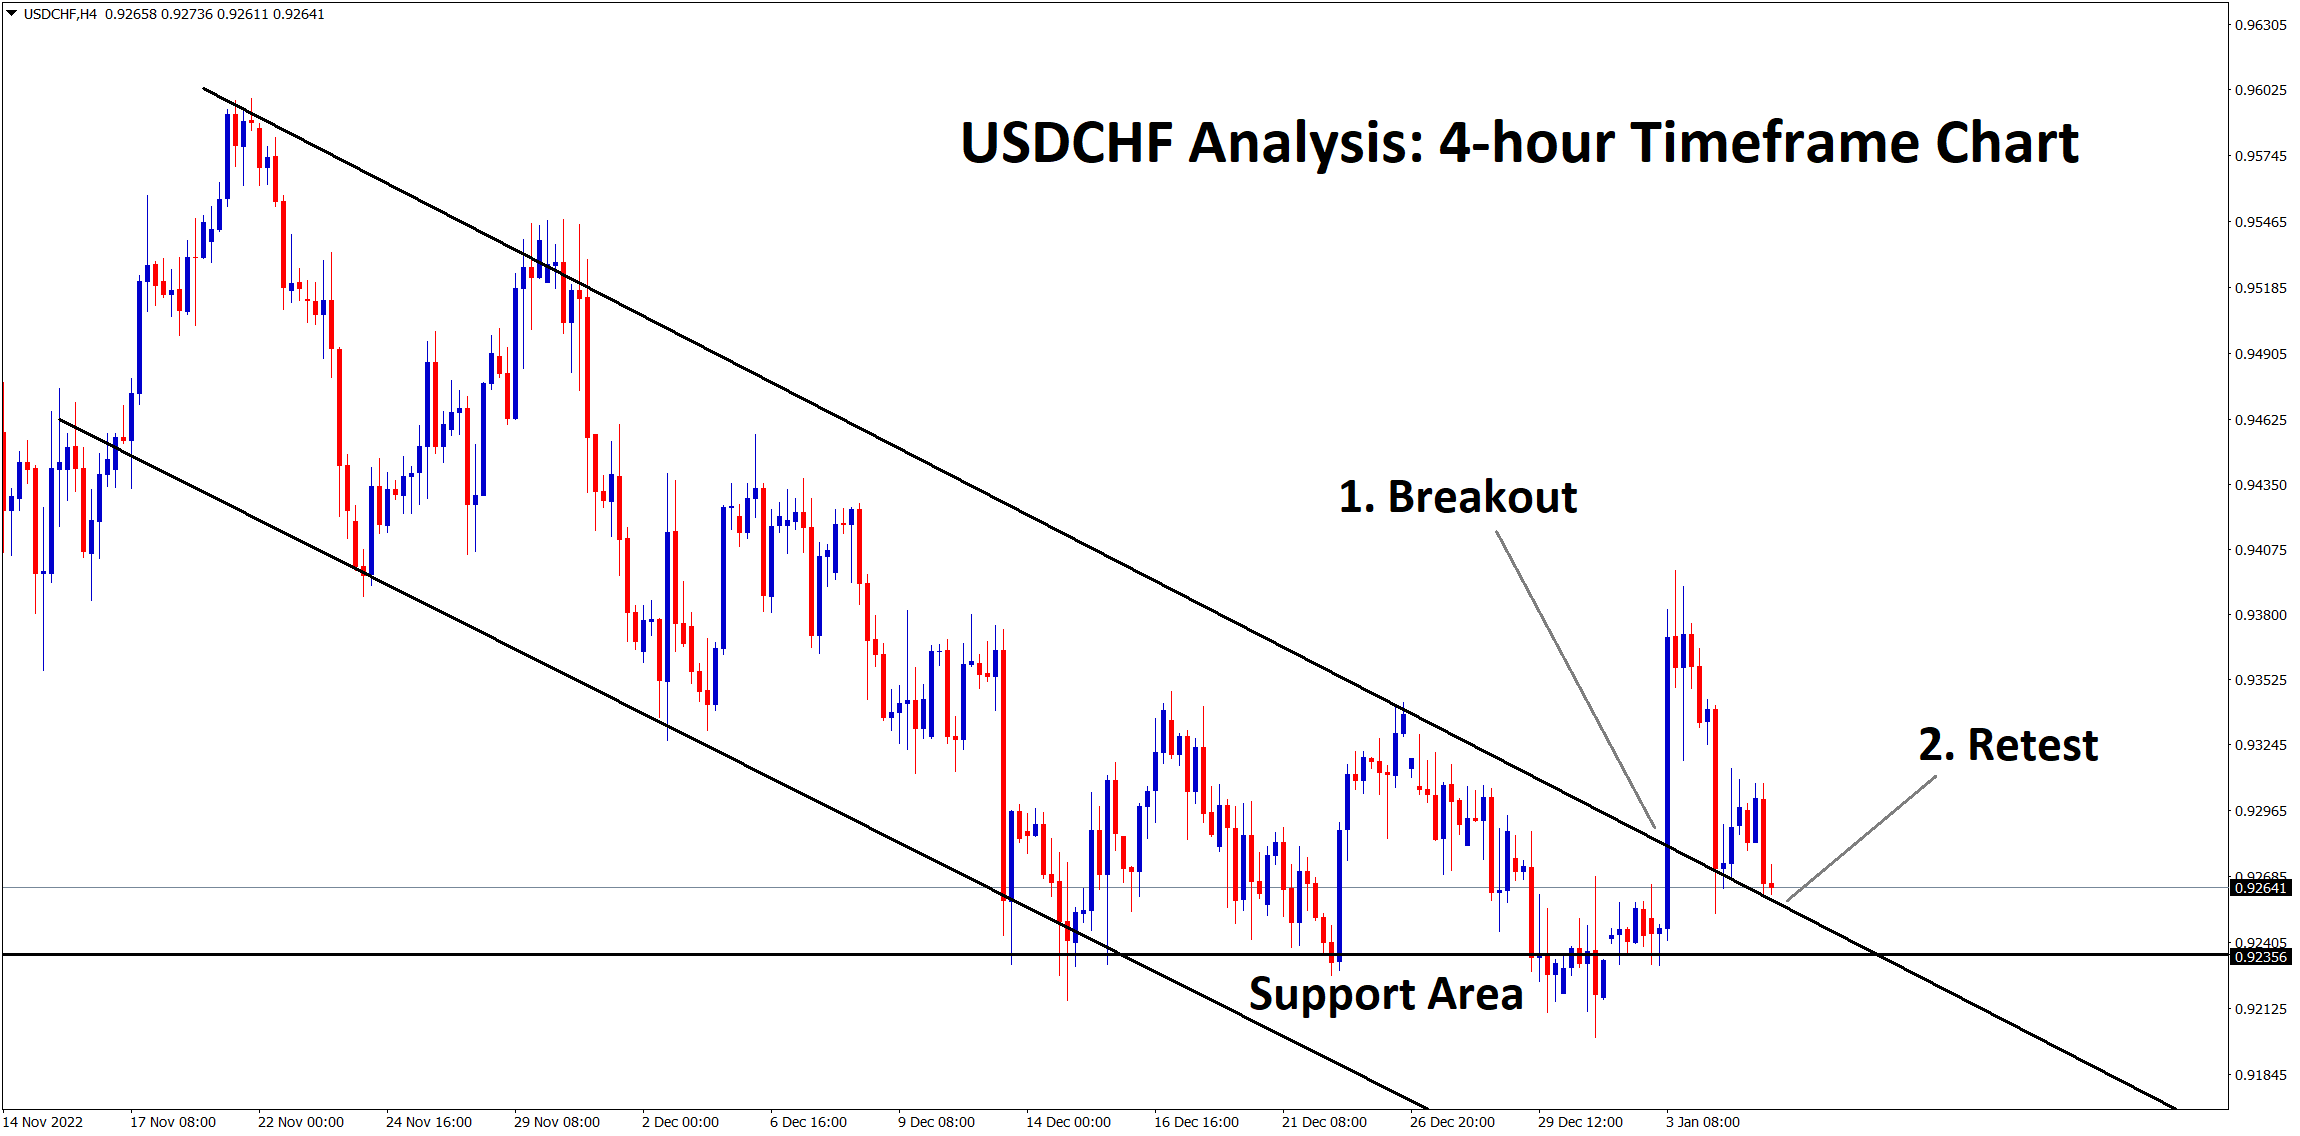
USDCHF Analysis: USDCHF has broken the top area of the minor descending channel and rebounded from the retest area in…
-
+1237 Points Reached in CADJPY Buy signal after rebounding from the support area
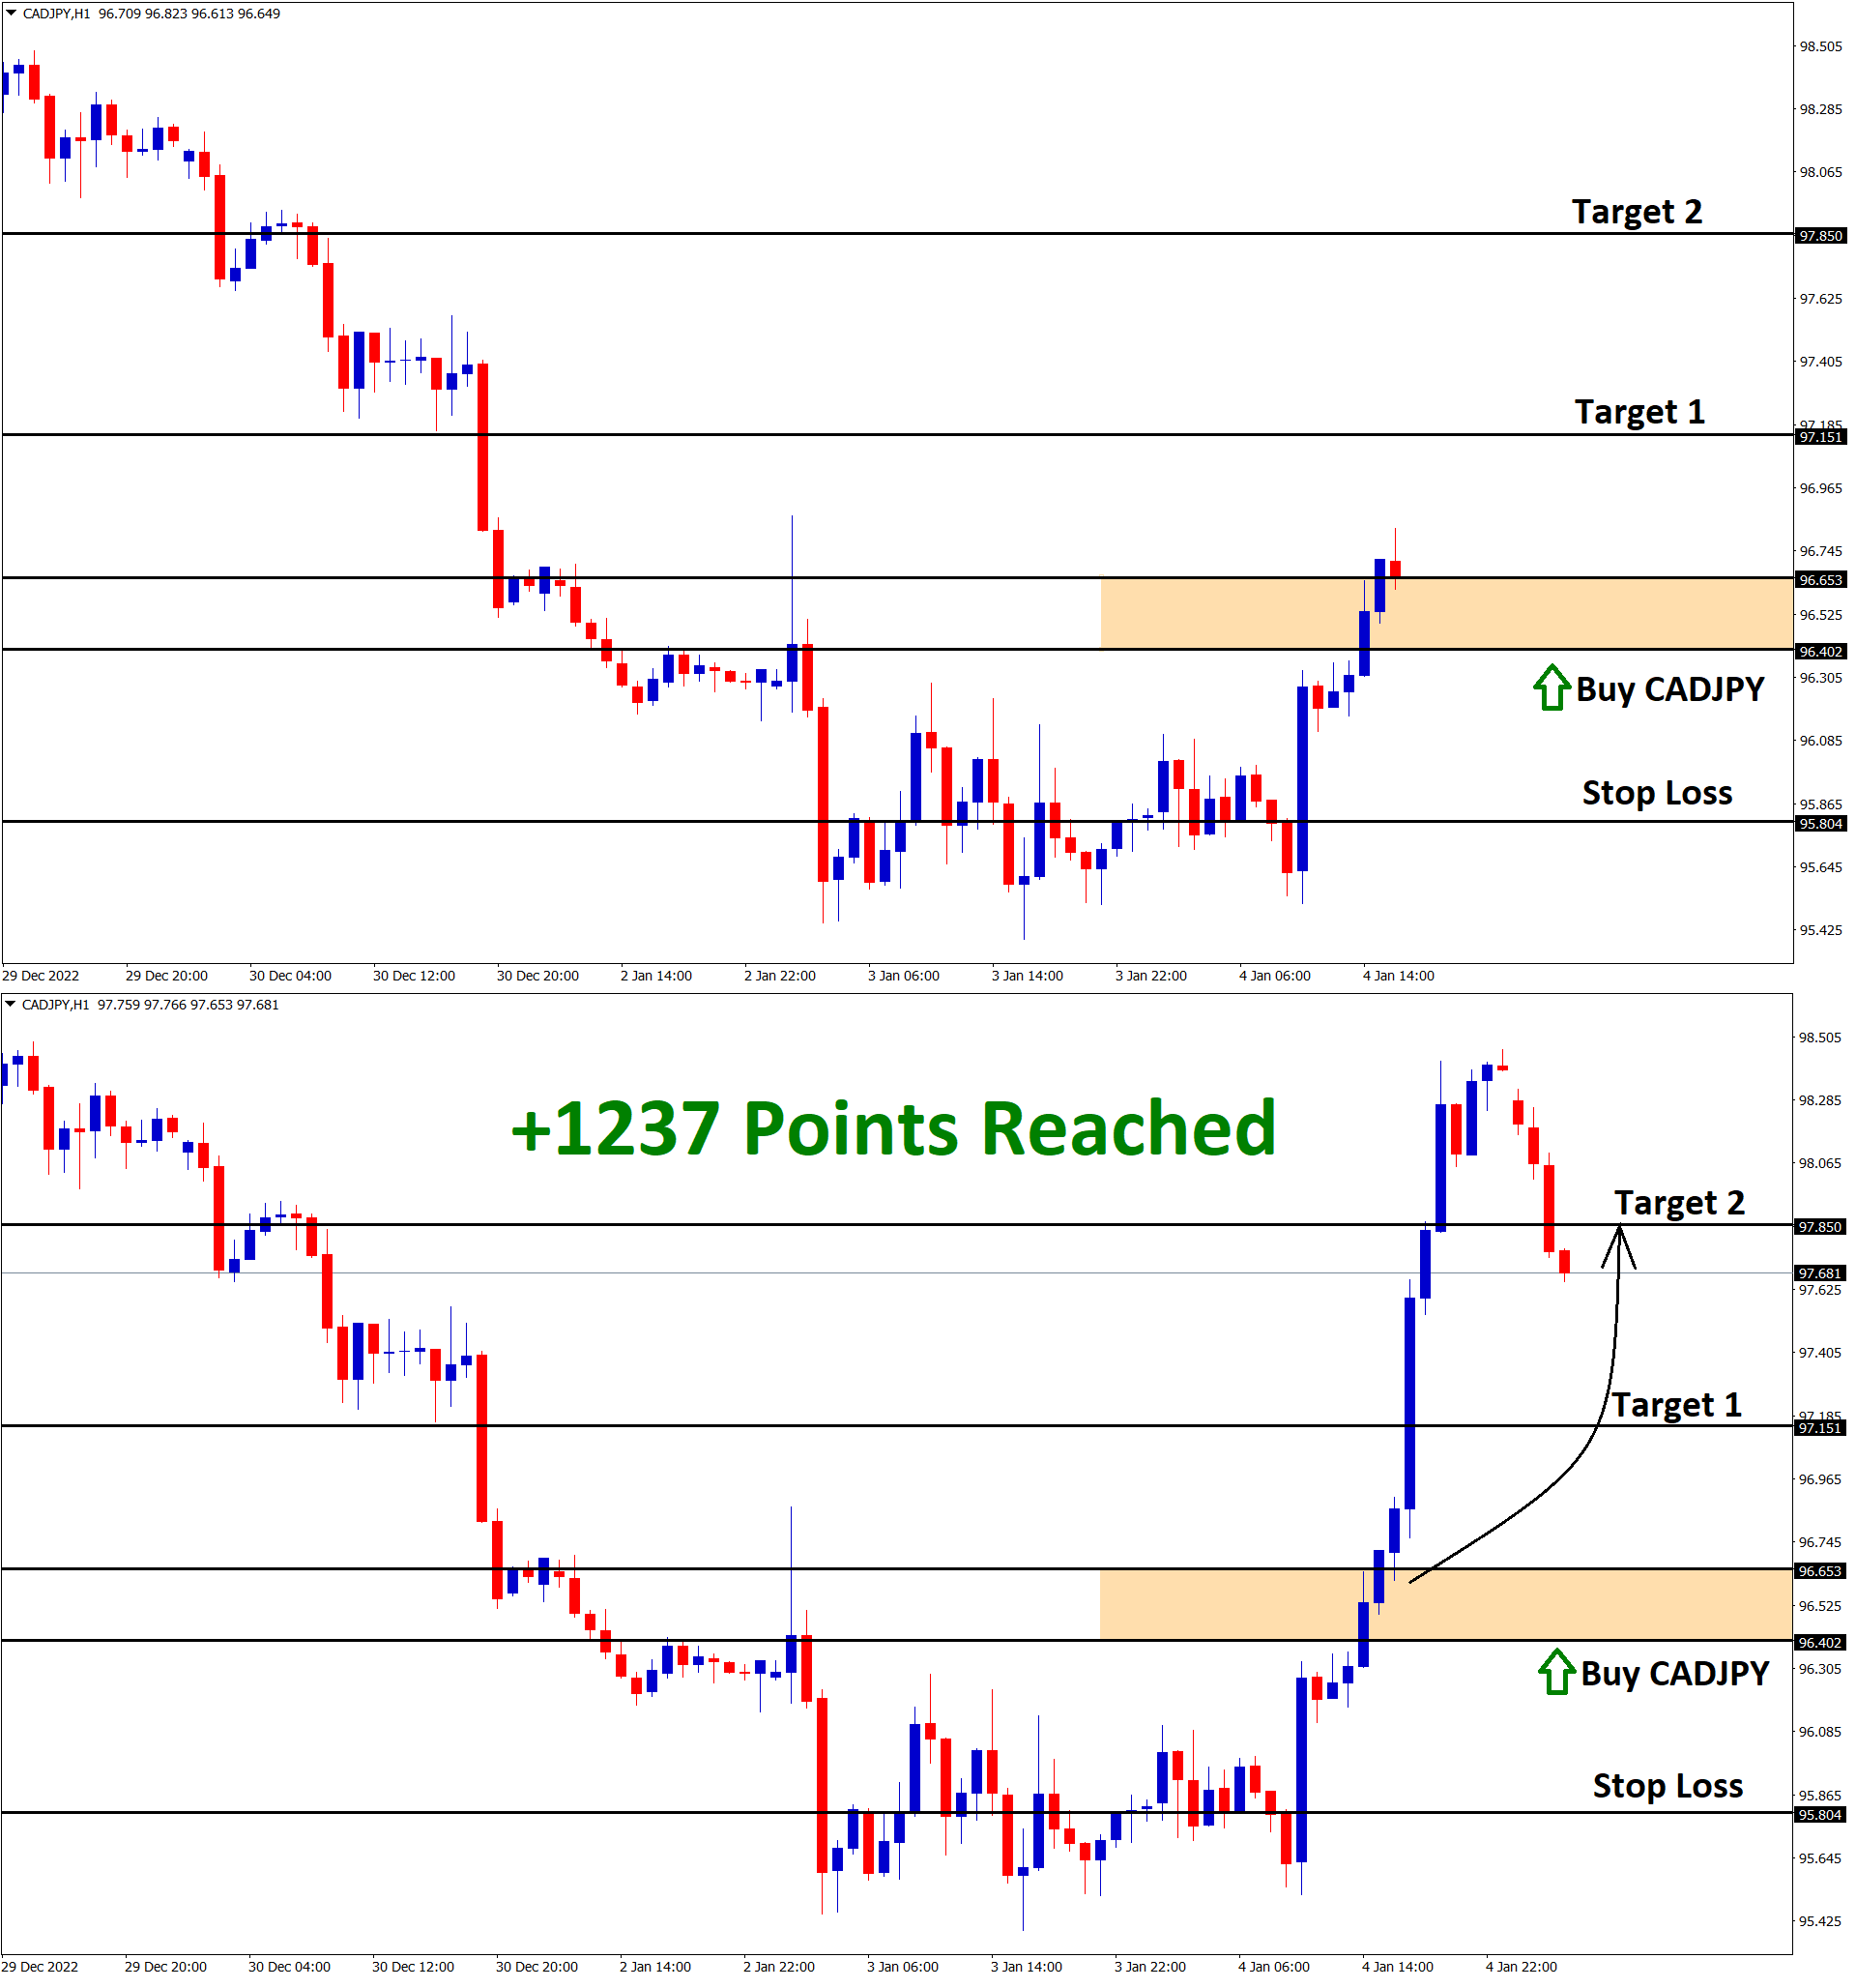
CADJPY Analysis: CADJPY is rebounding from the support area of the descending Triangle in the 4-hour timeframe chart. After the…
-
+537 Points Reached in CADJPY Buy signal after rebounding from the support area
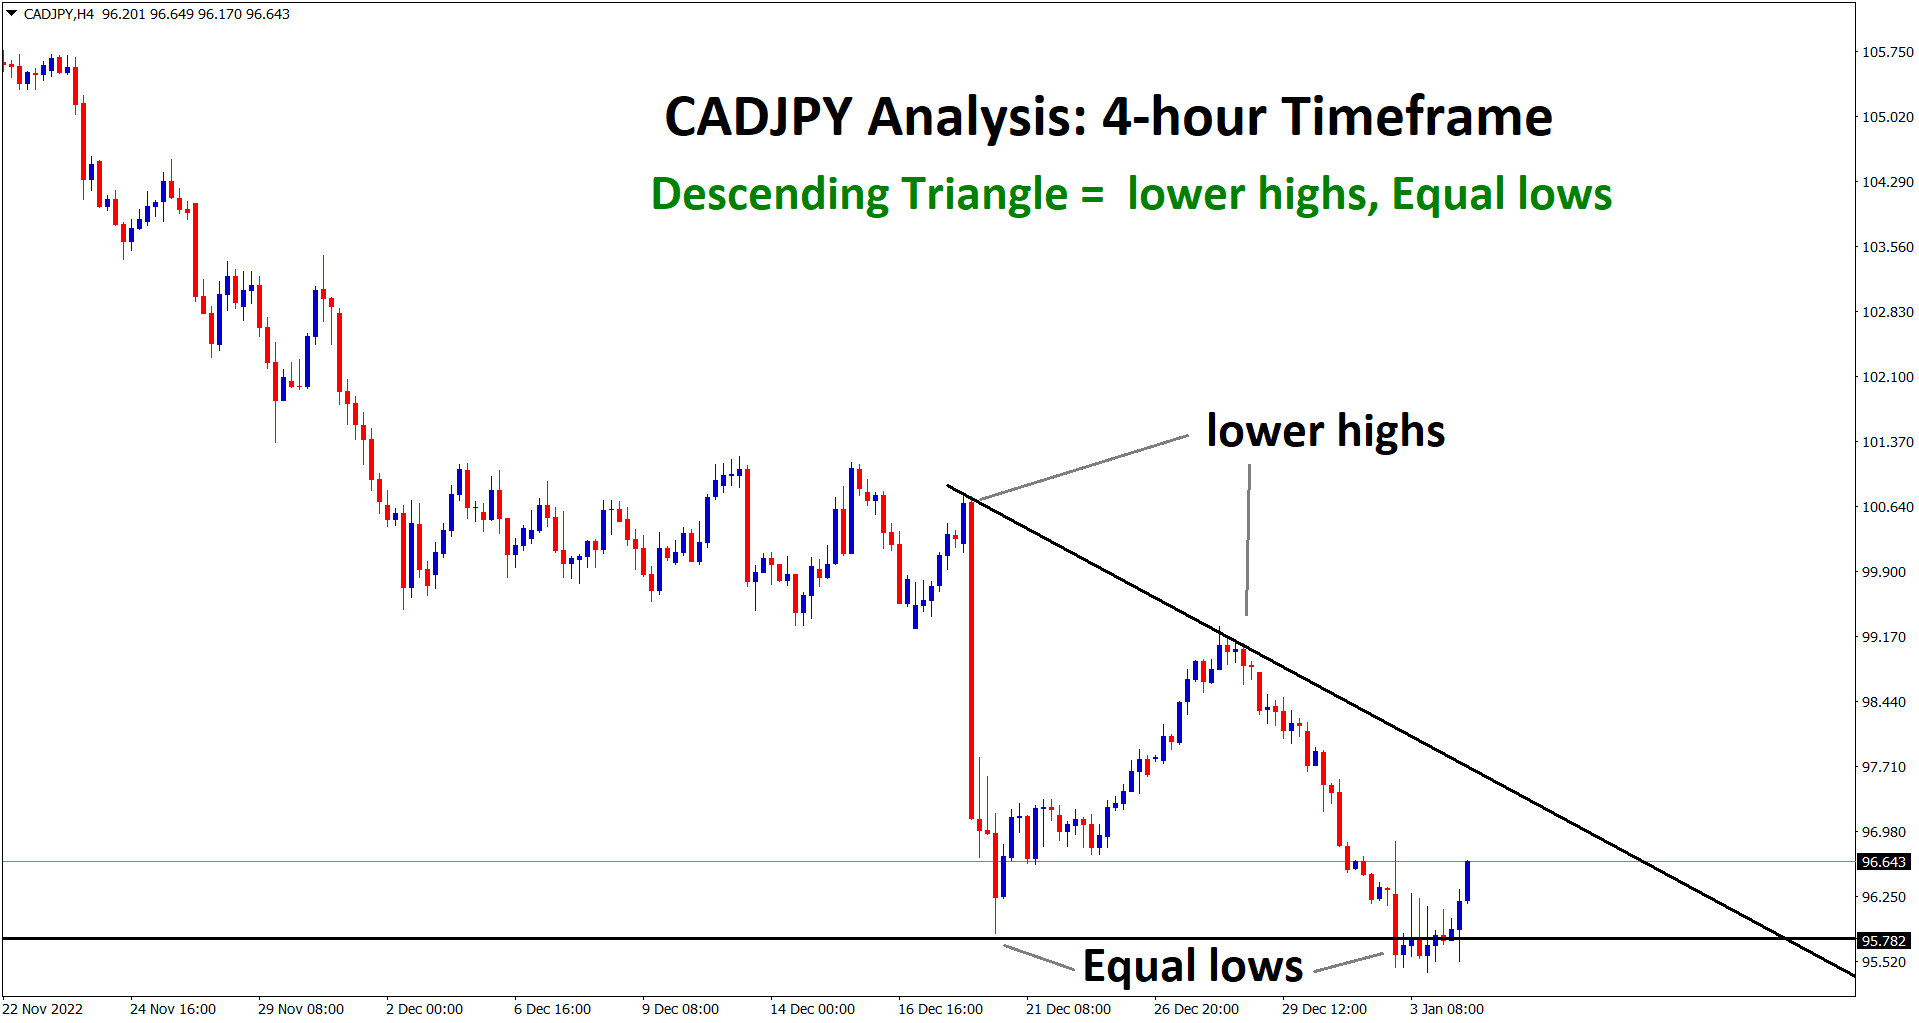
CADJPY Analysis: CADJPY is rebounding from the support area of the descending Triangle in the 4-hour timeframe chart. After the…
-
+1400 Points Reached in USDCHF Buy signal after rebounded from the support area
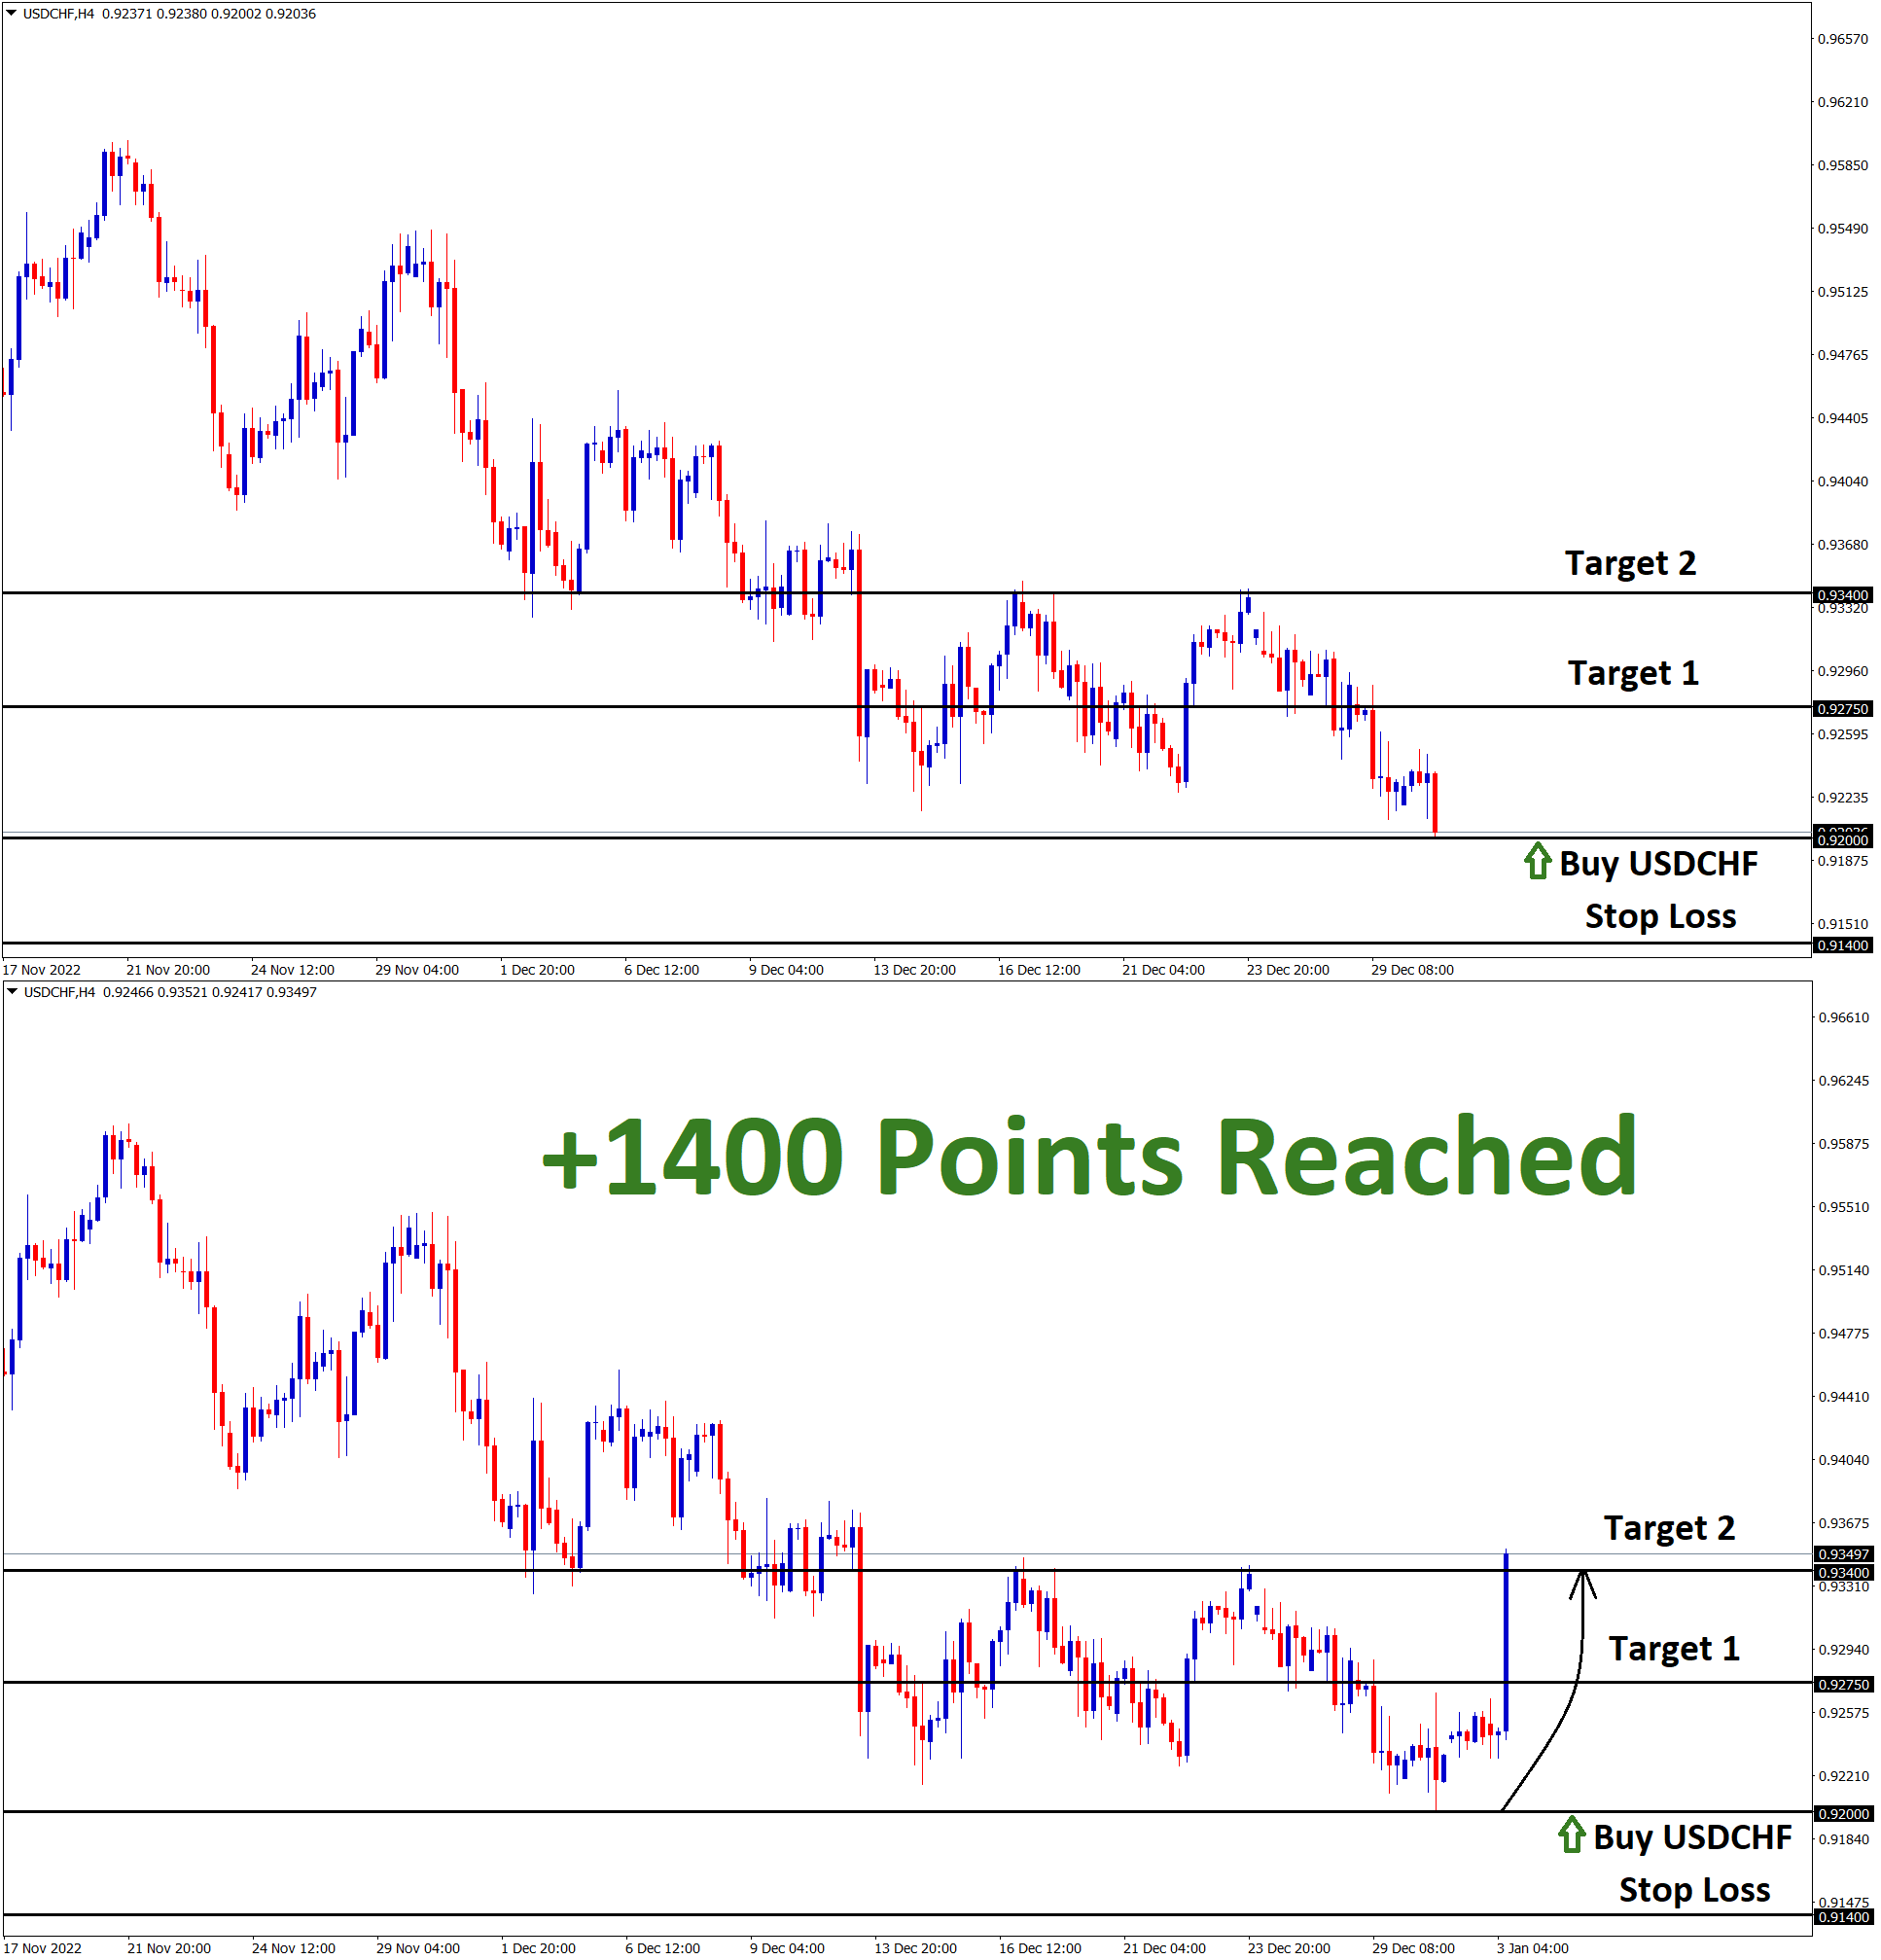
USDCHF Analysis: USDCHF reached the support area in the hourly chart. After the confirmation of the Upward movement, the USDCHF…
-
+750 Points Reached in USDCHF Buy signal after rebounded from the support area
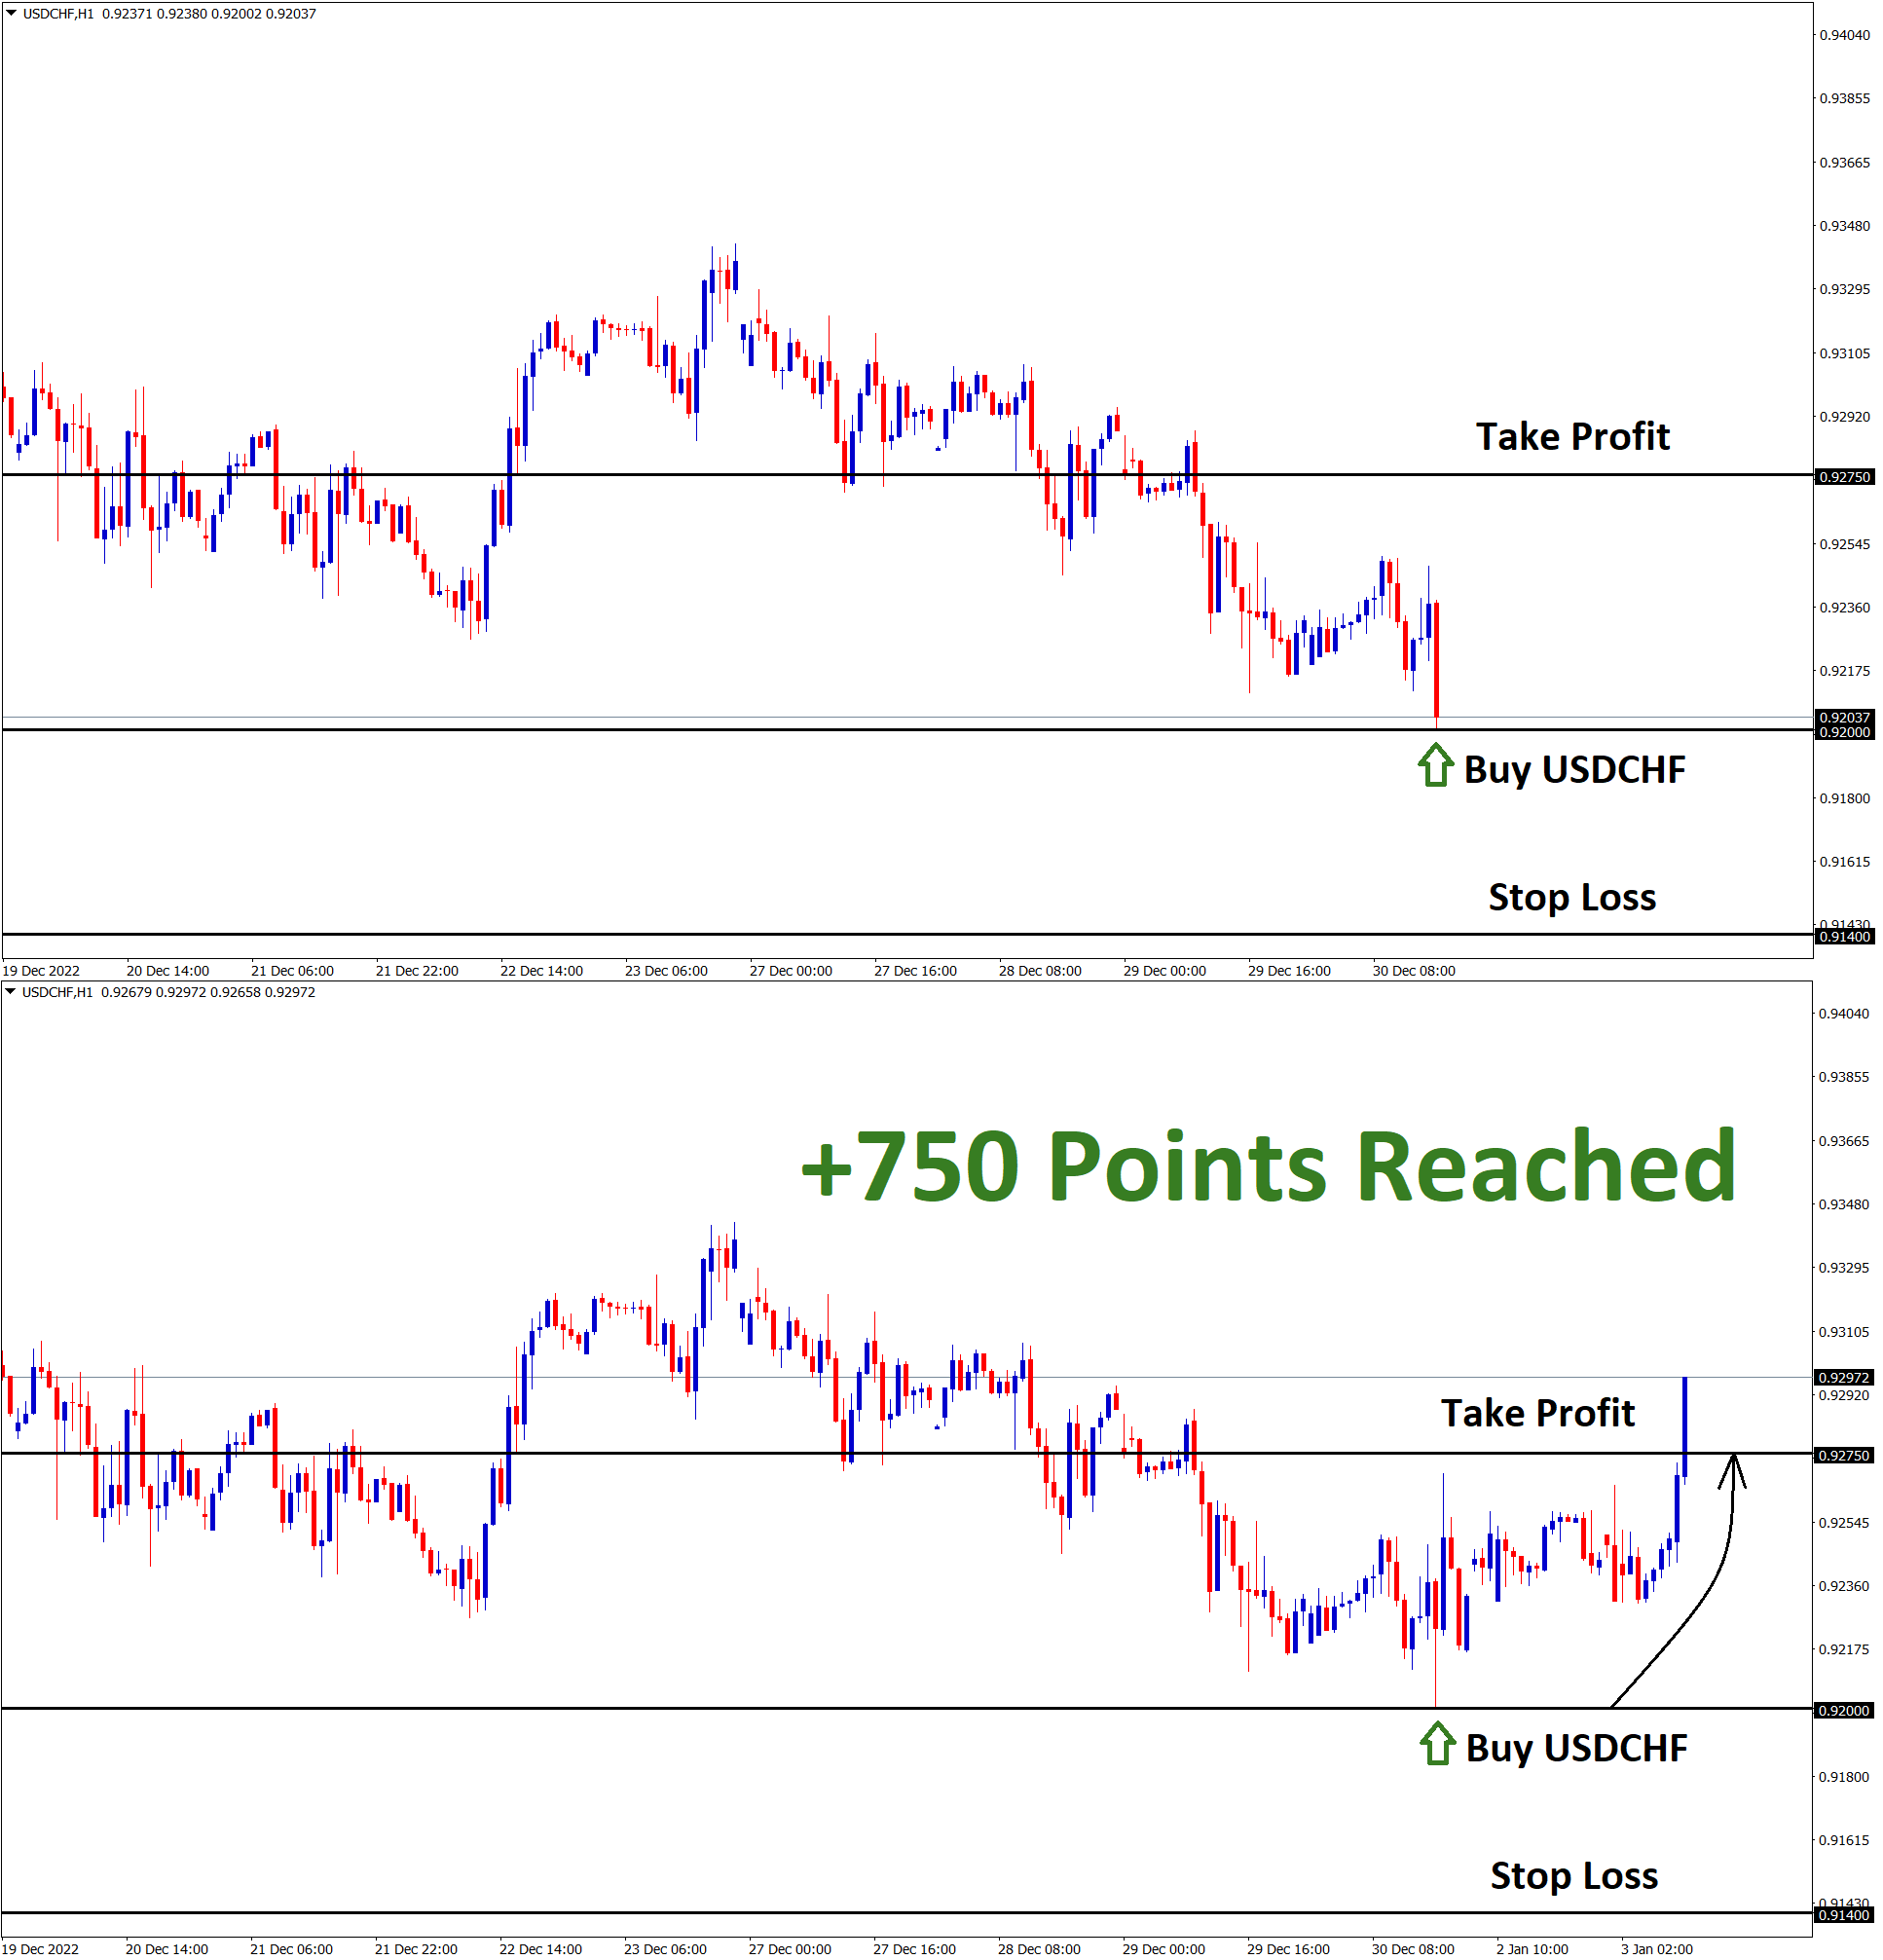
USDCHF Analysis: USDCHF reached the support area in the hourly chart. After the confirmation of the Upward movement, the USDCHF…
-
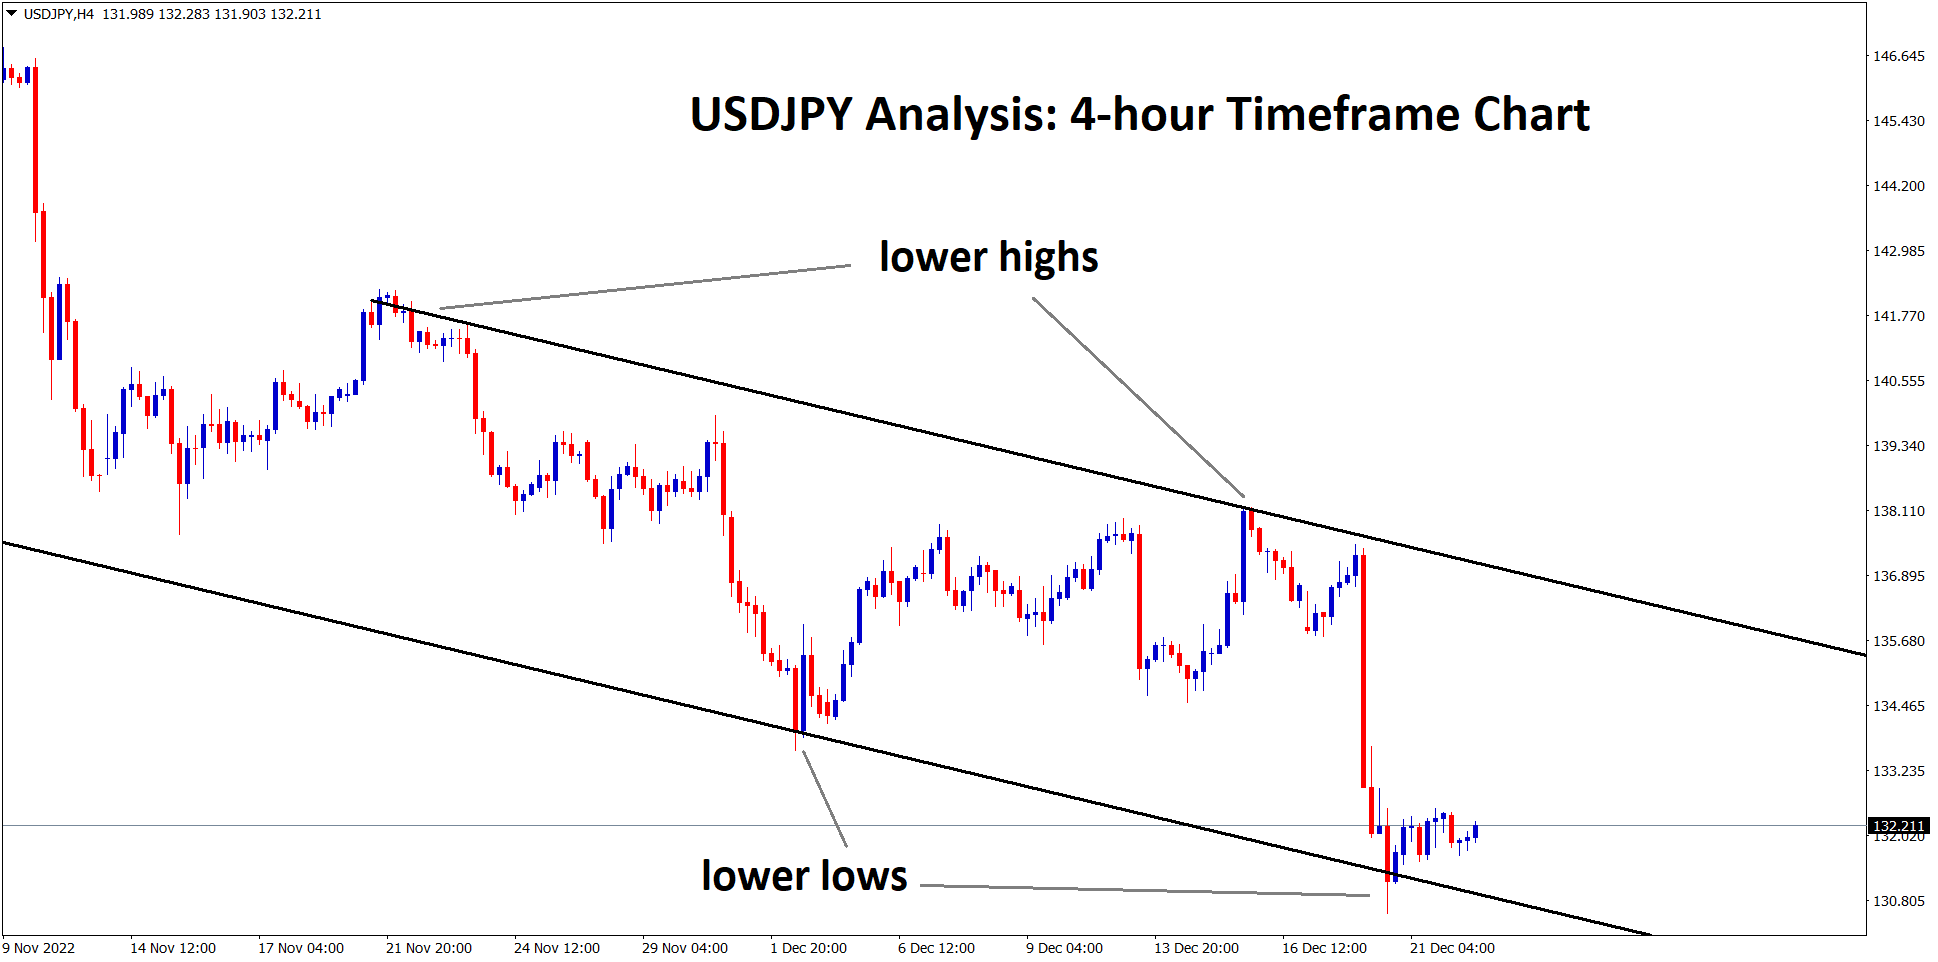
+680 Points Reached in USDJPY Buy signal after reaching the support area in the 4-hour timeframe chart
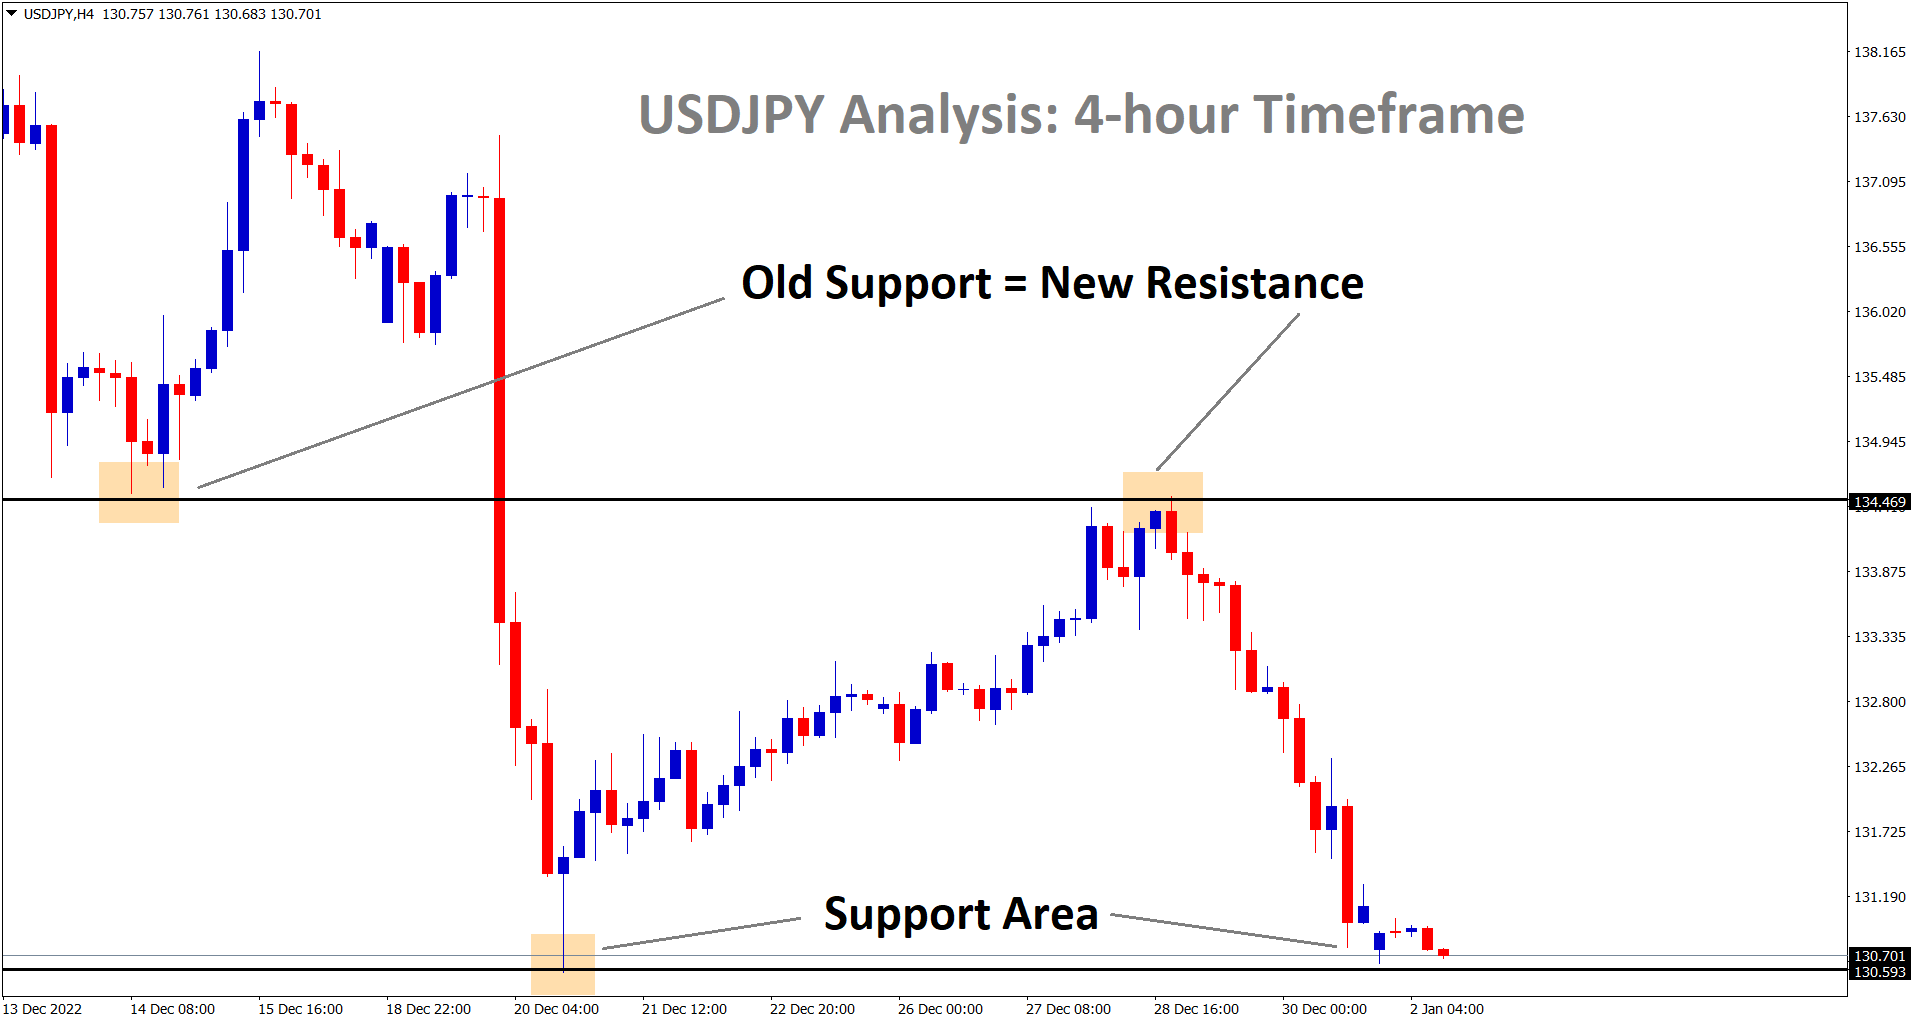
USDJPY Analysis: USDJPY reached the support area in the 4-hour timeframe chart. After the confirmation of the Upward movement, the…
-
+530 Points Reached in AUDUSD Sell signal after breaking the major ascending channel and retesting
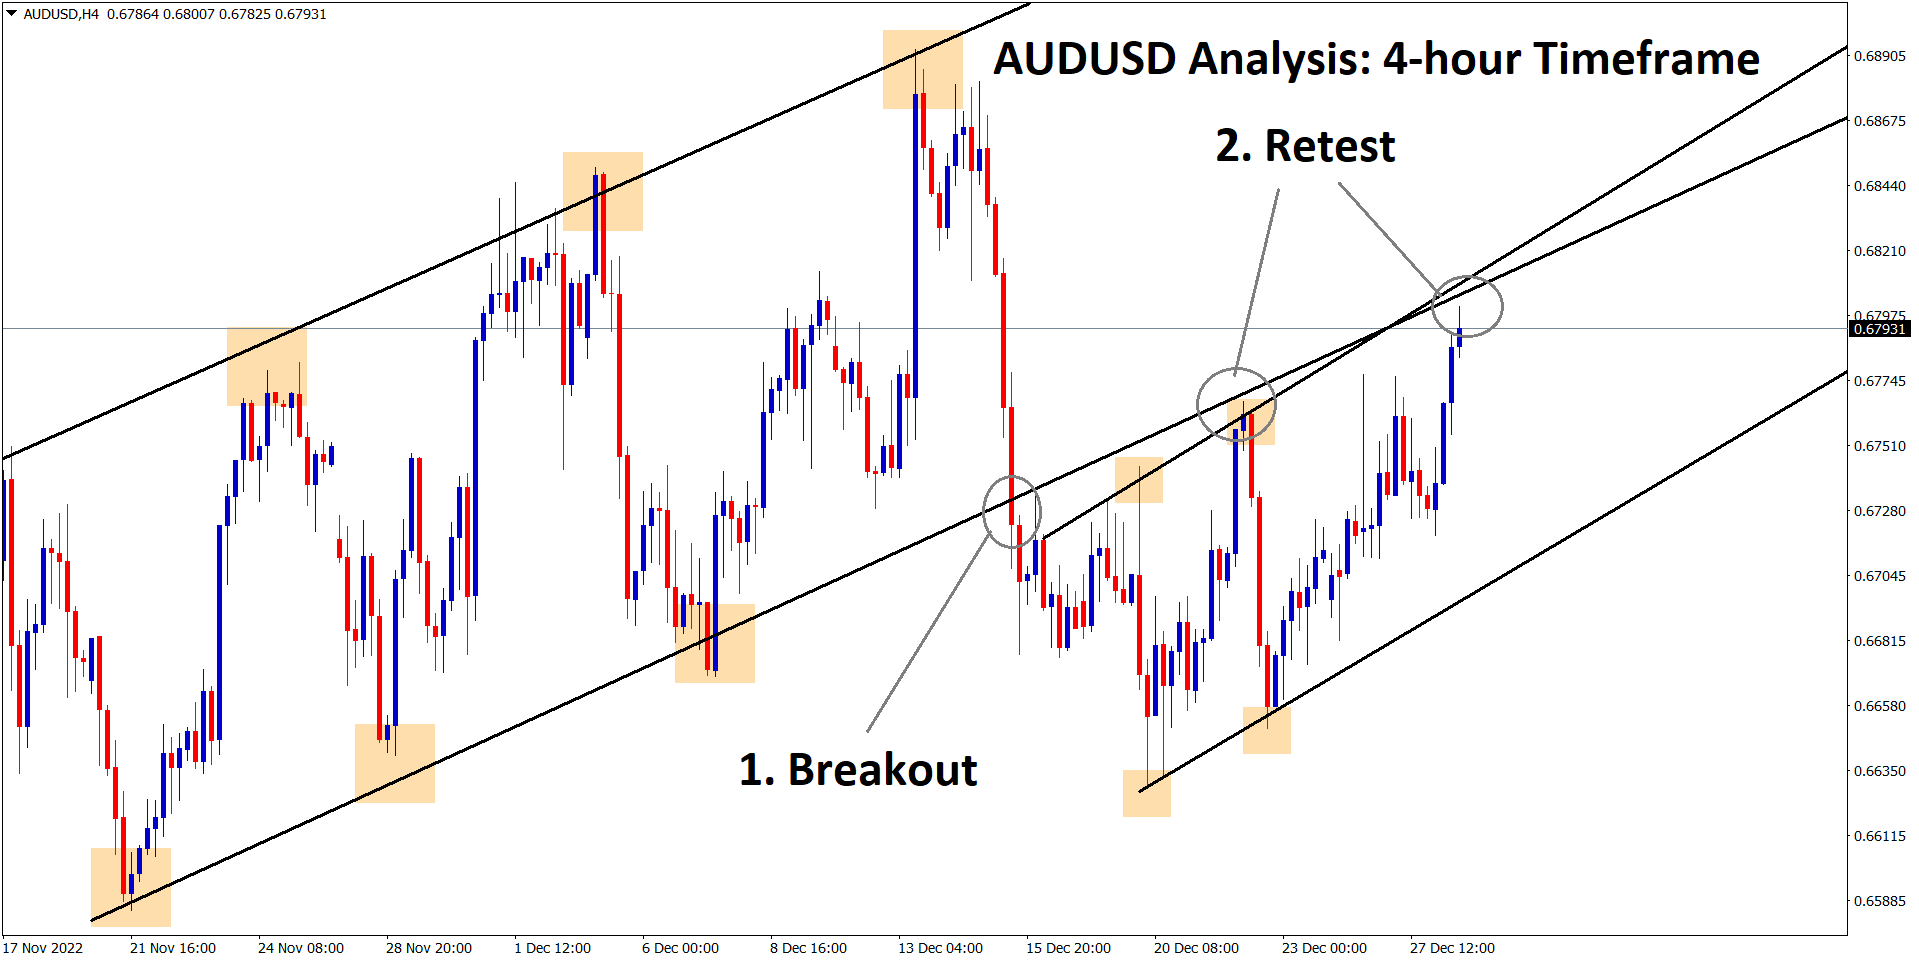
AUDUSD Analysis AUDUSD has broken the major ascending channel and retesting the broken channel for the second time in the…
-
+2100 Points Reached in USDJPY Buy signal after rebounding from the lower low area
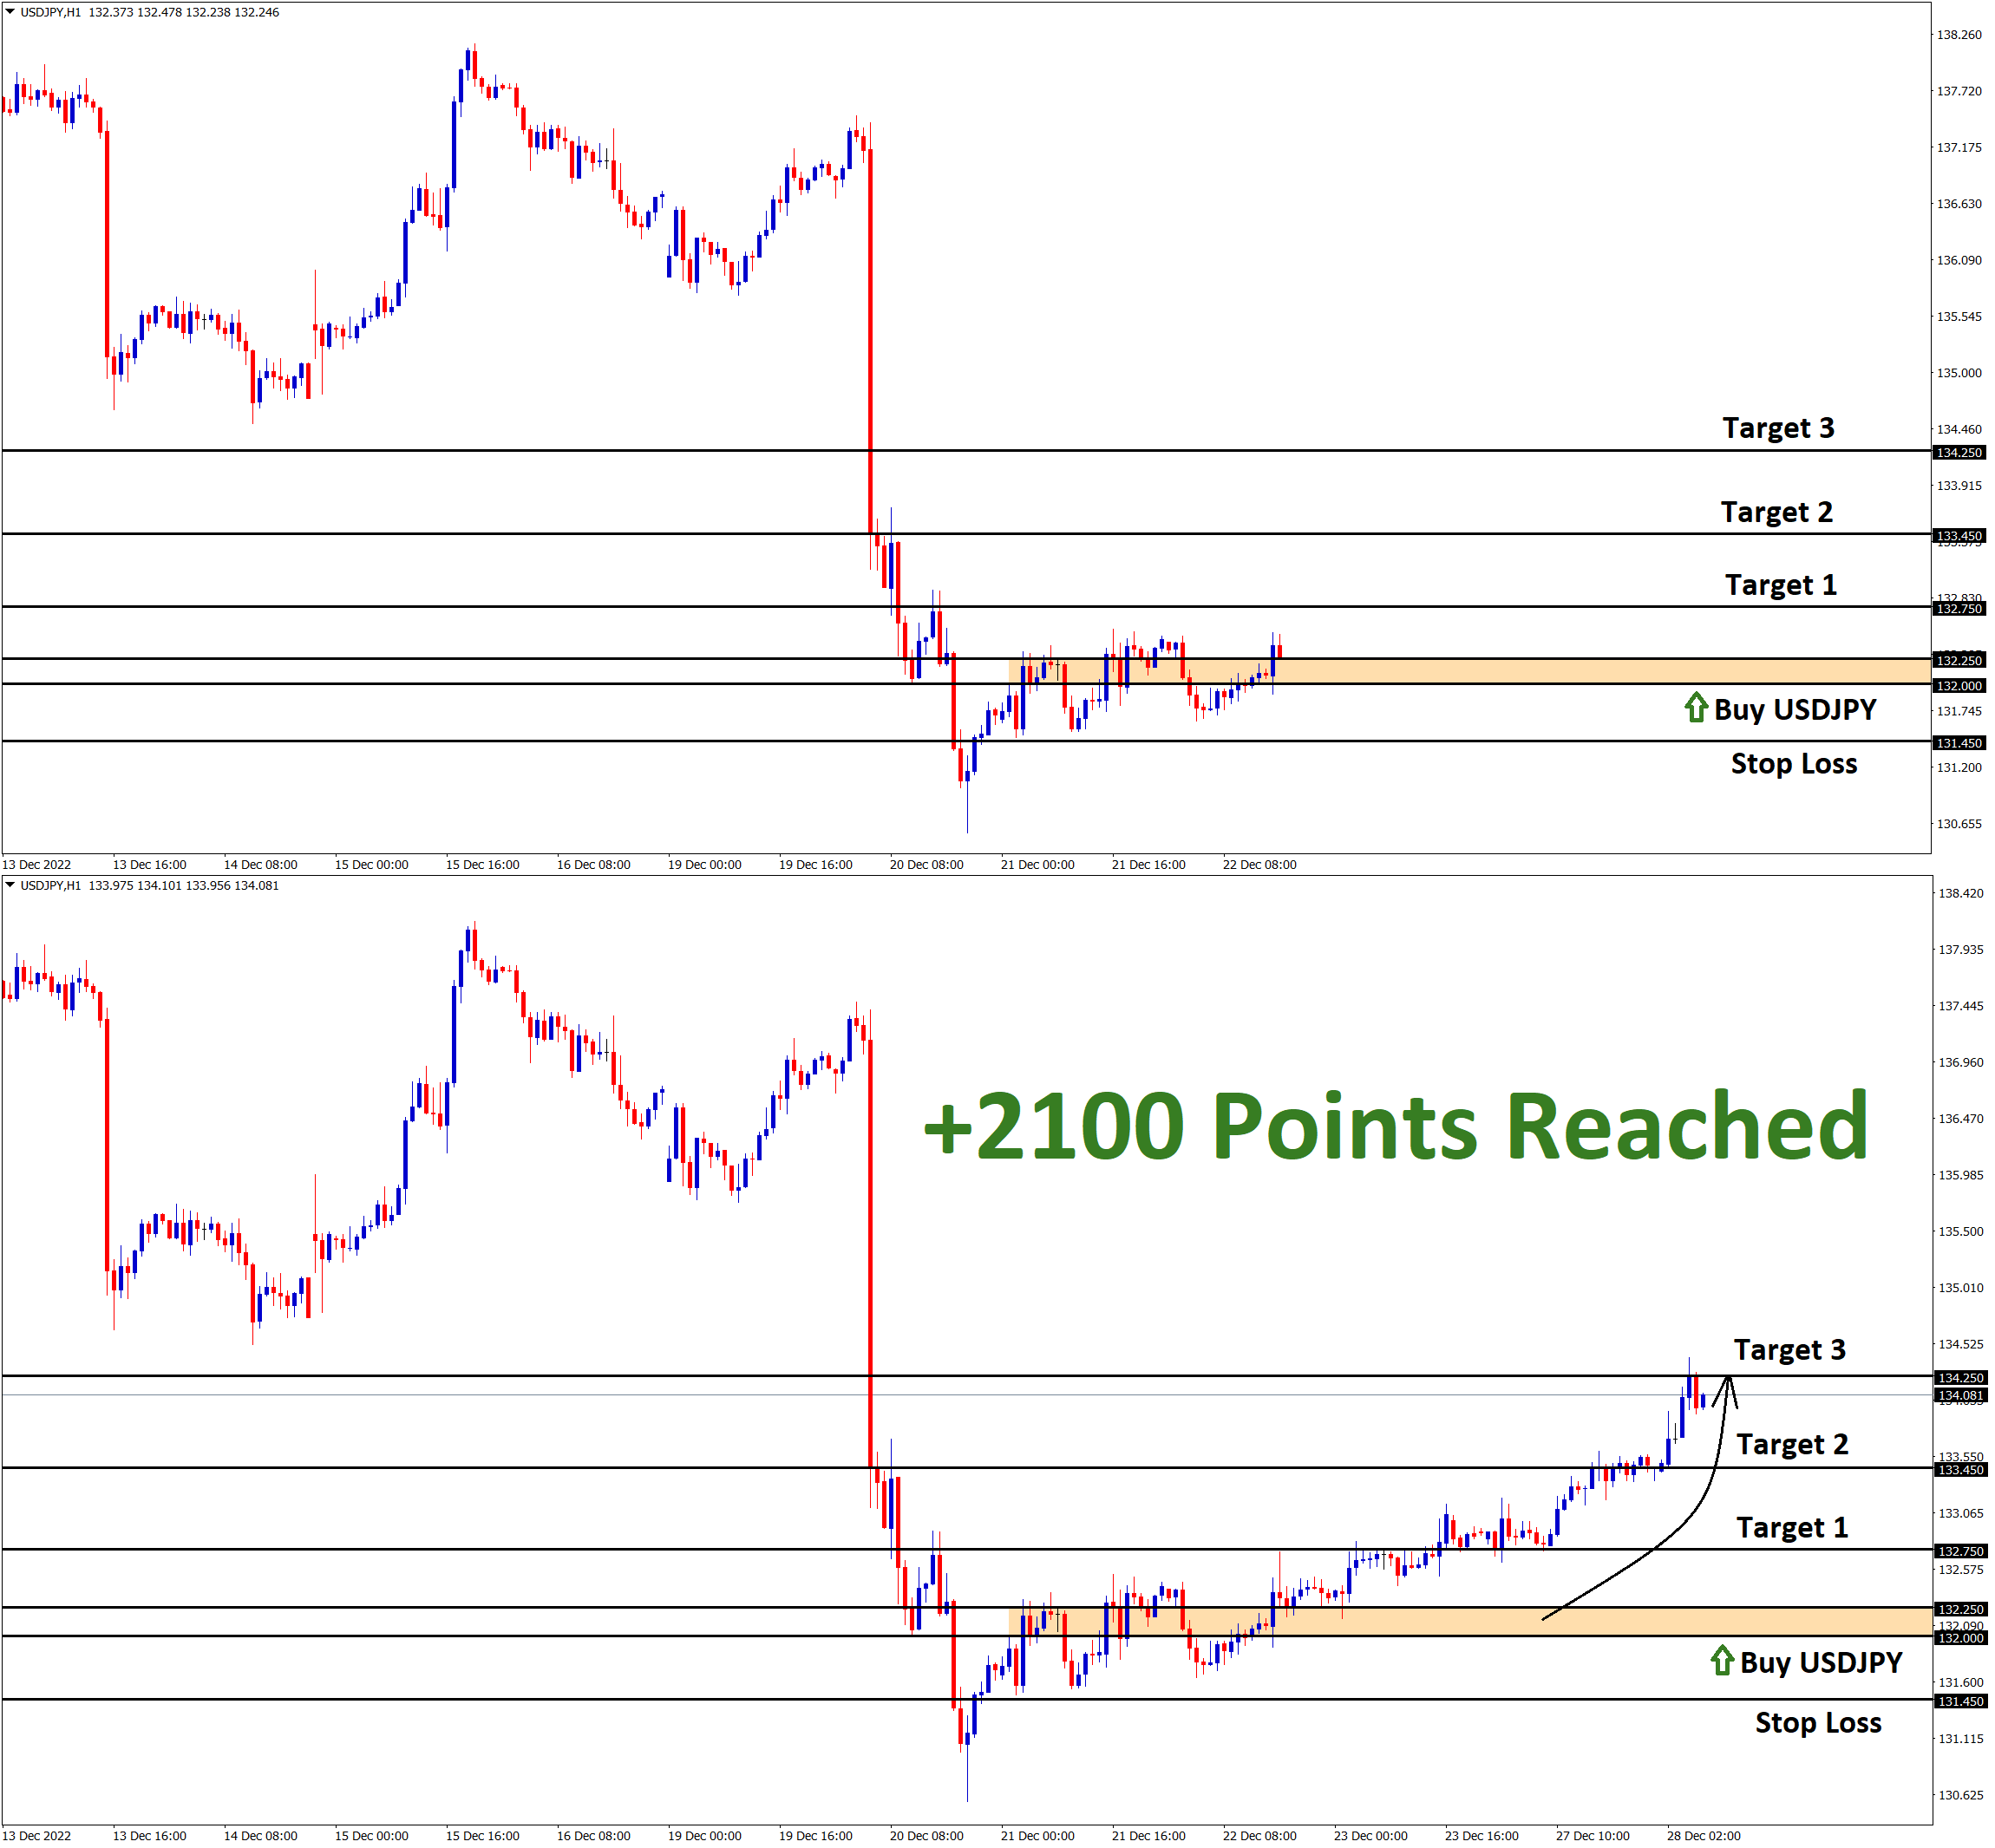
USDJPY Analysis: USDJPY rebounded from the lower low area of the descending channel in the 4-hour timeframe chart. After the…
-
+655 Points Reached in CADJPY Buy signal after breaking the higher high area of the ascending channel
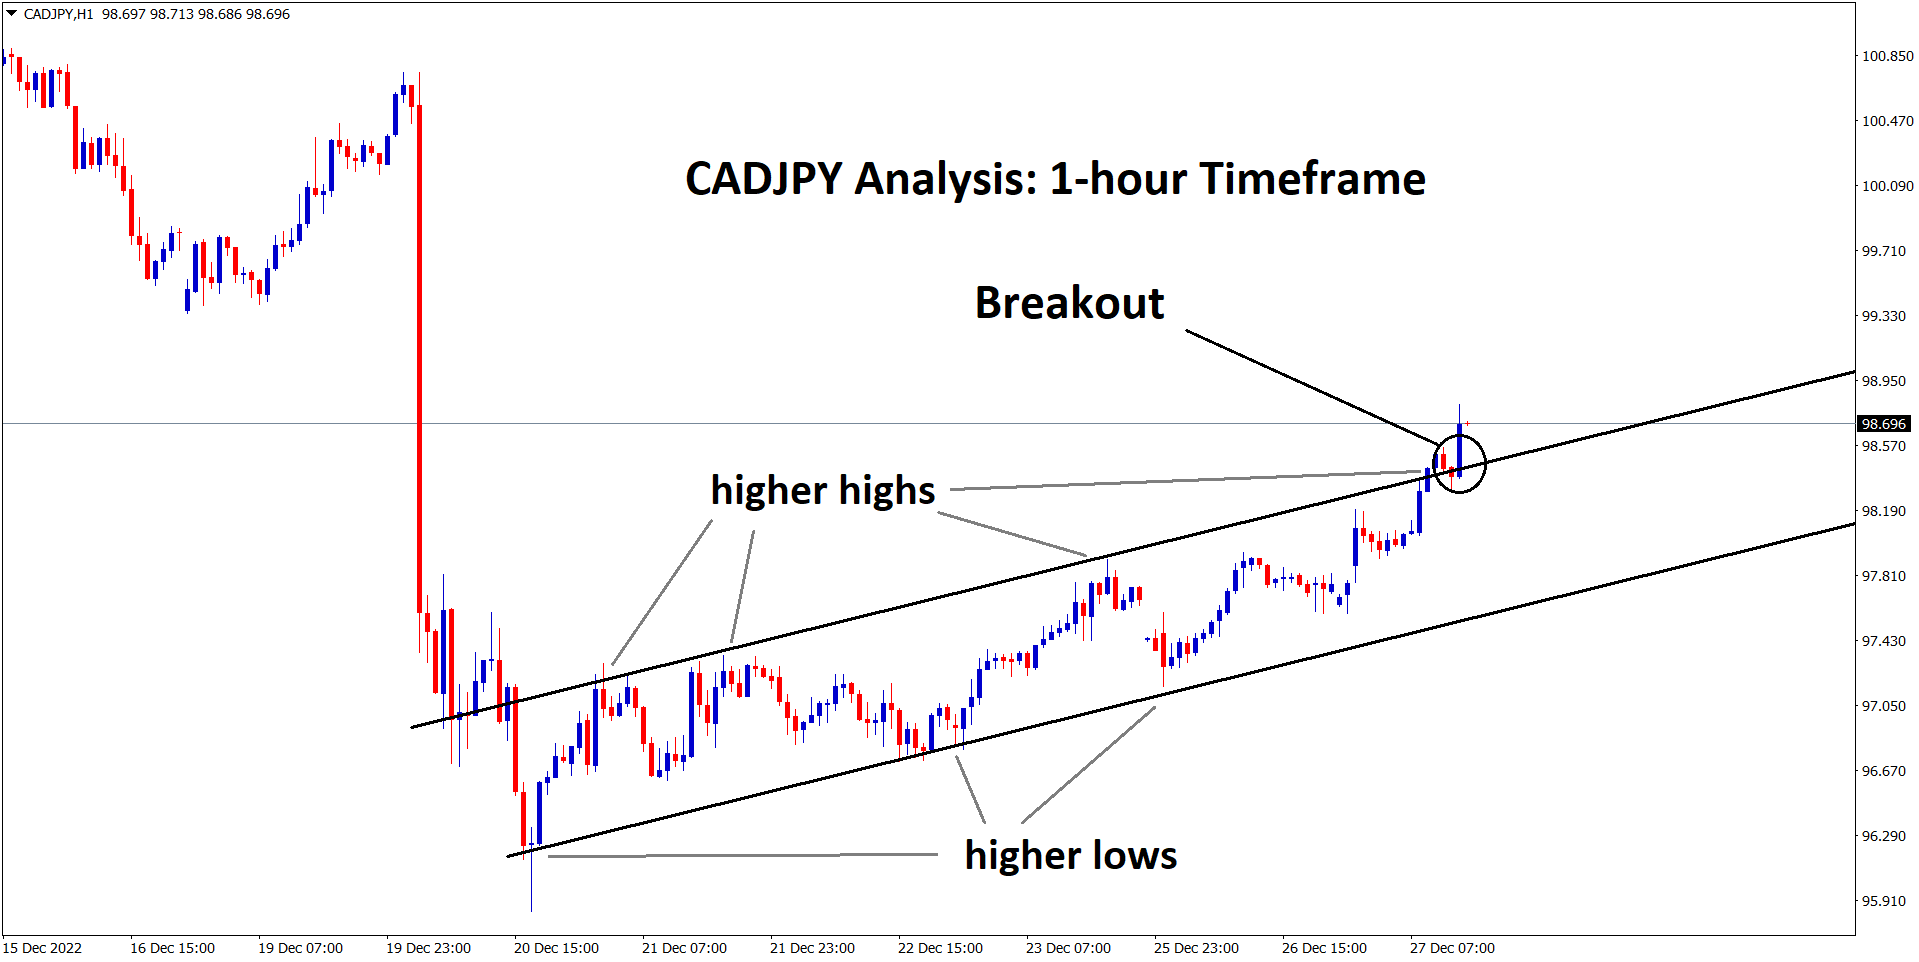
CADJPY Analysis CADJPY has broken the higher high area of the ascending channel in the 1-hour timeframe chart. After the…
-
+1300 Points Reached in USDJPY Buy signal after rebounding from the lower low area
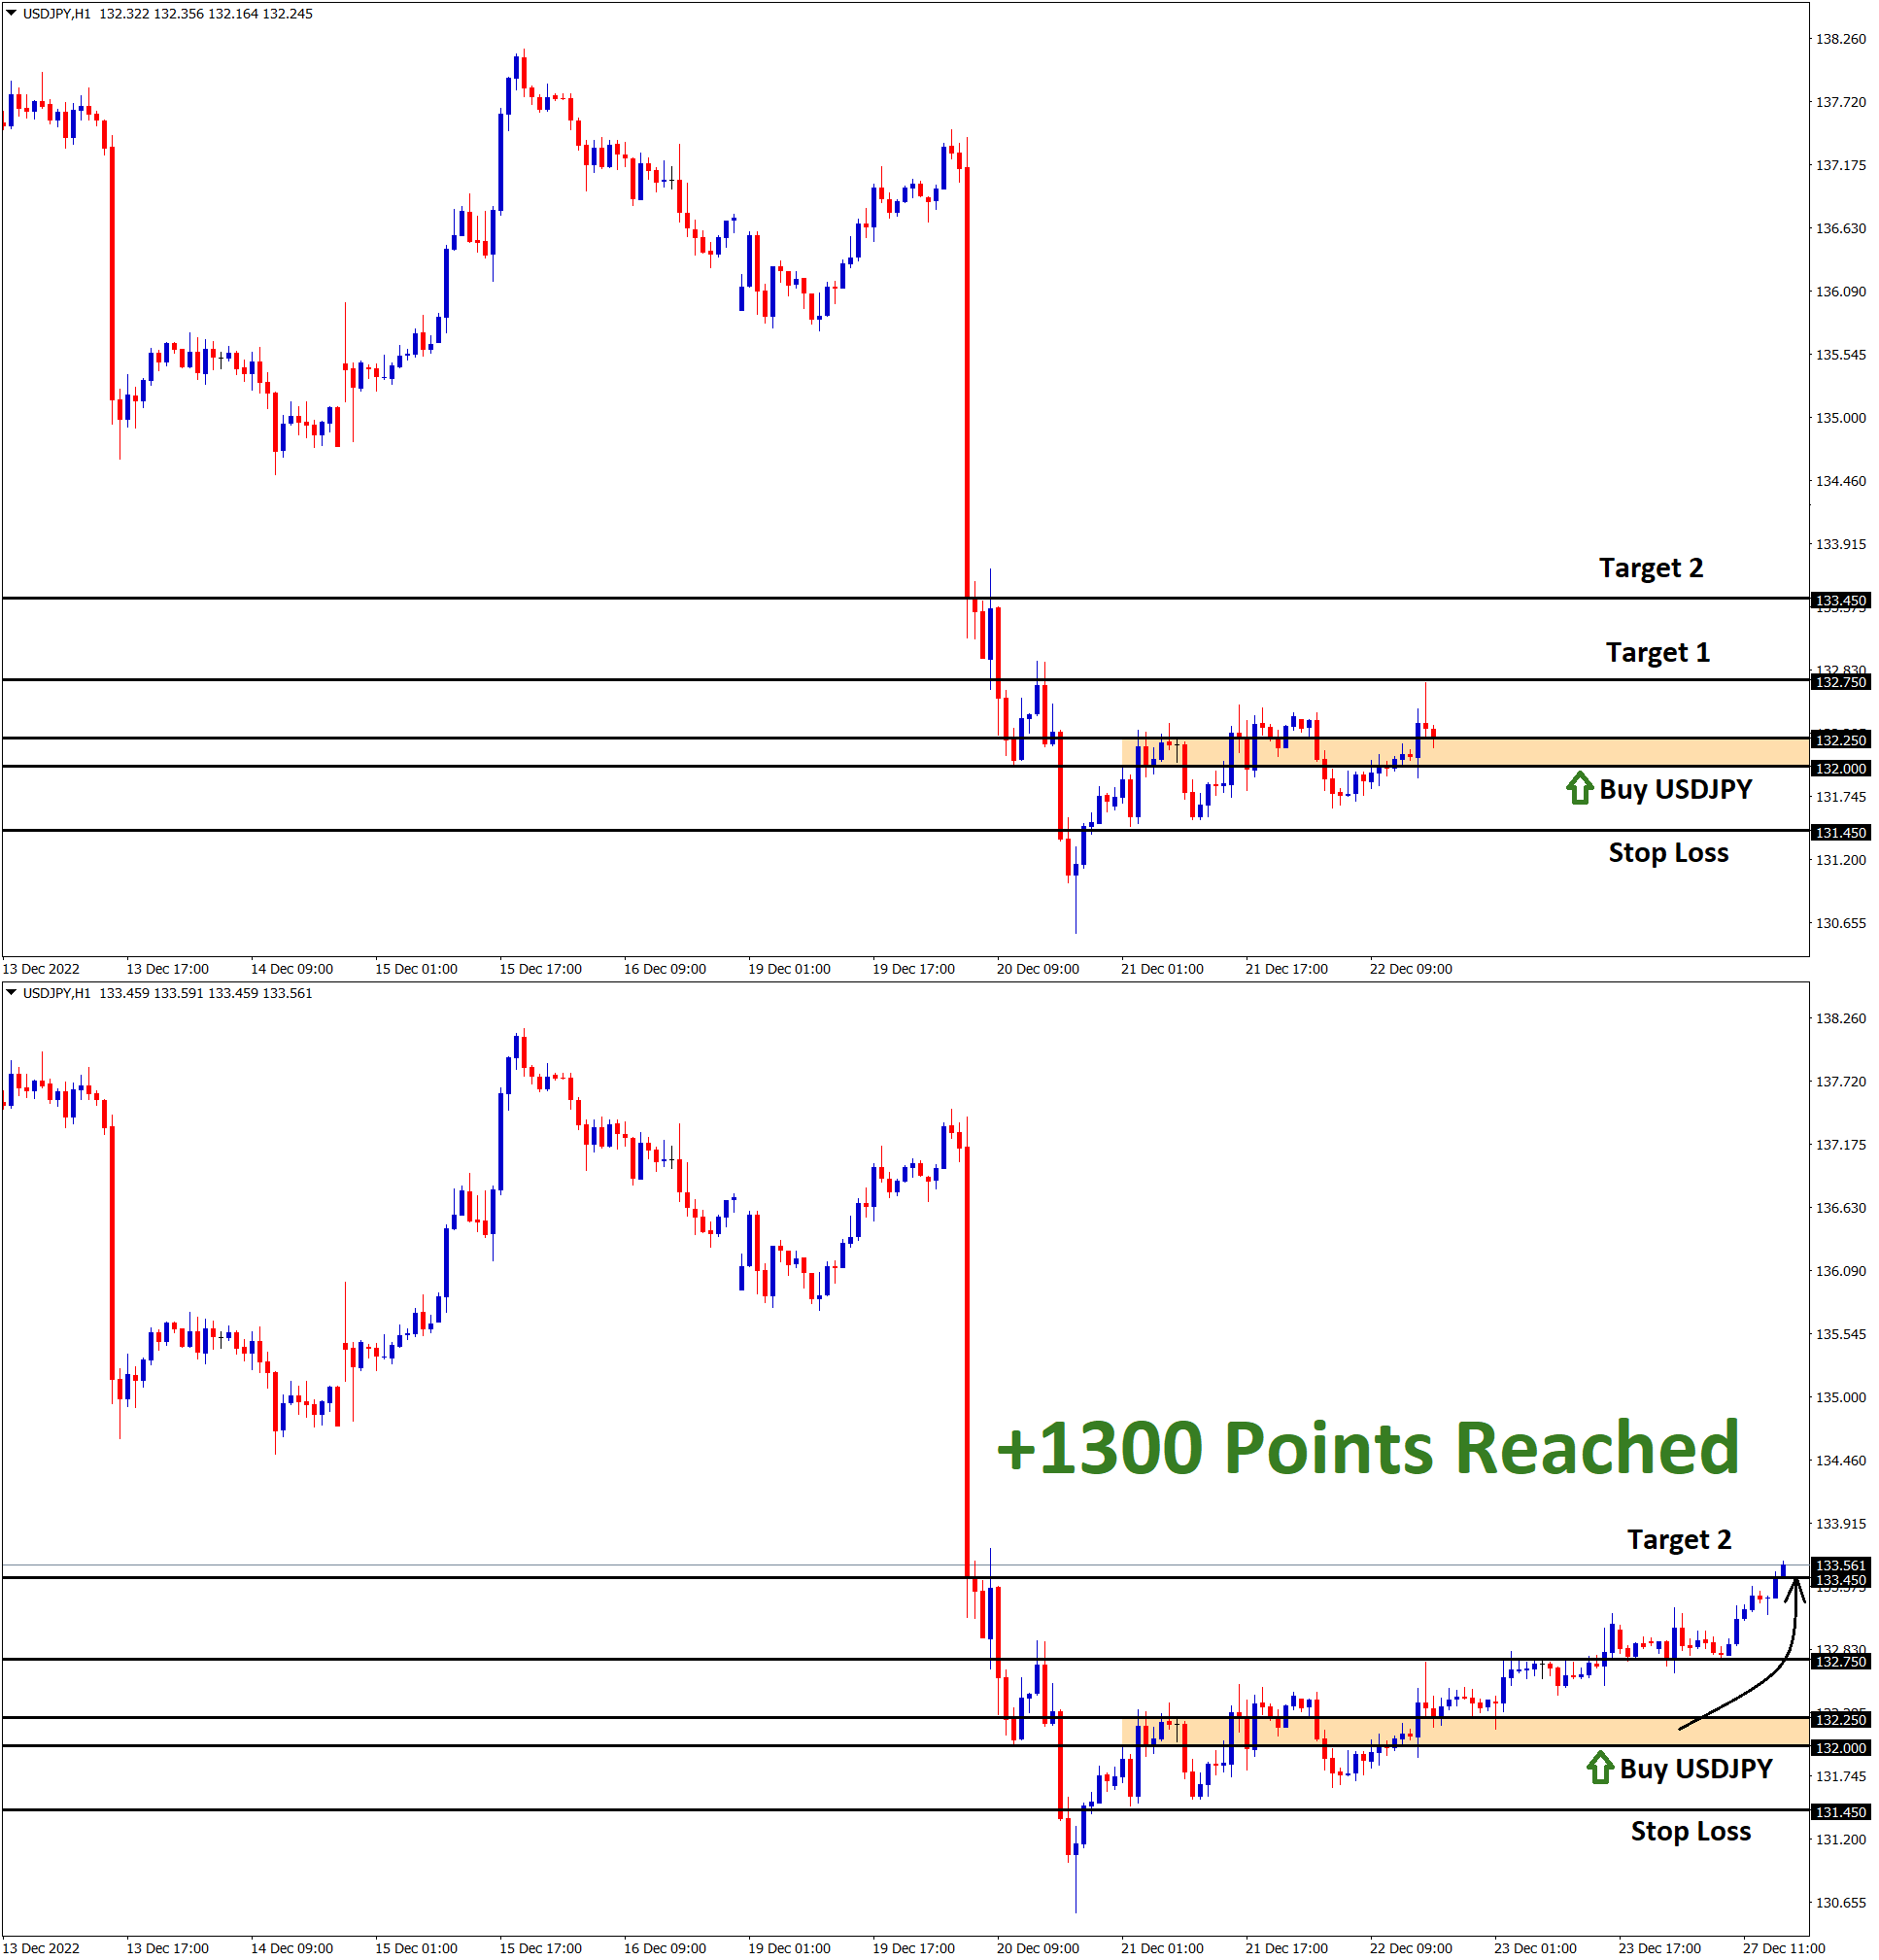
USDJPY Analysis: USDJPY rebounded from the lower low area of the descending channel in the 4-hour timeframe chart. After the…
-
+600 Points Reached in USDJPY Buy signal after rebounding from the lower low area
USDJPY Analysis: USDJPY rebounded from the lower low area of the descending channel in the 4-hour timeframe chart. After the…