GBPUSD Double Top Chart Analysis
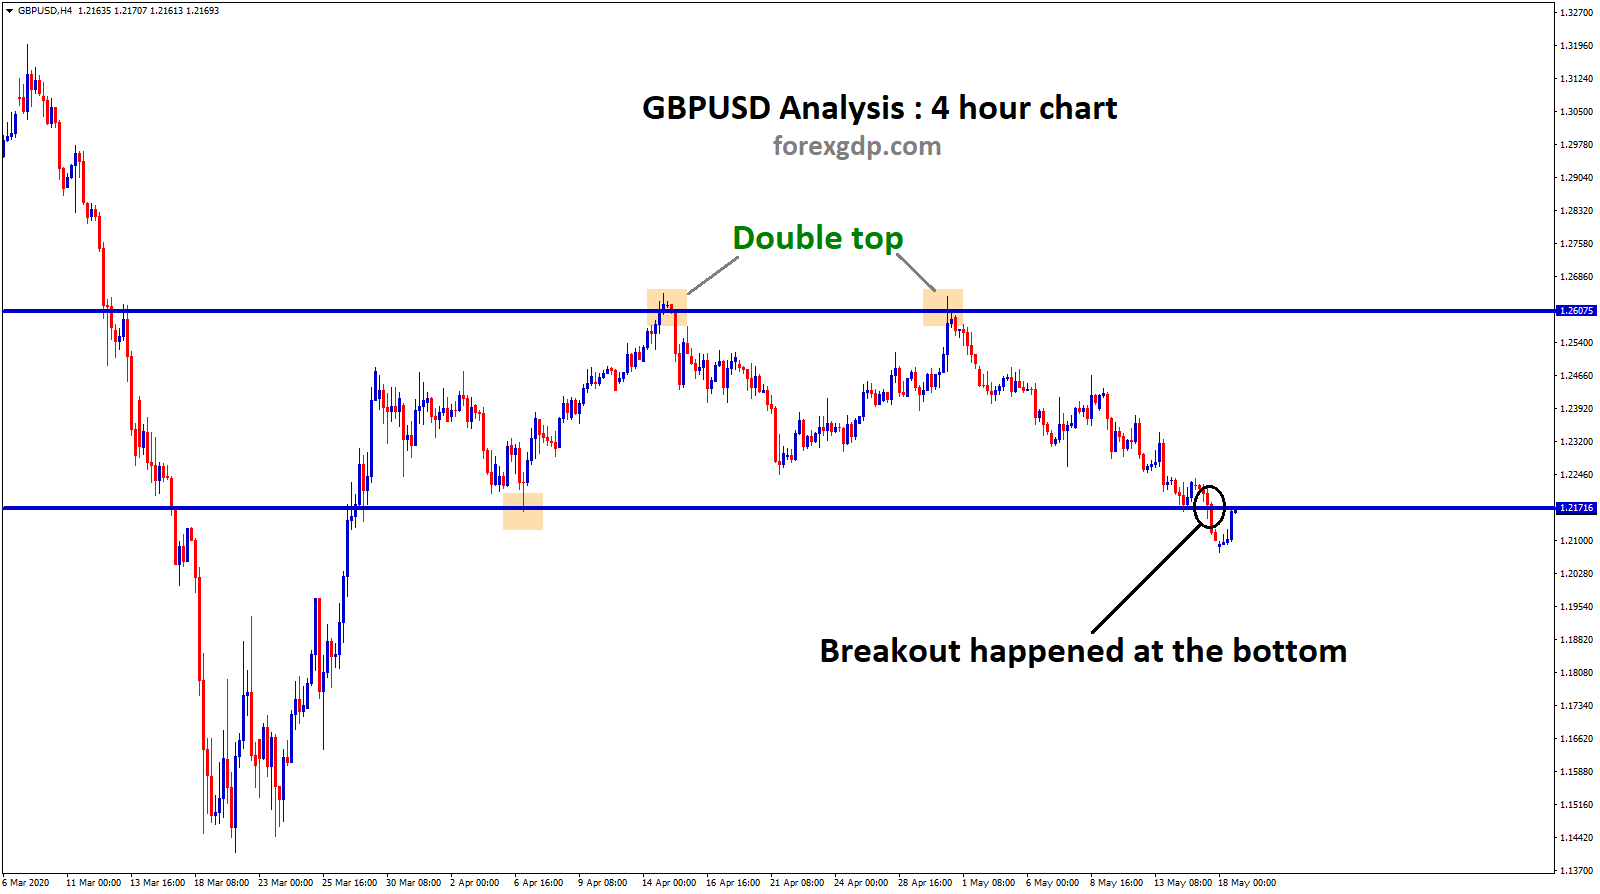
GBPUSD formed a double top in 4 hour chart.
Recently, market broken the bottom zone.
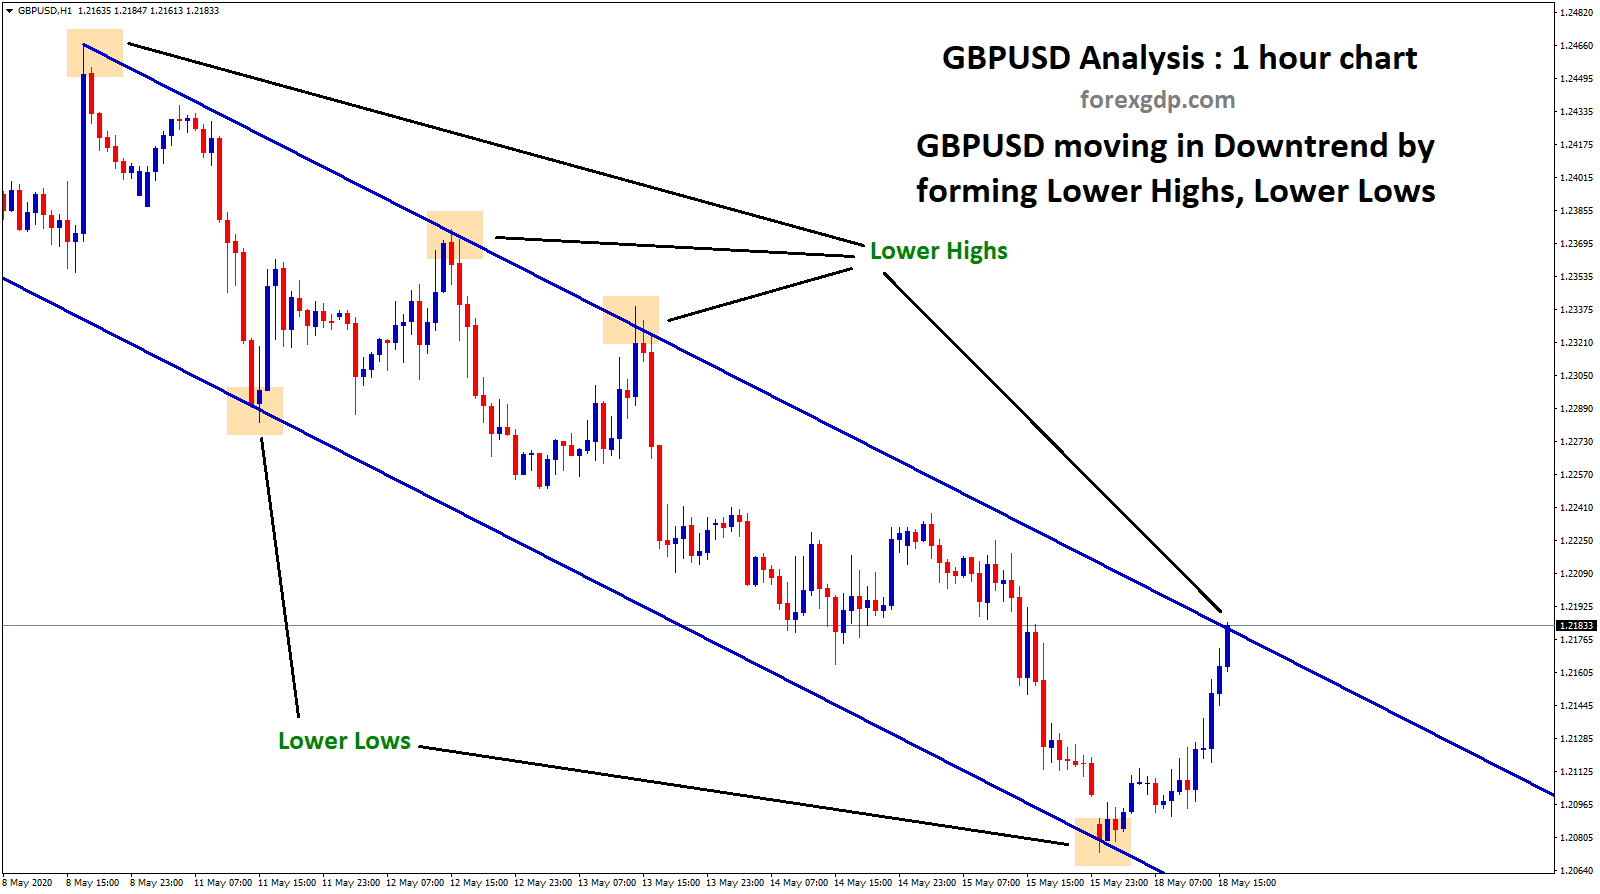
Now, GBPUSD is still moving in downtrend by forming Lower Highs, Lower Lows.
In 1 hour chart, Sellers still pushing the market down.
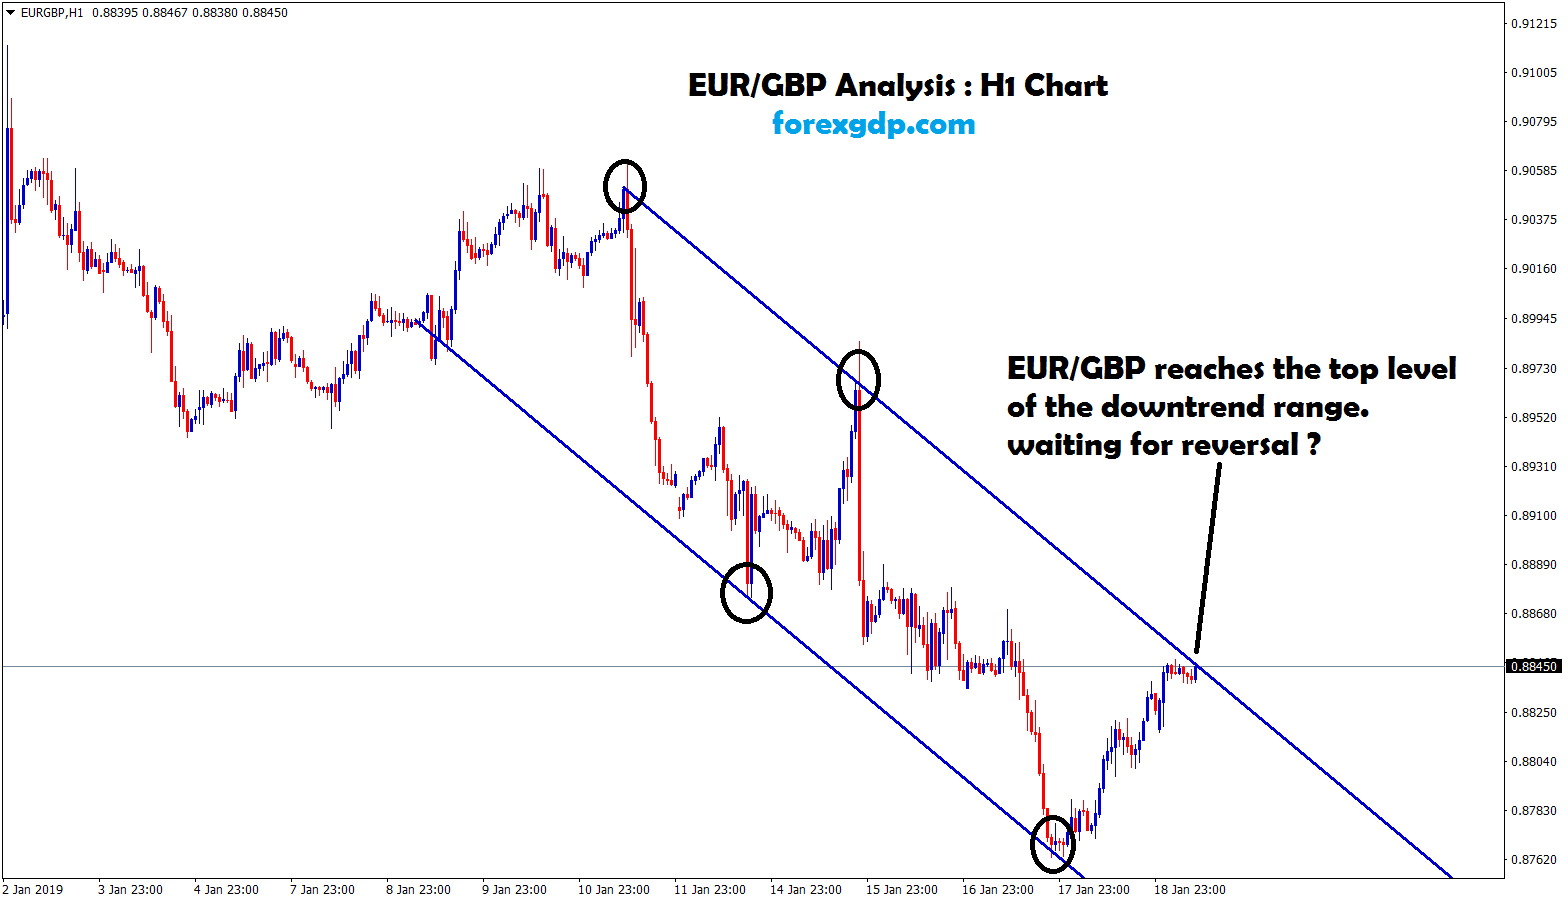
On other side, EURGBP broken the resistance zone after long time, it shows that GBP is getting weaker at this time.
Check live Free forex signals now.
To increase your trading profits, read this below topics:
How to trade profitably using Chart Patterns?
Low risk, High reward trading strategies
How to get rich trading forex market?
Most predictable Currency Markets
If you want to learn more successful trading techniques with free mentorship support, you can purchase the forex trading video course.
Thank you.

