AUDUSD Analysis
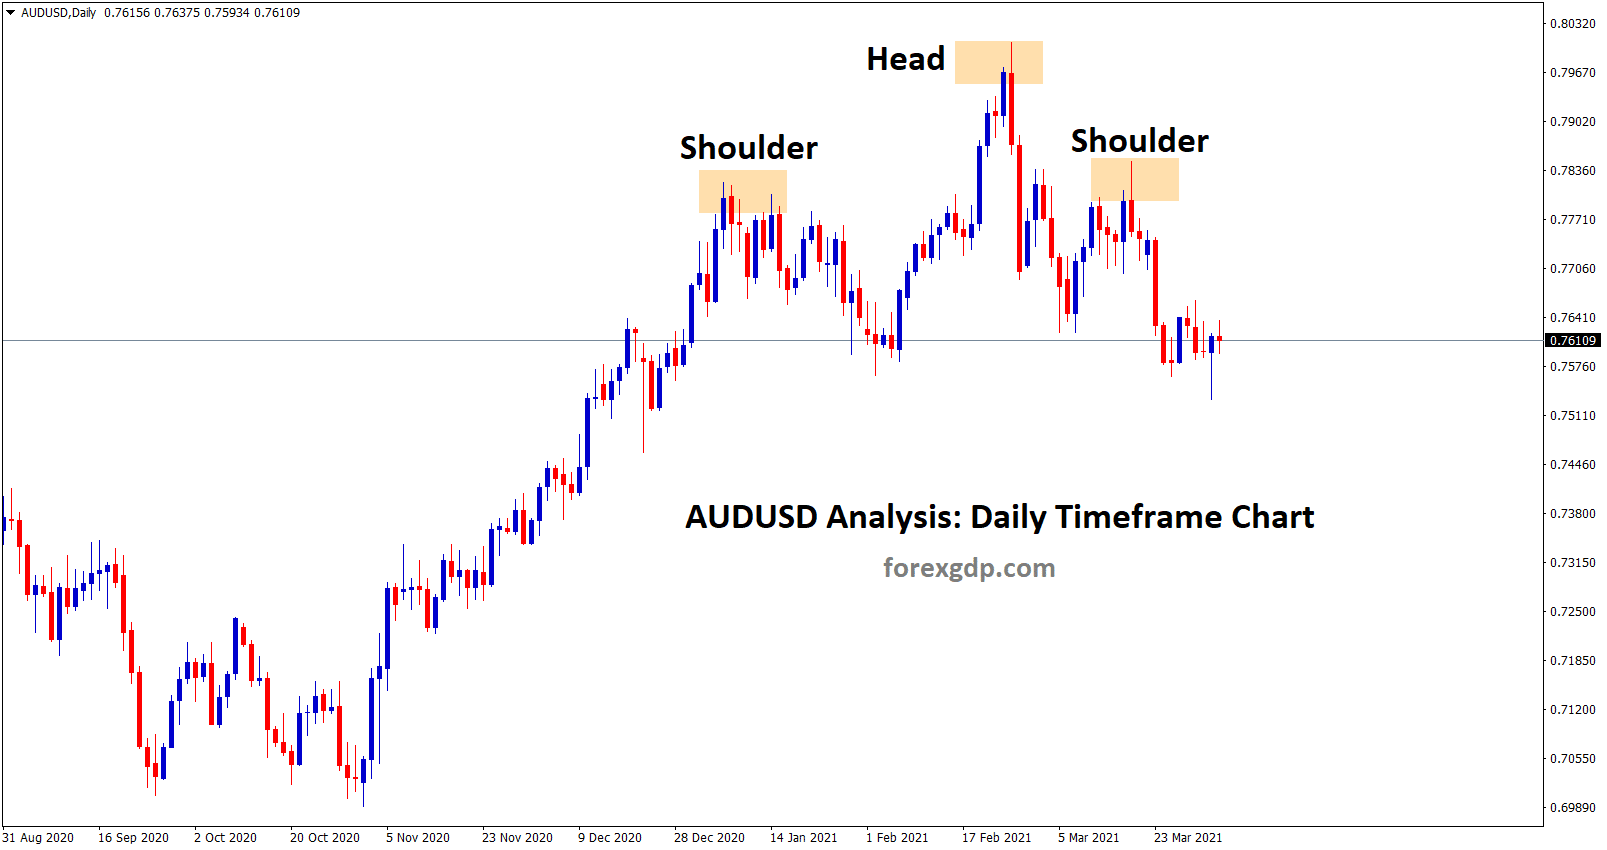
AUDUSD starts to fall by forming head and shoulder pattern in the daily timeframe chart.
In another view, AUDUSD has broken the symmetrical triangle and it’s trying to retest the broken level for 2nd time as shown below:
AUDUSD has formed a symmetrical triangle pattern. Breakout and Re-test Scenario has taken place. Now the market may retest the broken level again before falling down.
Australian Dollar (AUD)
Australian Dollar pushed higher as US Dollar little going for correction after Strong manufacturing data of ISM yesterday.
And US ISM Manufacturing beat expectations of 61.3%. It came at 64.7% actual printed, and this reading beat china’s Caixin manufacturing PMI for the first time. Due to this Australian Dollar gets down as a correction phase.
Stores closed in Brisbane during the lockdown.
Brisbane announced full lockdown for Covid-19 spread, and this becomes the backlog for Domestic data of the Australian economy.
Get Each trading signal with Chart Analysis and Reason for buying or selling the trade which helps you to Trade with confidence on your trading account.
Want to increase your profits in trading? Get the best trading signals at an accurate time. Try premium or supreme signals now: forexgdp.com/forex-signals/


