Forex Signal Results
Check Full Forex Market Signals with Technical Analysis Chart
Please note : It is better to do nothing instead of taking wrong trades, we focus on providing you the forex signals only at good trade setup. Each trade signal given to you with fundamental and technical analysis chart which helps you to understand why our analyst team has given the Buy signals and Sell Signals. Now, you can trade with confident using our service. Sounds good? Let's look out all our signal charts below. If you want to test our forex signals, Try free plan (or) if you need more important forex signals, Join here for Premium or Supreme planCheck some of our Subscriber's Myfxbook Live Real Trading results - Click here to see Live Real USD Trading Accounts Try our free service now, let the results speak the rest.
-
Ascending Triangle Pattern going to break soon on USDCHF
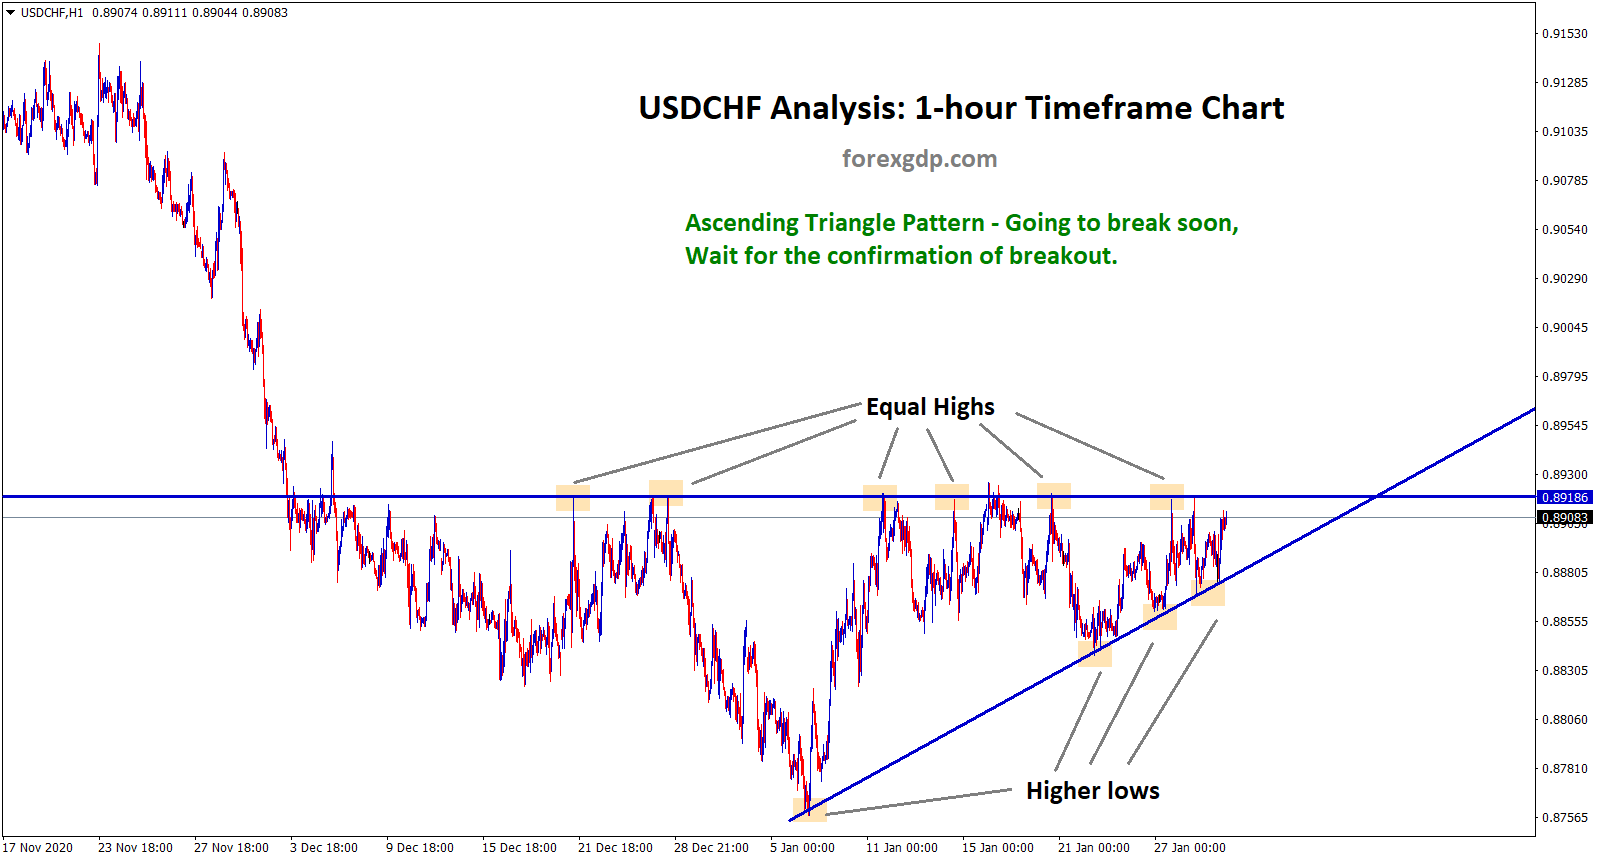
USDCHF Ascending Triangle Breakout Ascending Triangle pattern has formed in the USDCHF by creating Equal highs and higher lows. USDCHF…
-
USDJPY is trying to break the top zone of the falling wedge pattern
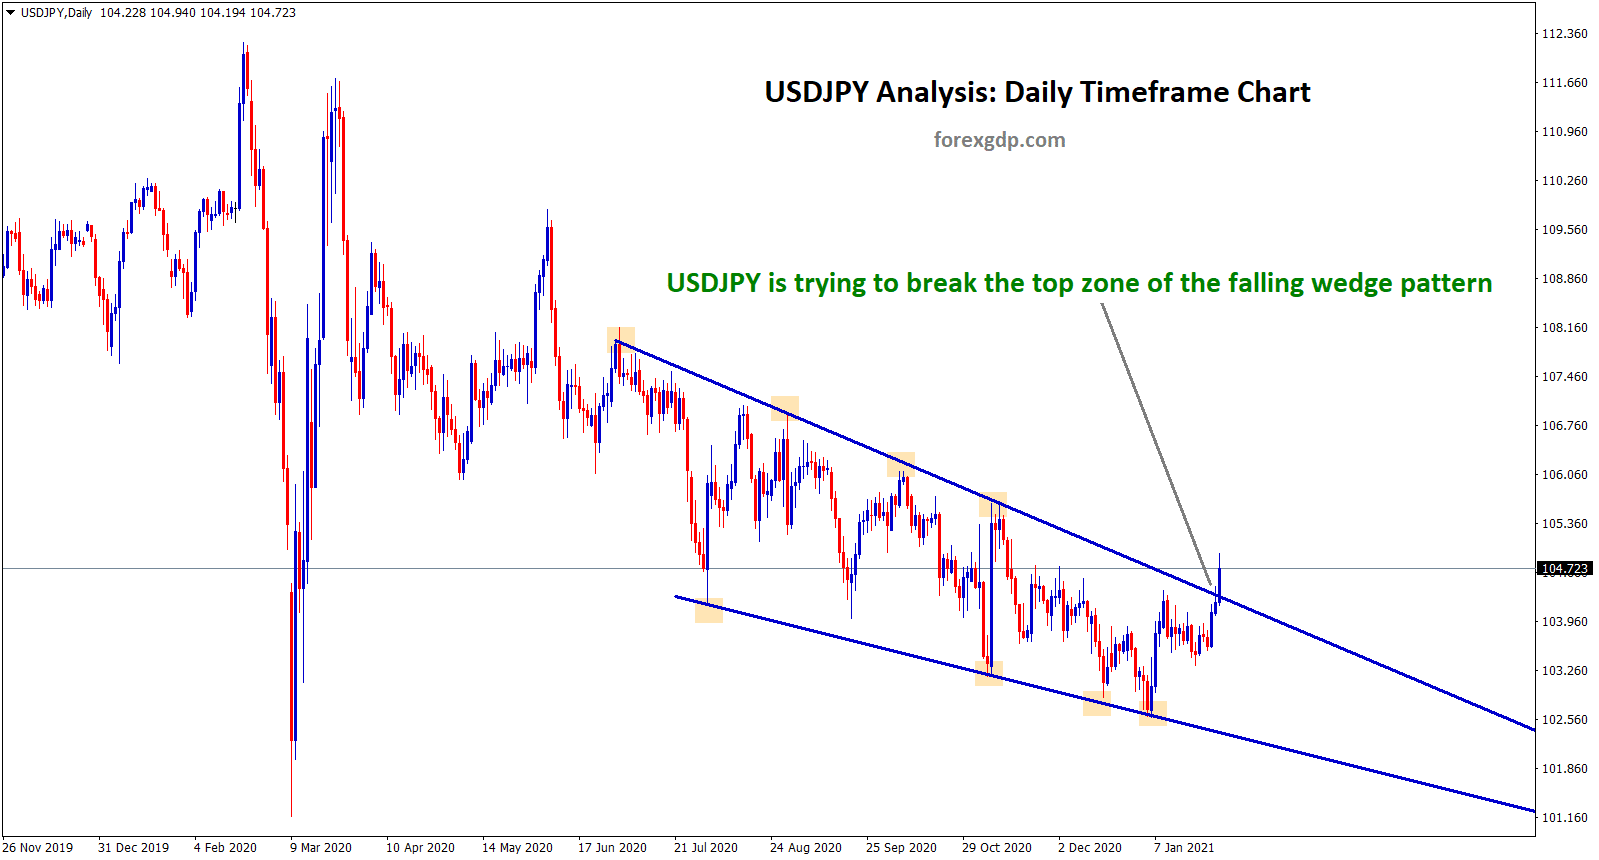
USDJPY Analysis USDJPY has formed a falling wedge pattern and now it's trying to break the top zone of the…
-
CADCHF is moving in uptrend range in the daily timeframe chart
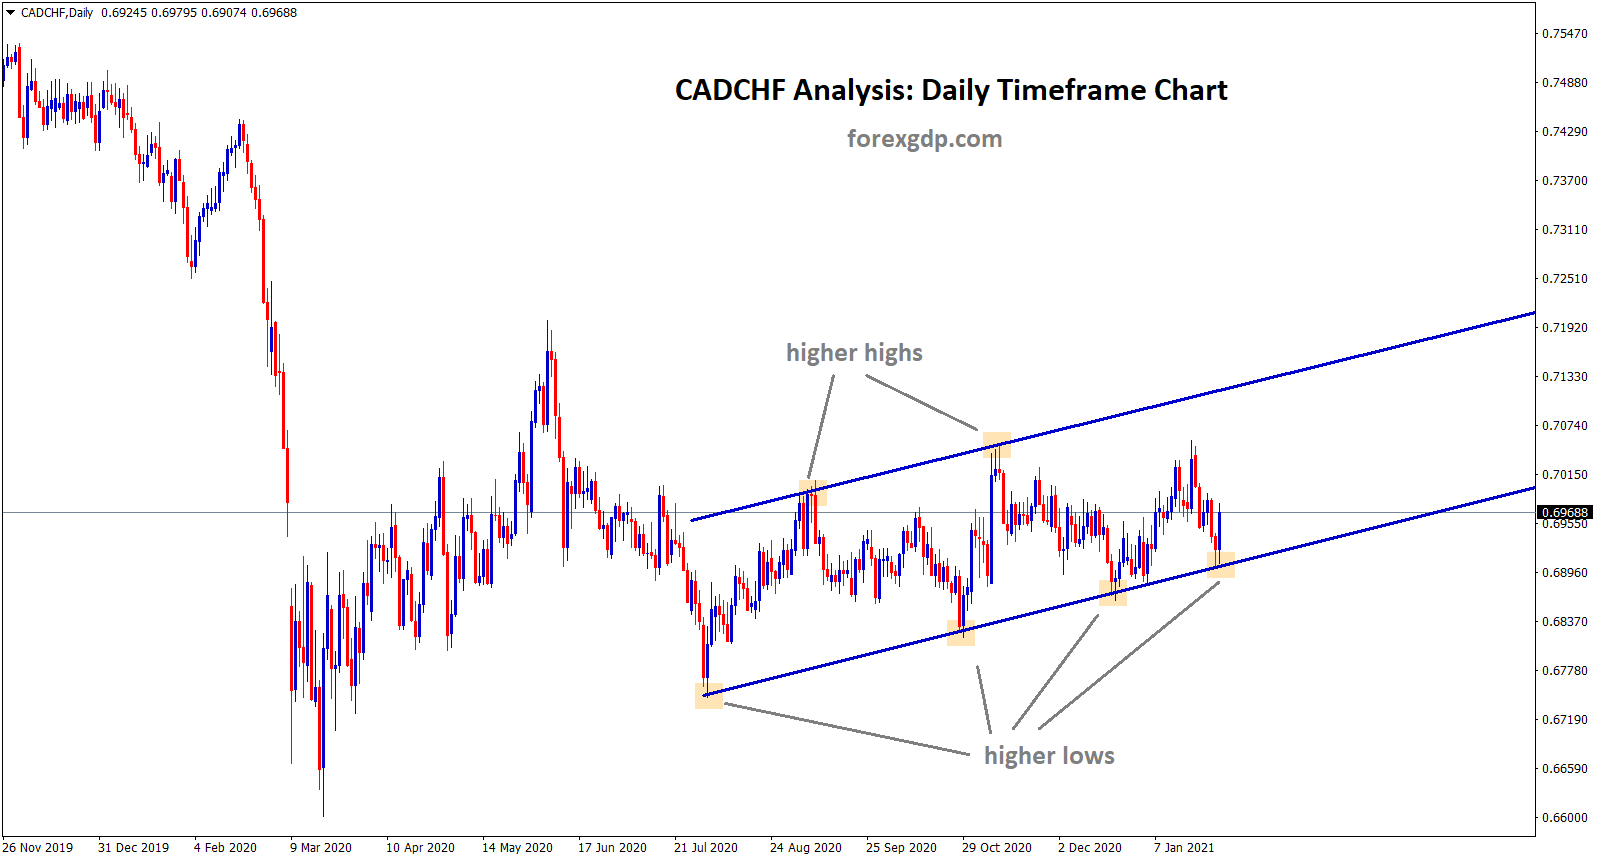
CADCHF Analysis CADCHF is moving in an uptrend range by forming higher highs and higher lows. Now it's moving in…
-
EURGBP trying to break the Support zone of the Descending Triangle
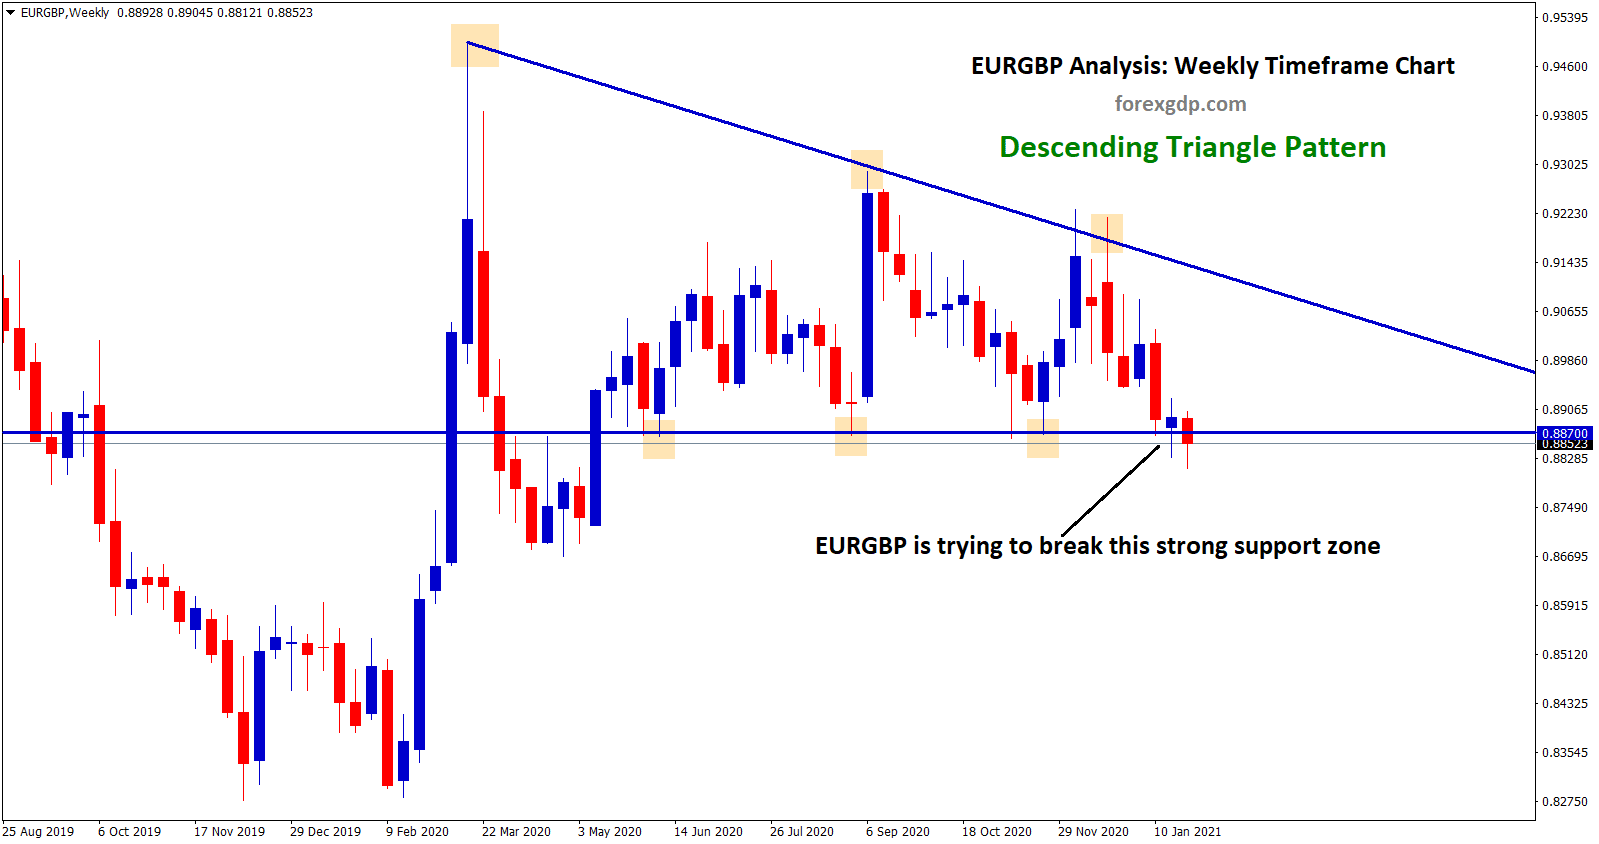
EURGBP Analysis EURGBP has formed a descending triangle pattern in the weekly time frame chart. Now, EURGBP is trying to…
-
AUDJPY has broken the top level of the channel and reached -450 Points
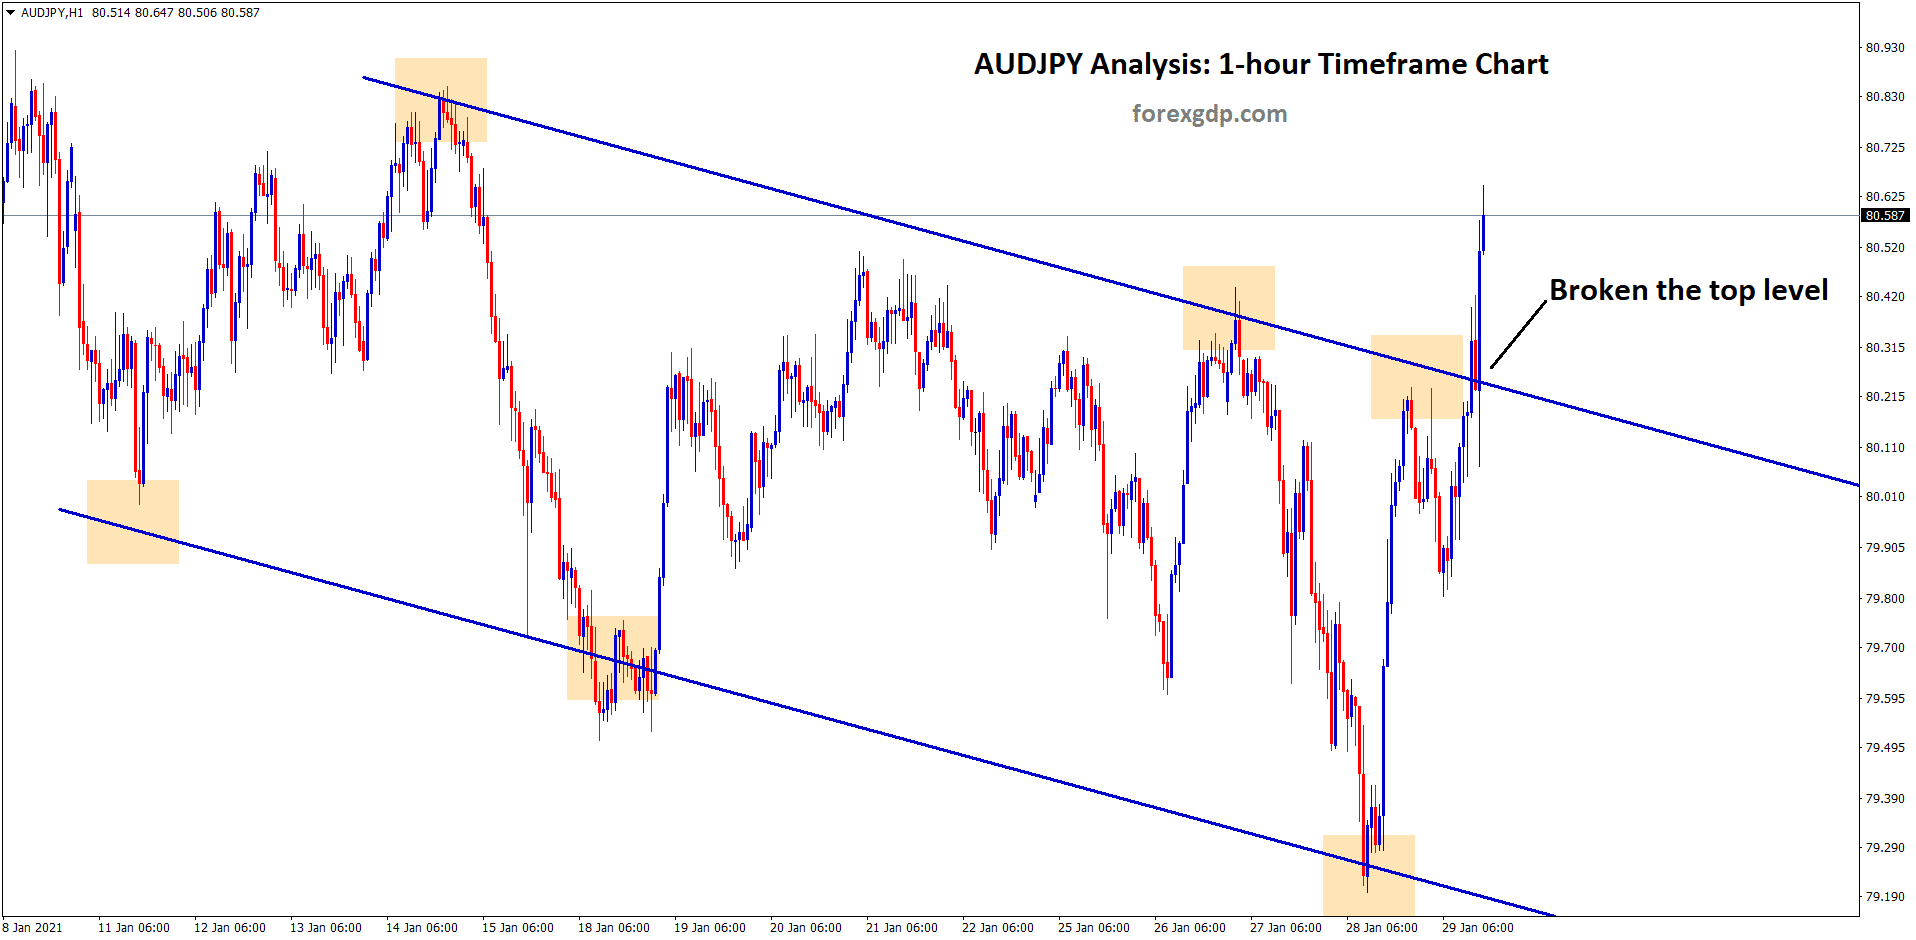
AUDJPY Analysis AUDJPY is moving in a descending channel by forming lower highs and lower lows in the 1-hour timeframe…
-
+1540 Points Achieved in EURAUD after a bounce back from the higher low zone
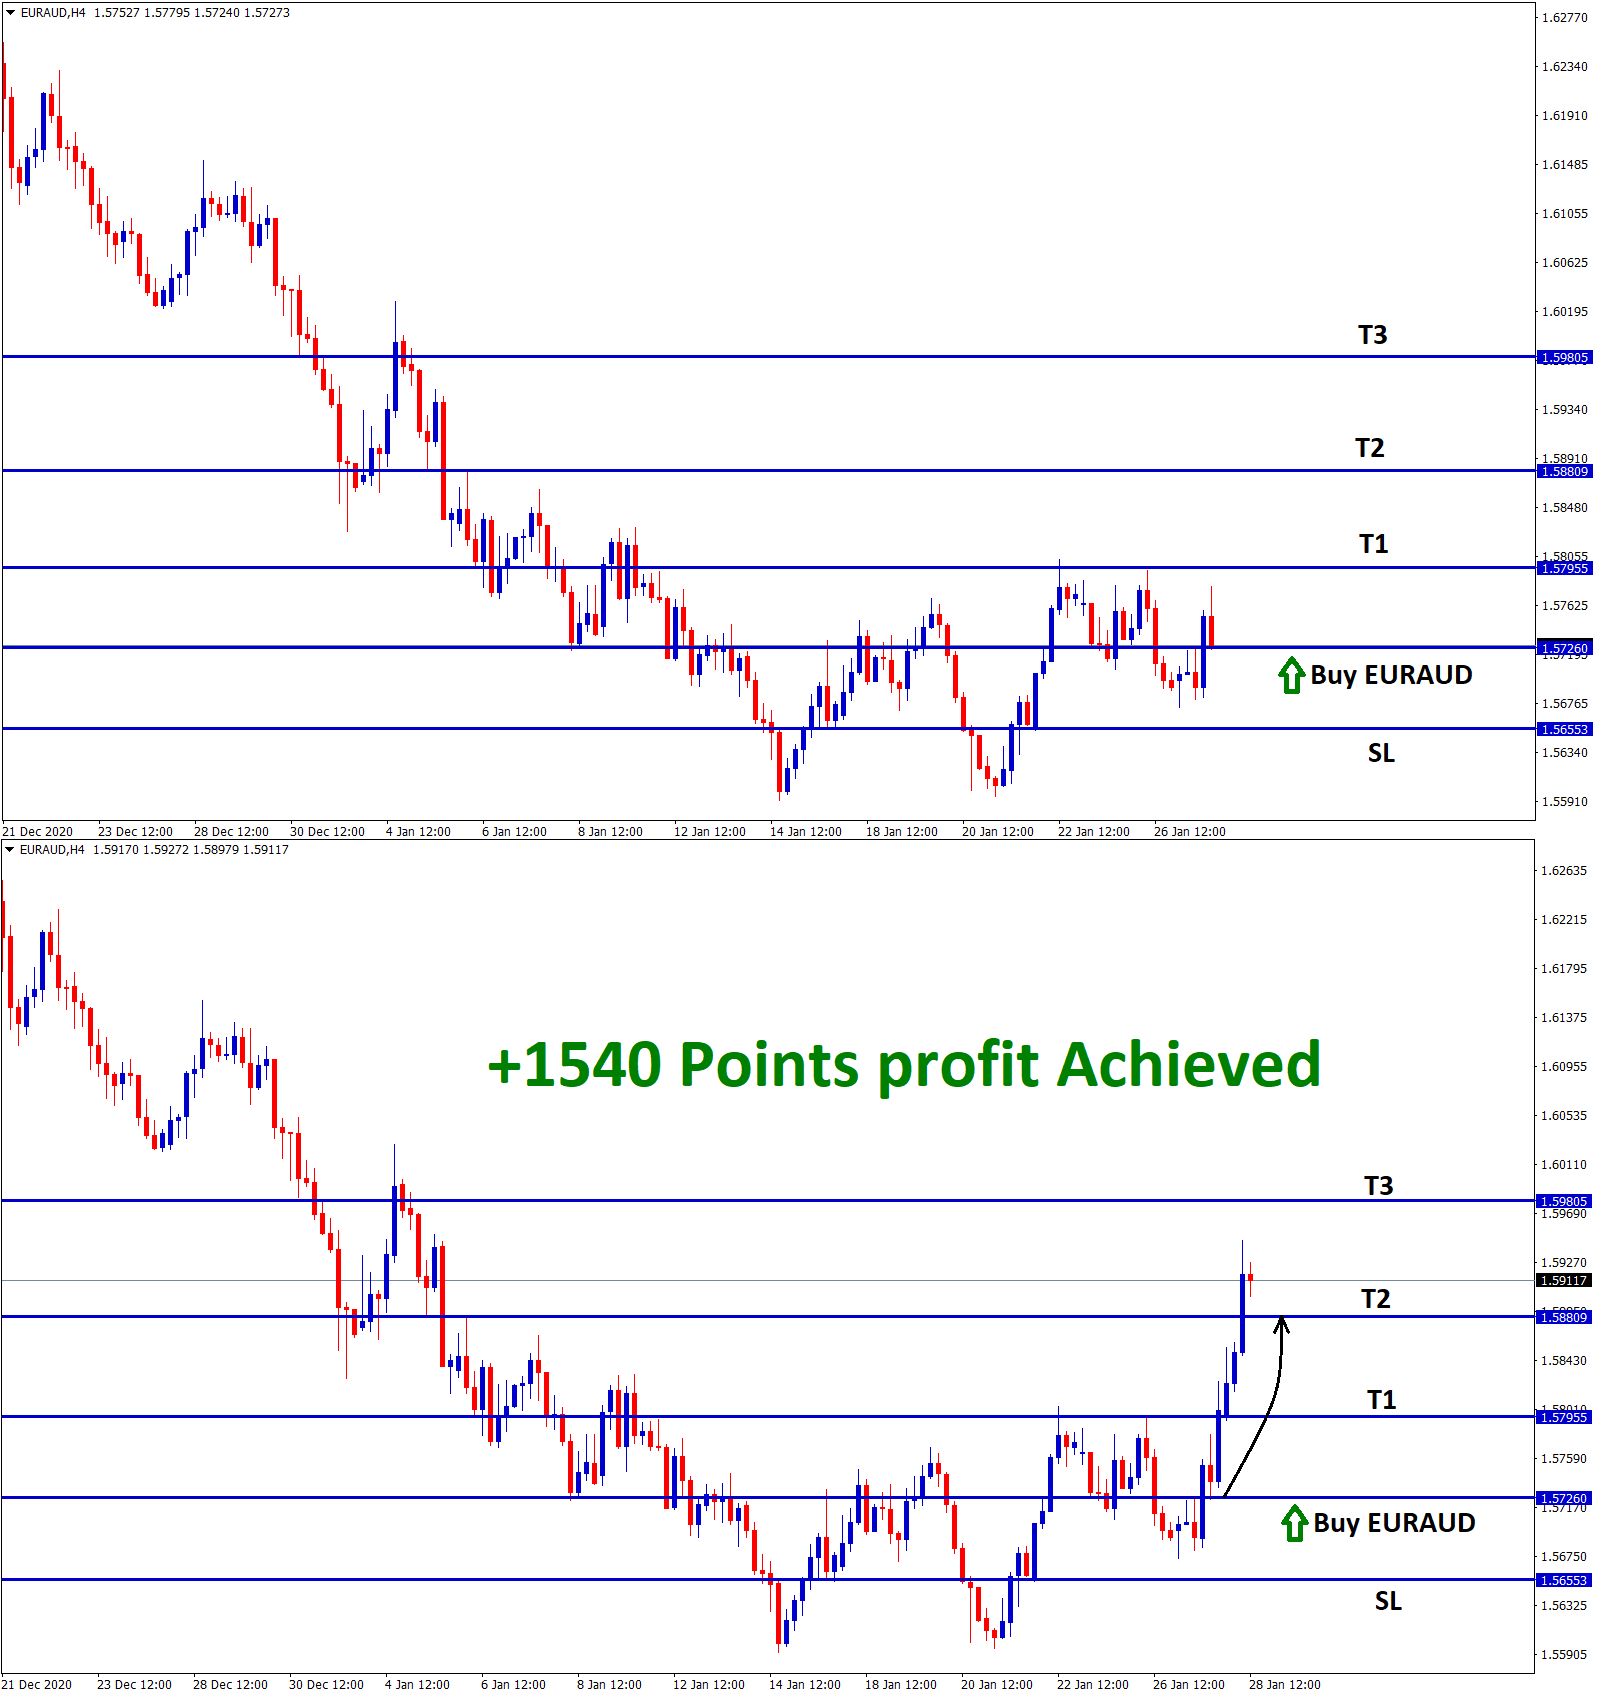
EURAUD Analysis EURAUD is bouncing up from the higher low zone of the Uptrend line in the 30-minutes time frame…
-
+2700 Points profit achieved in GBPAUD Buy Signal after the breakout and retest of the downtrend line
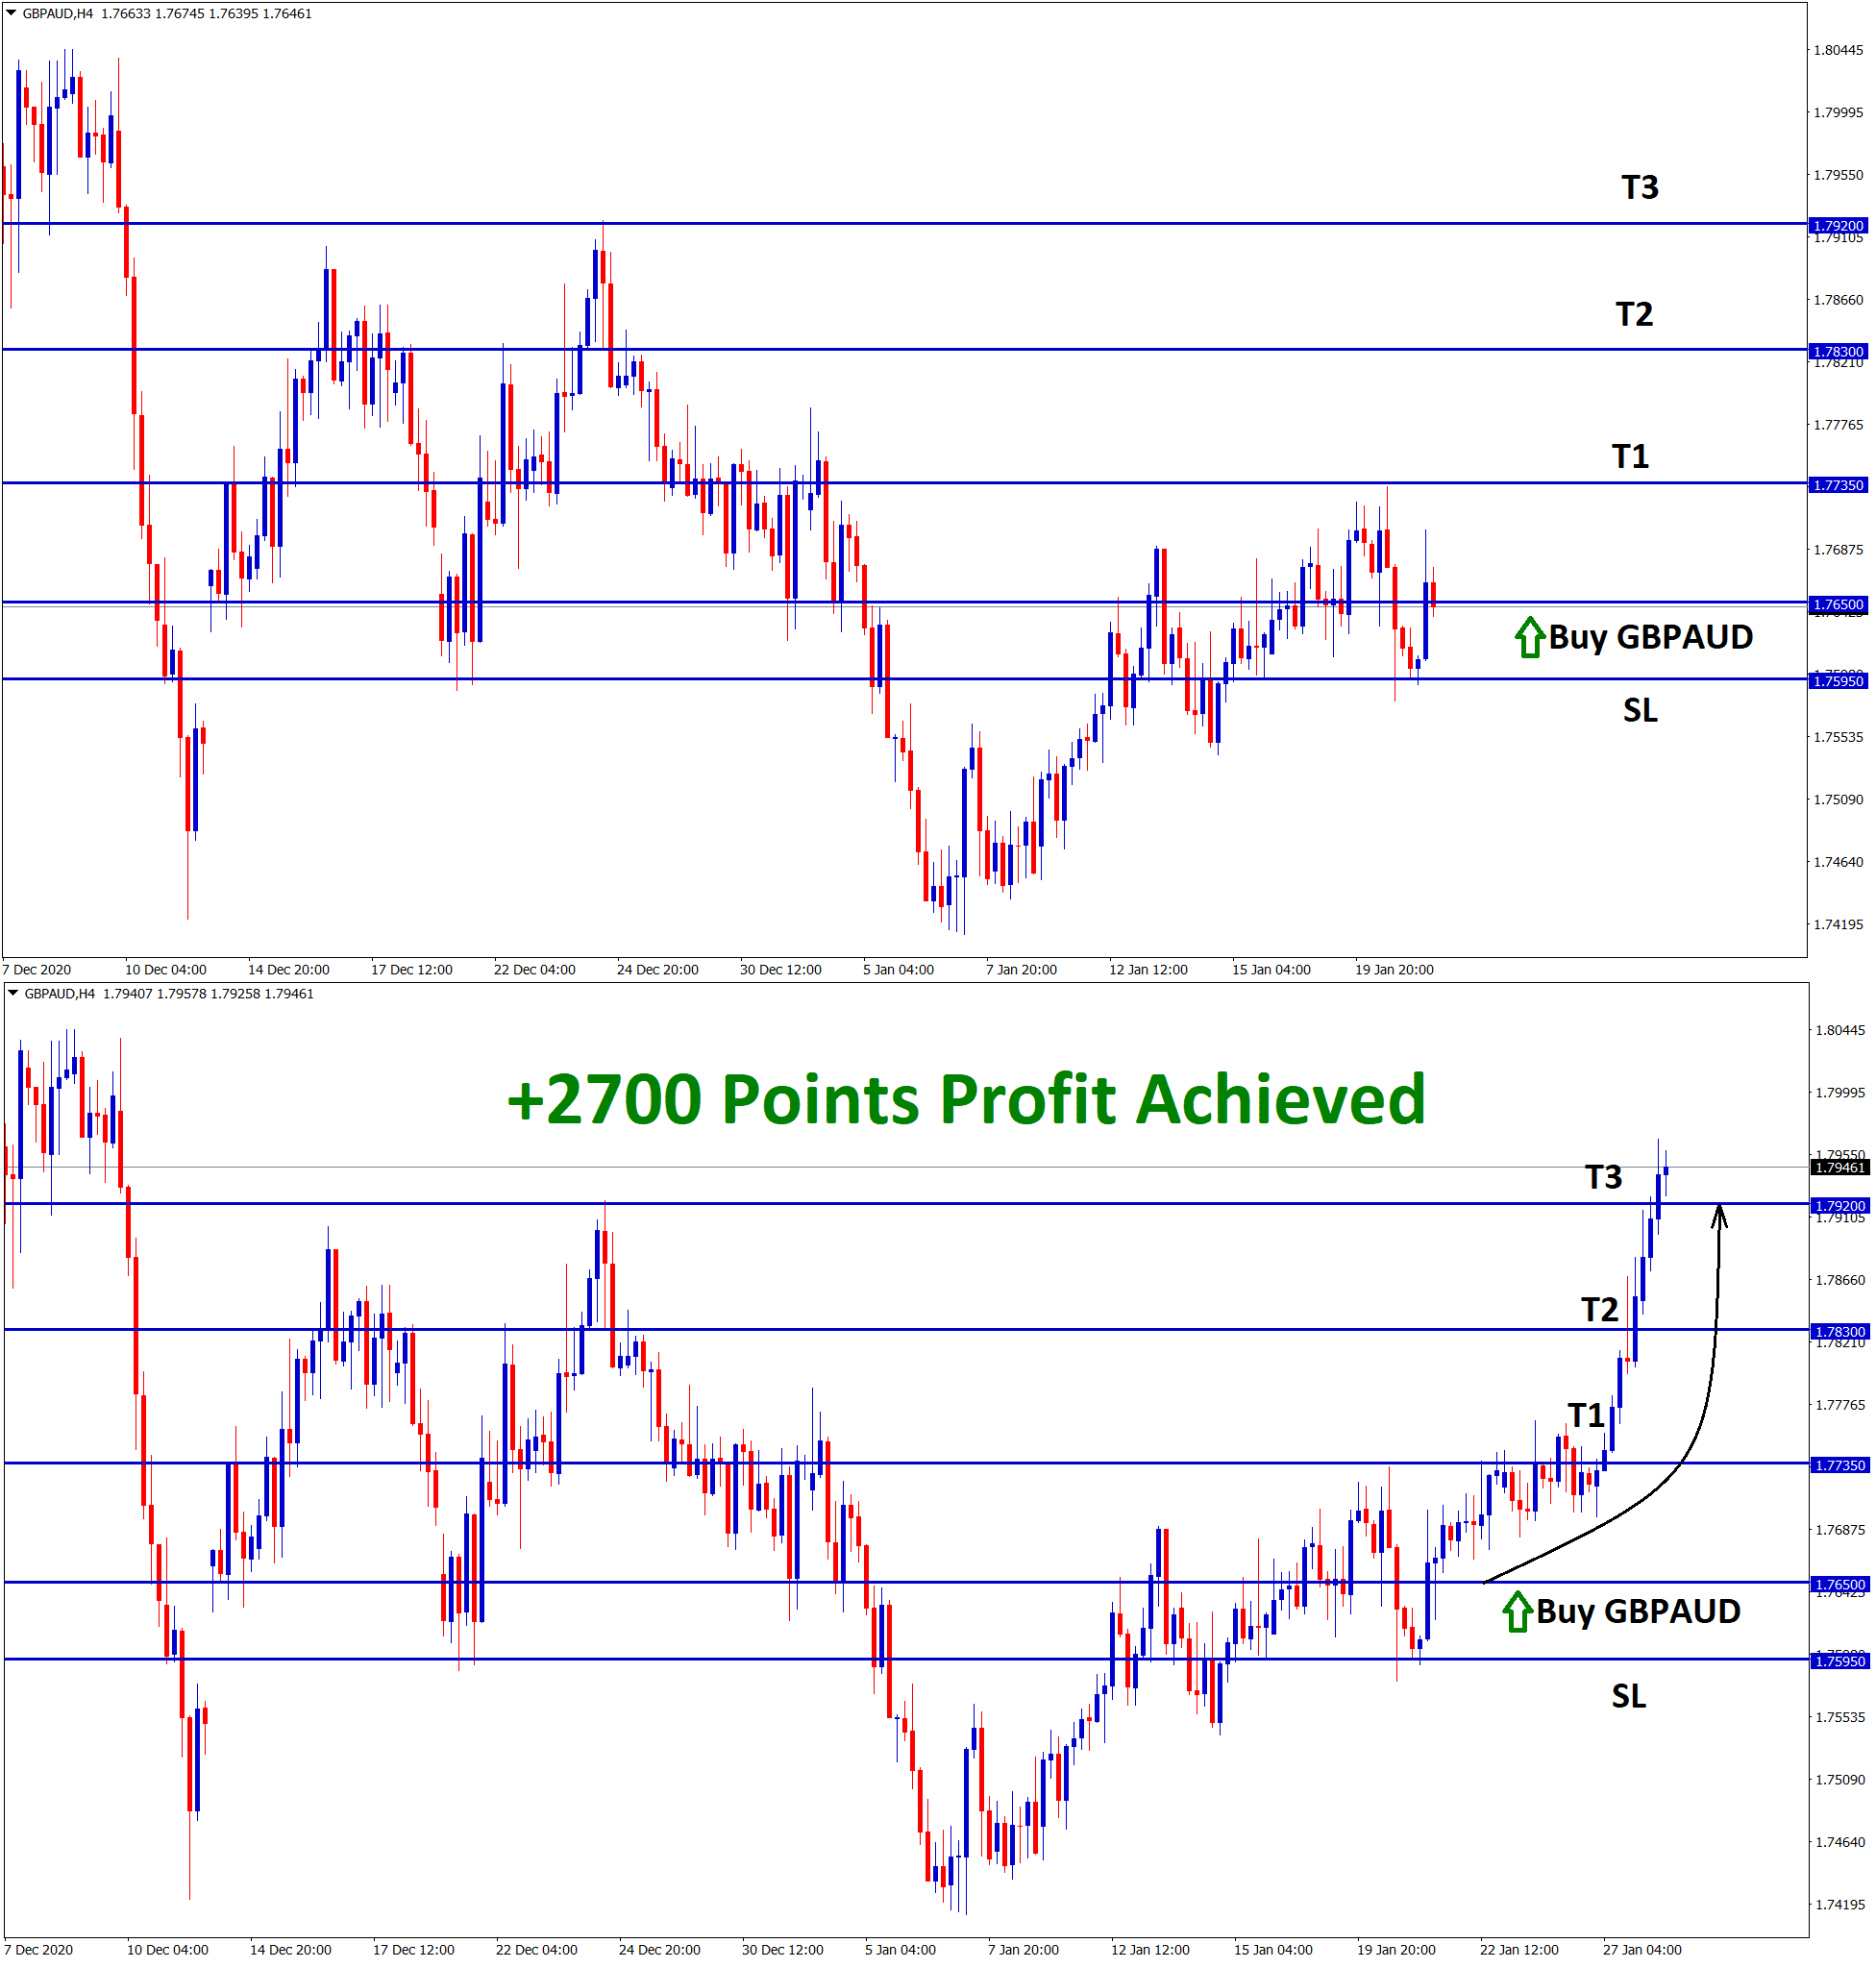
GBPAUD Buy Analysis GBPAUD has broken the top zone of the downtrend line. After breakout, the market has retested the…
-
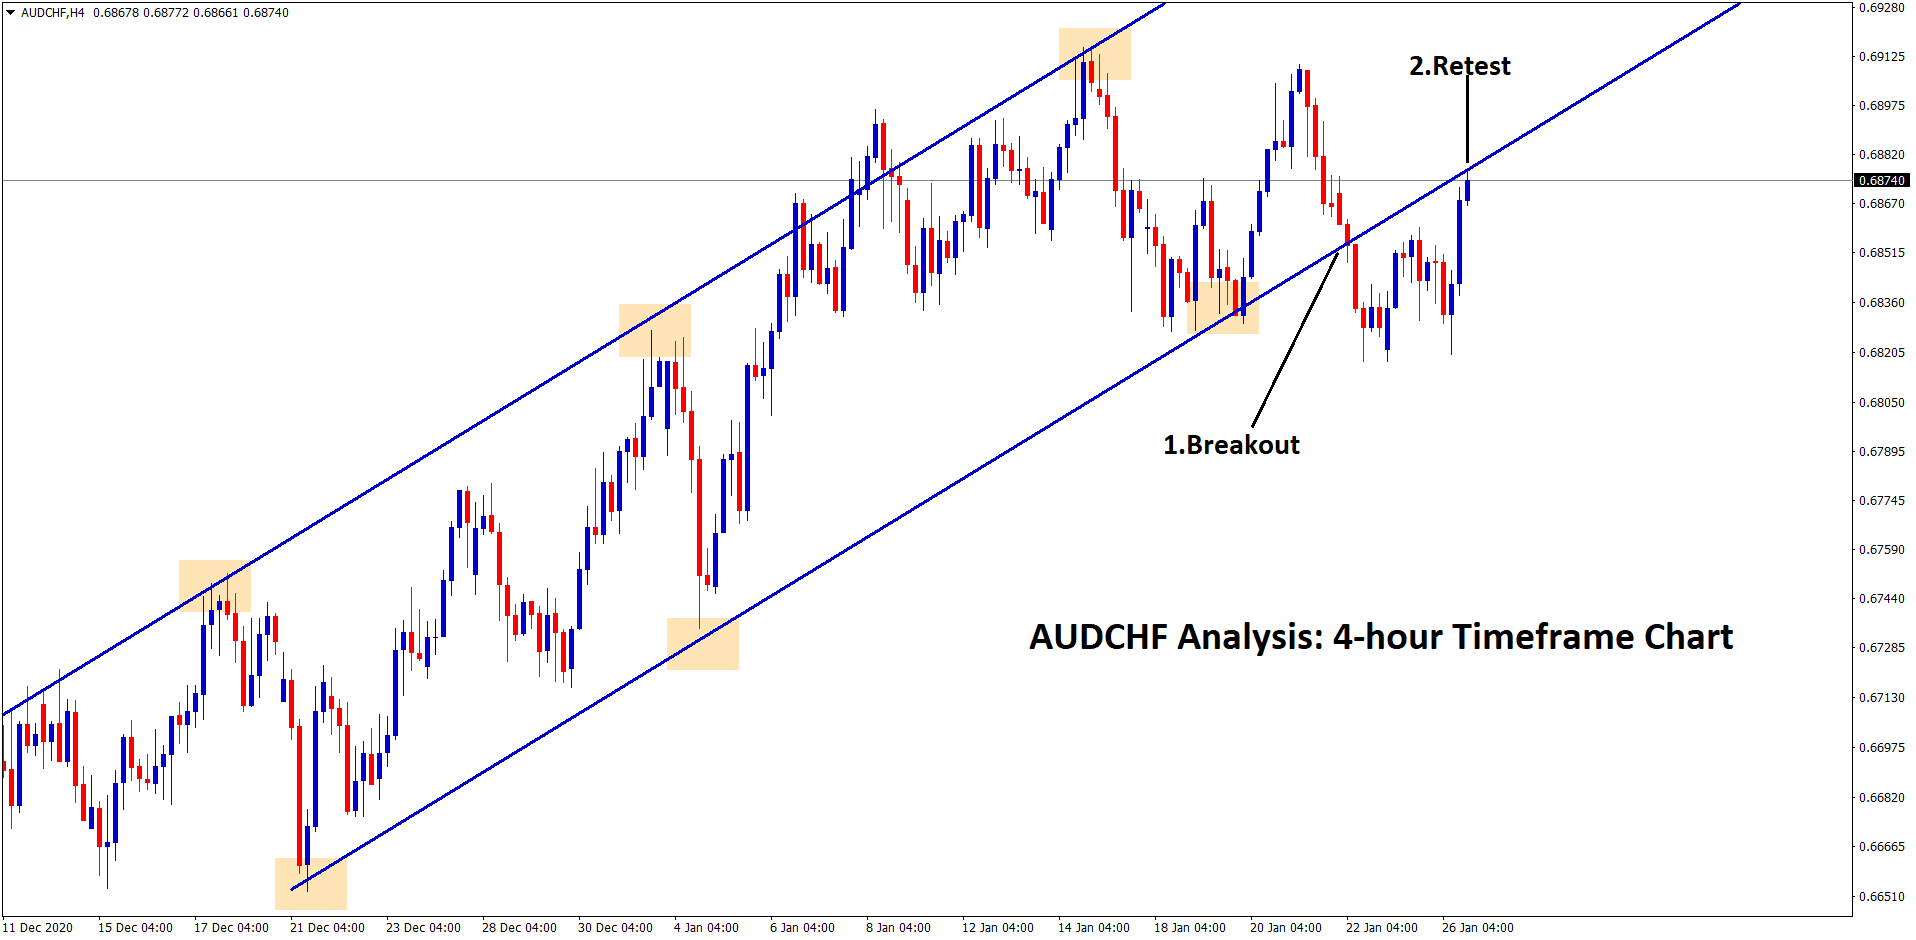
+1120 Points achieved in AUDCHF Sell Signal while retesting the broken uptrend line
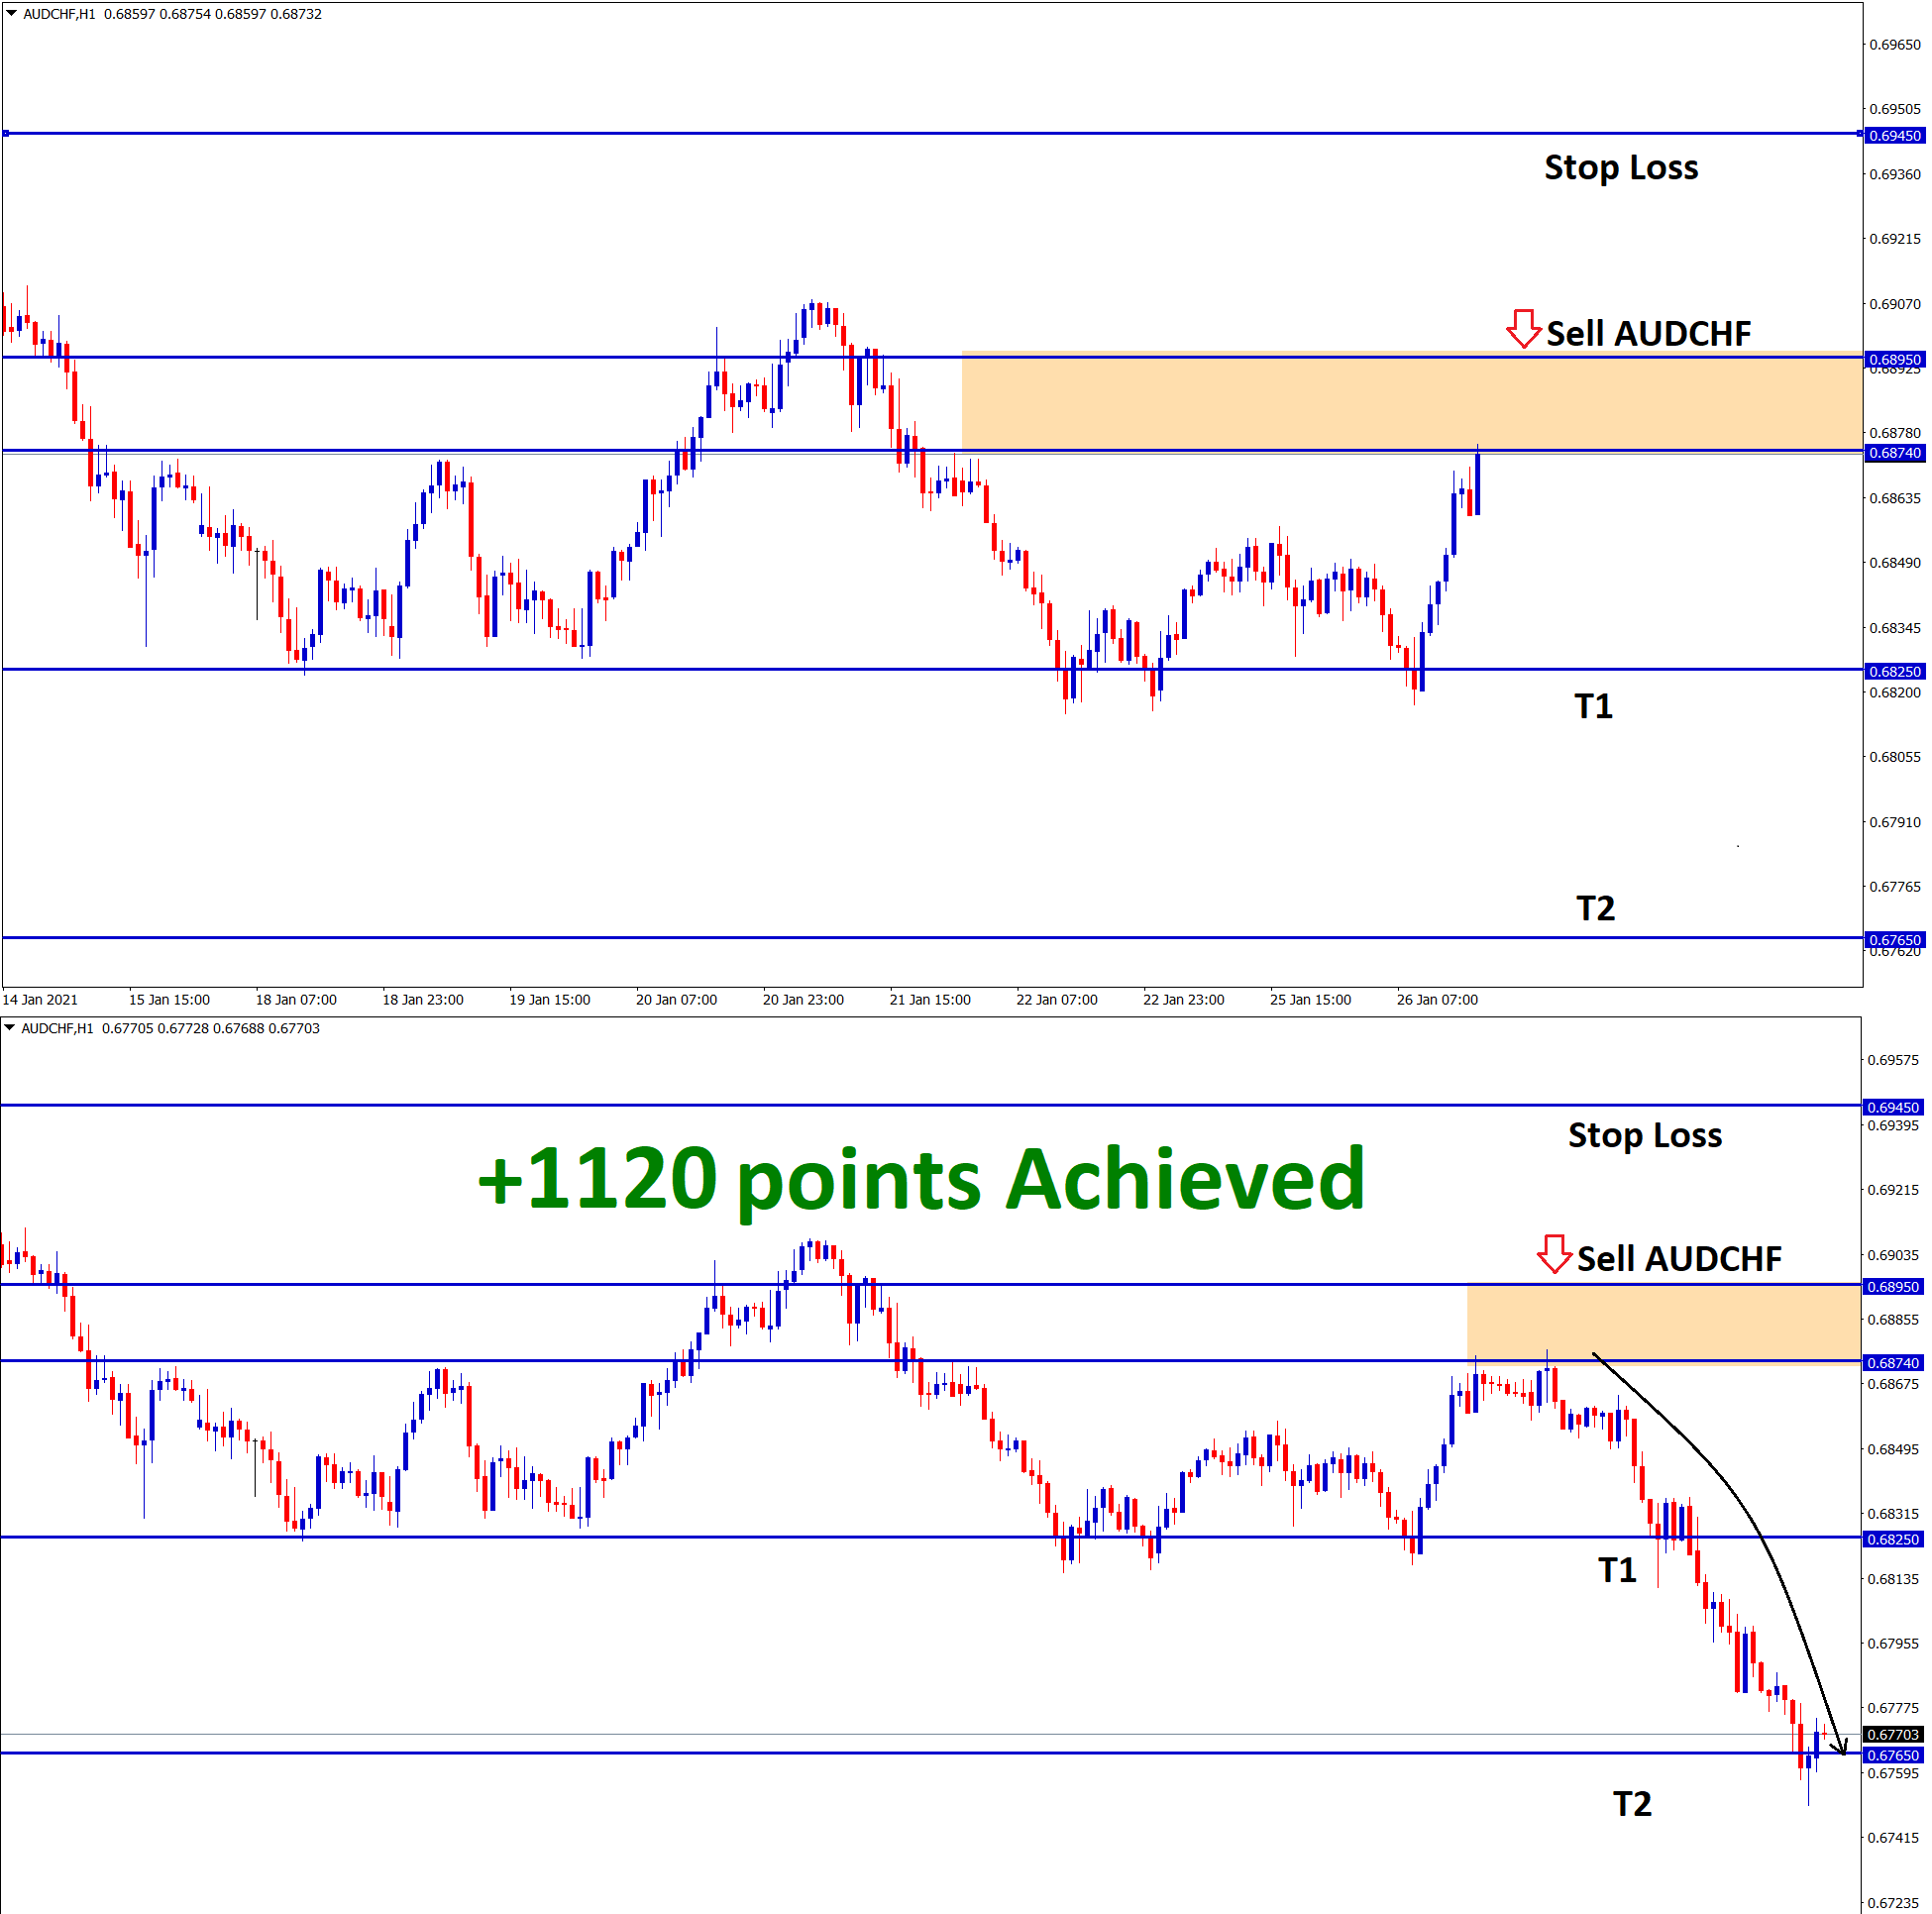
AUDCHF Analysis AUDCHF has broken the bottom level of the uptrend line and it's retesting the broken level. AUDCHF has…
-
+690 Points Achieved in EURAUD Buy signal from the higher low zone of Uptrend
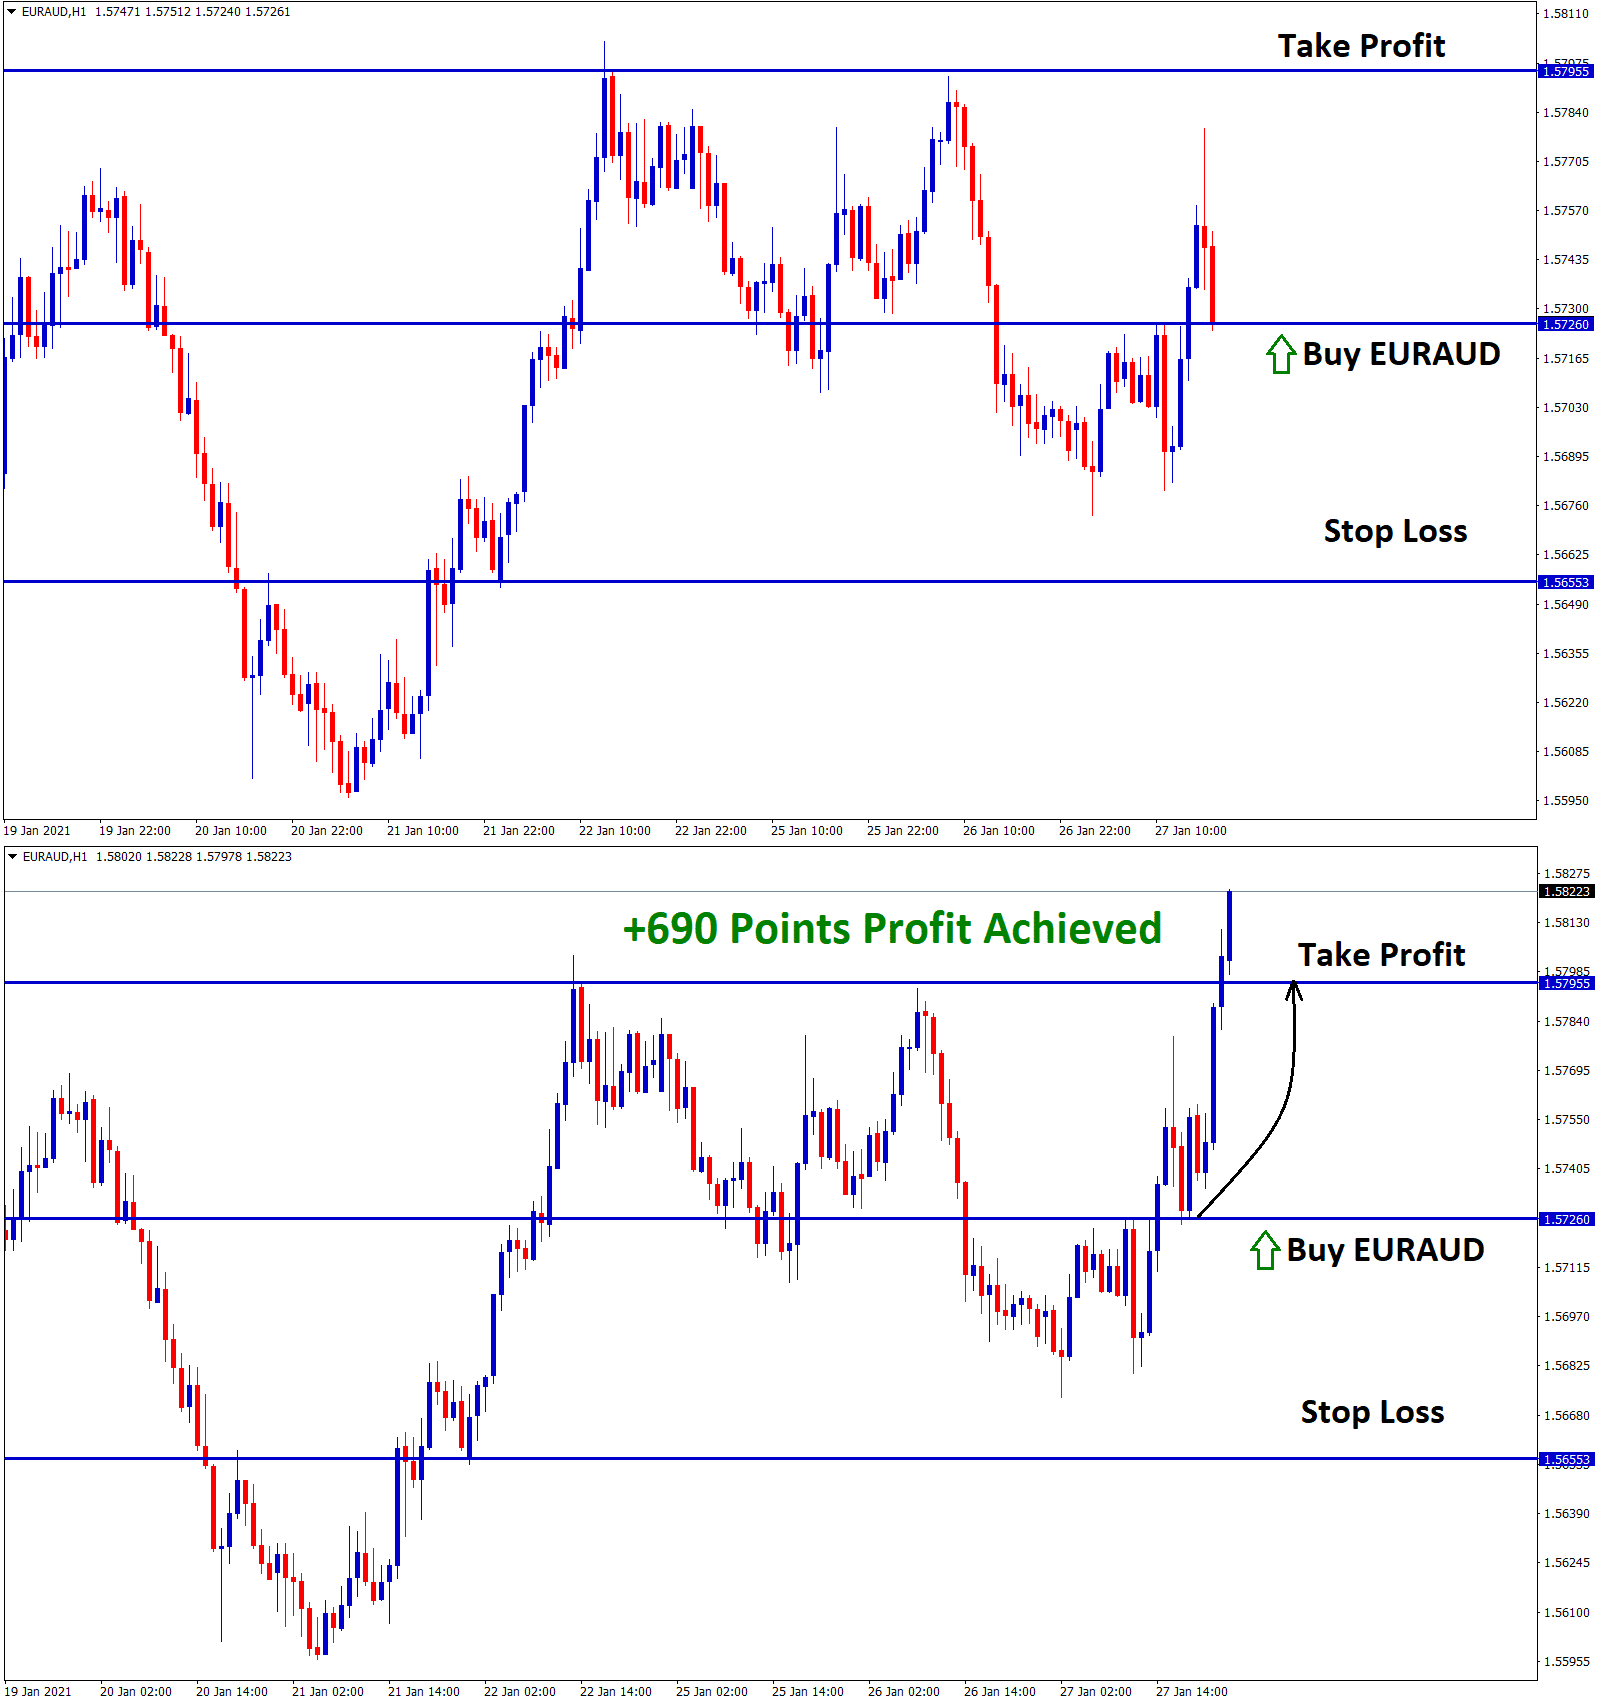
EURAUD Analysis EURAUD is bouncing up from the higher low zone of the Uptrend line in the 30-minutes time frame…
-
+520 Points made in AUDCHF Sell while retesting the broken uptrend line
AUDCHF Analysis AUDCHF has broken the bottom level of the uptrend line and it's retesting the broken level. After the…
-
+1800 Points Achieved in GBPAUD Buy Signal
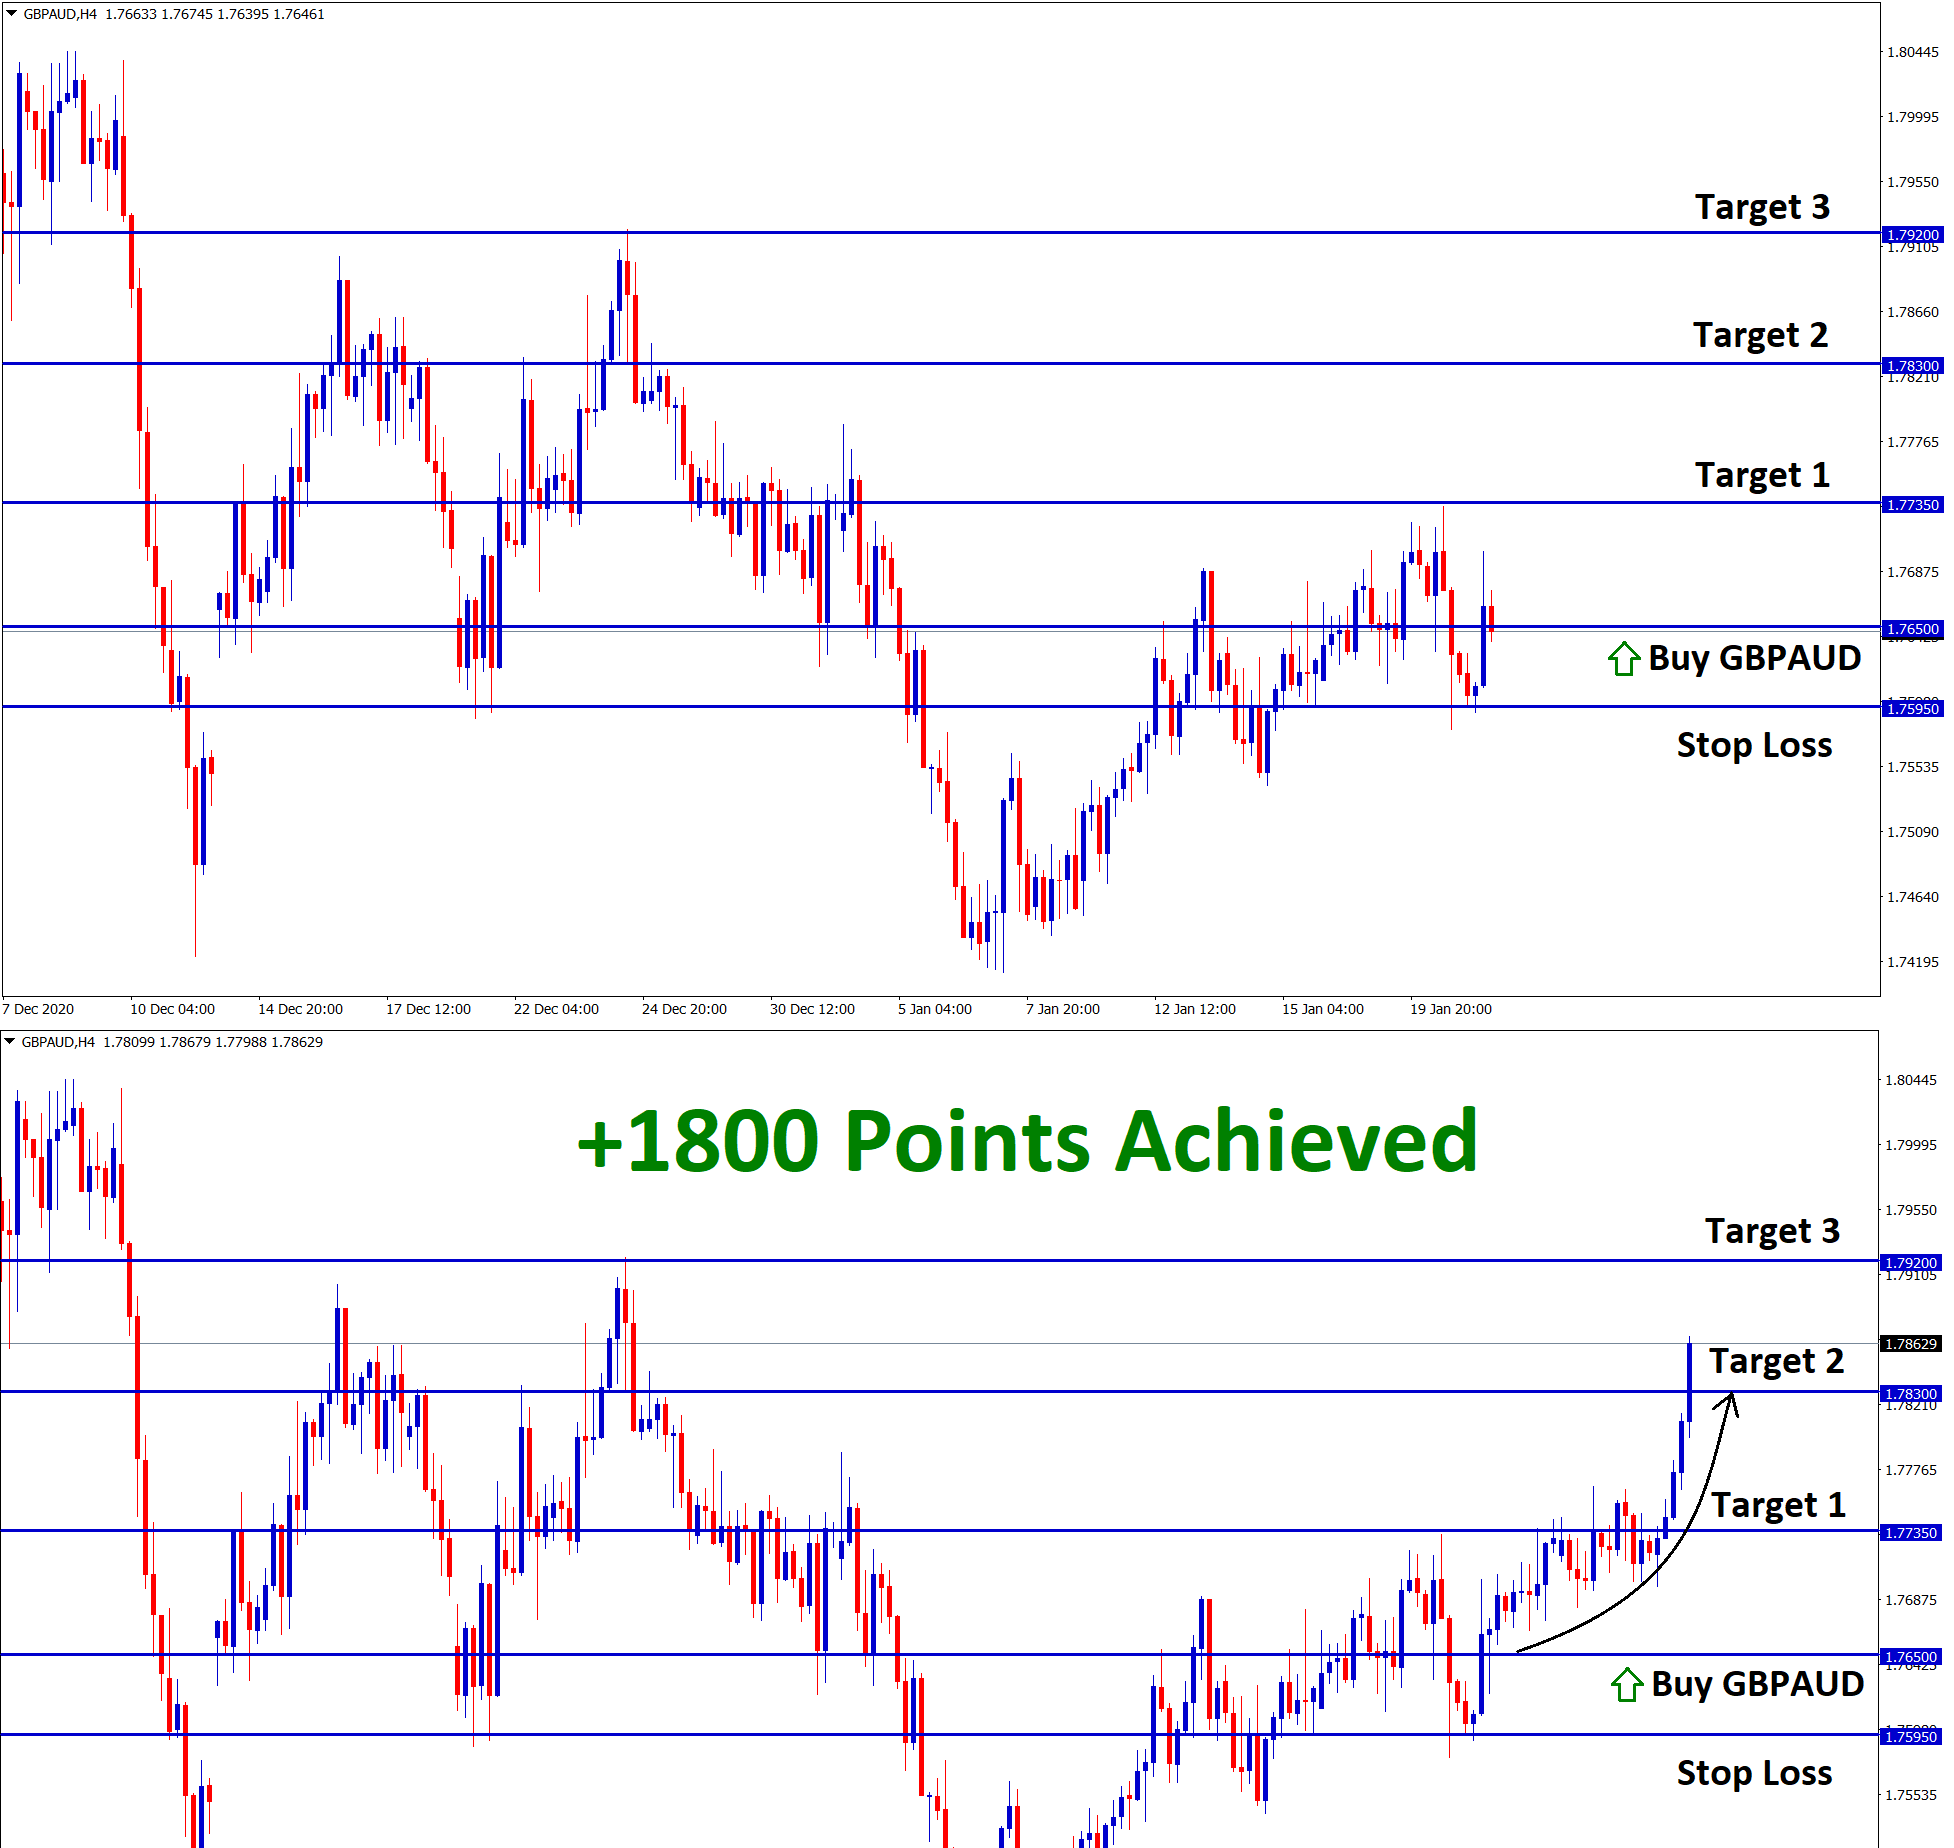
GBPAUD Buy Analysis GBPAUD has broken the top zone of the downtrend line. After breakout, the market has retested the…
-
+850 Points reached in GBPAUD after retesting the broken trend line
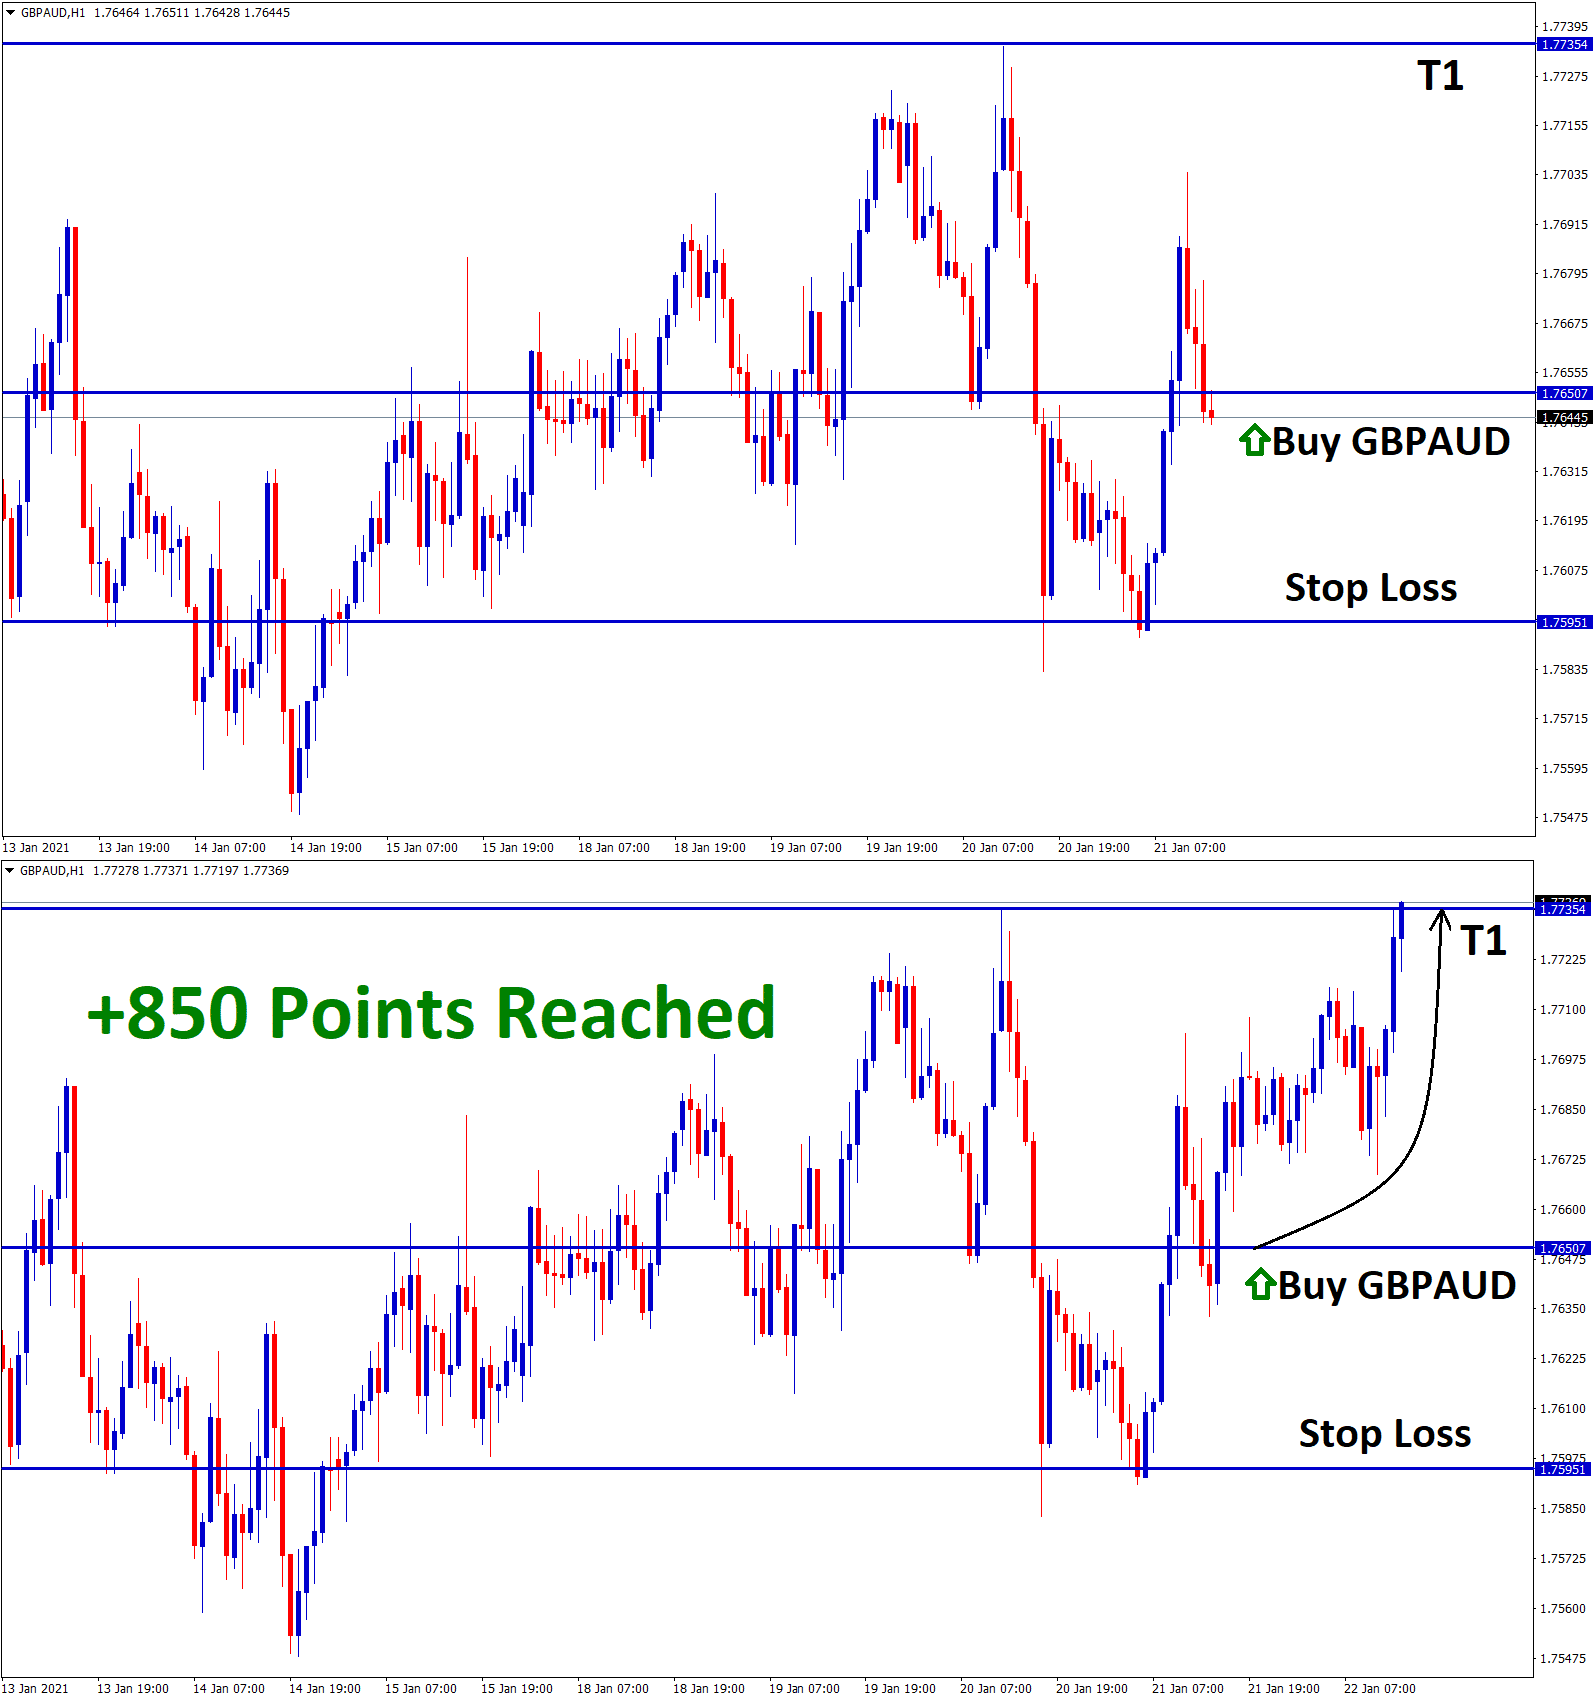
GBPAUD Buy Analysis GBPAUD has broken the top zone of the downtrend line. After breakout, the market has retested the…