Forex Signal Results
Check Full Forex Market Signals with Technical Analysis Chart
Please note : It is better to do nothing instead of taking wrong trades, we focus on providing you the forex signals only at good trade setup. Each trade signal given to you with fundamental and technical analysis chart which helps you to understand why our analyst team has given the Buy signals and Sell Signals. Now, you can trade with confident using our service. Sounds good? Let's look out all our signal charts below. If you want to test our forex signals, Try free plan (or) if you need more important forex signals, Join here for Premium or Supreme planCheck some of our Subscriber's Myfxbook Live Real Trading results - Click here to see Live Real USD Trading Accounts Try our free service now, let the results speak the rest.
-
Silver is at the top now for both triangle and channel pattern
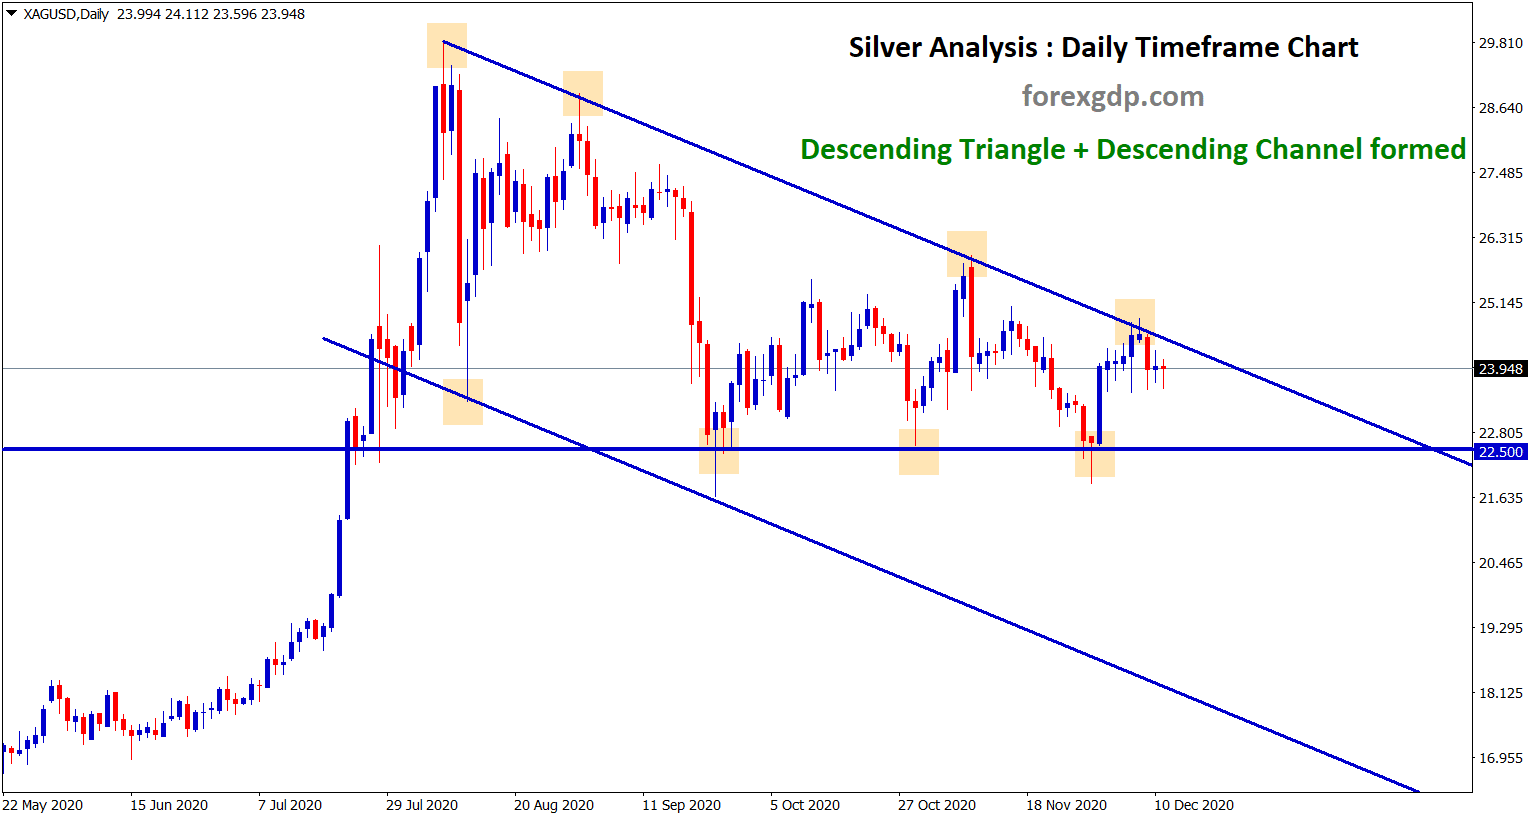
Silver Analysis: Silver has formed a Descending Triangle and Descending Channel Pattern in the Daily timeframe chart. Now, Silver price…
-
CADJPY is standing now at the very important price zone
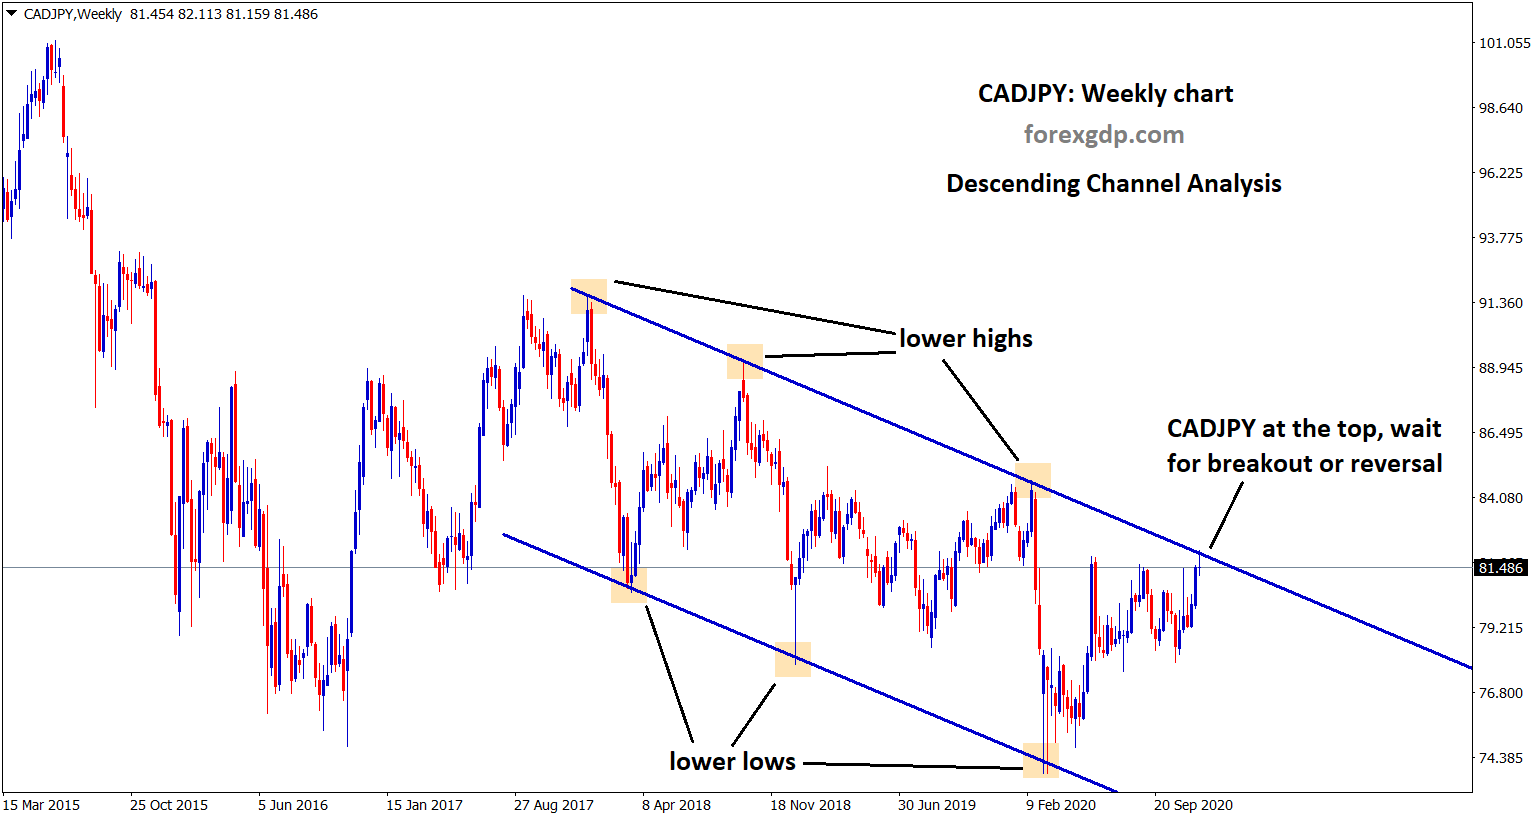
CADJPY Descending Channel Analysis CADJPY at the top zone of the descending channel. wait for the confirmation of breakout or…
-
Brexit deal is going to decide the direction on EURGBP
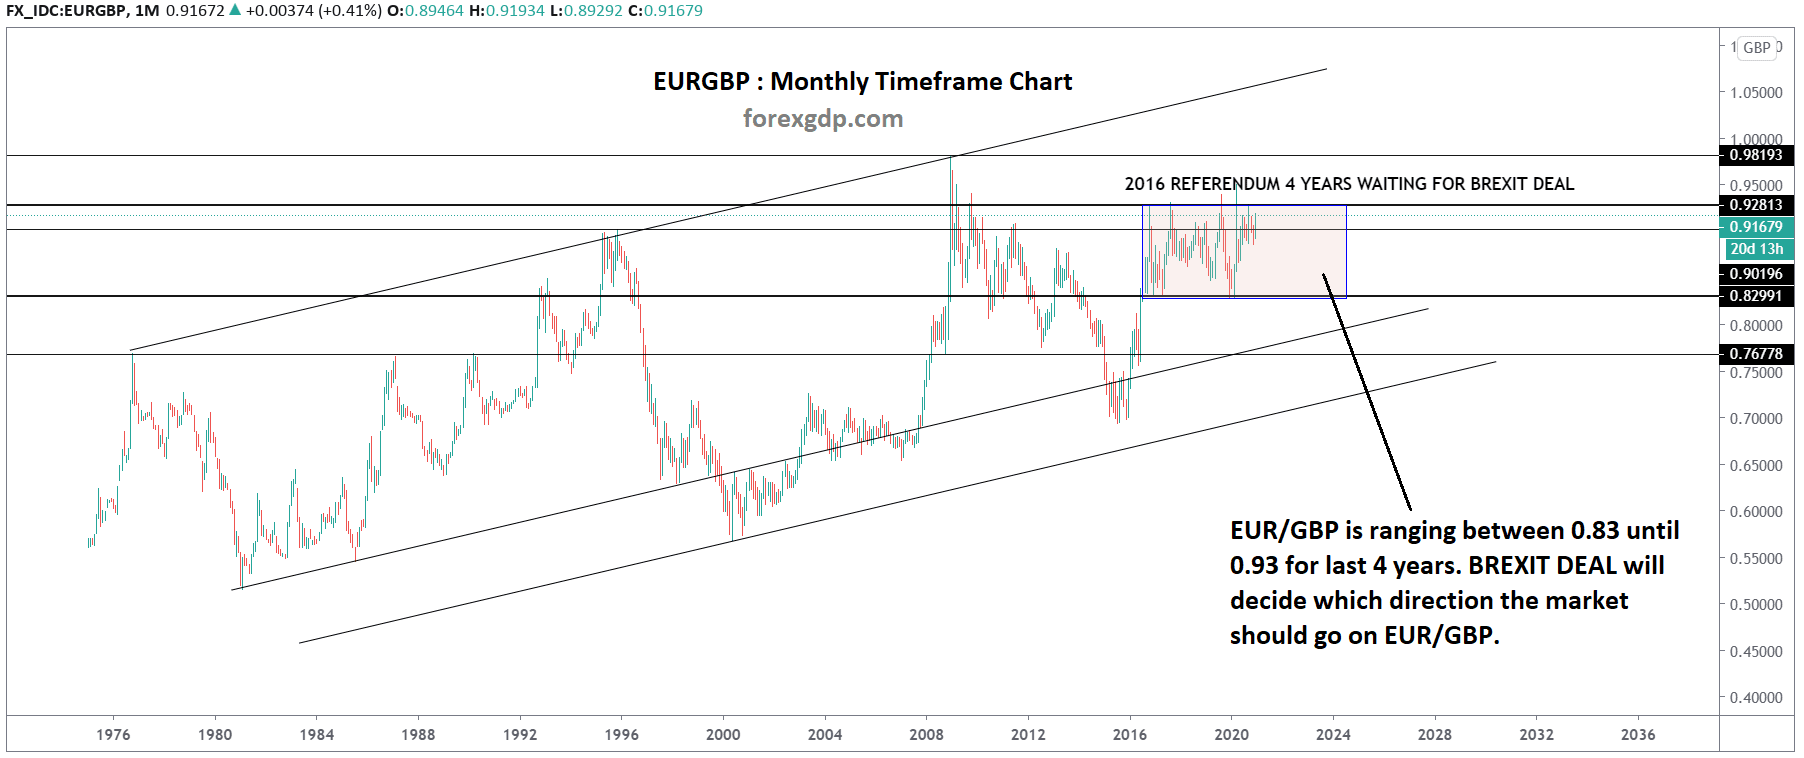
EUR/GBP Analysis EUR/GBP is ranging from 0.83 until 0.93 for last 4 years. BREXIT DEAL will decide which direction the…
-
USDZAR is moving in a strong uptrend for more years
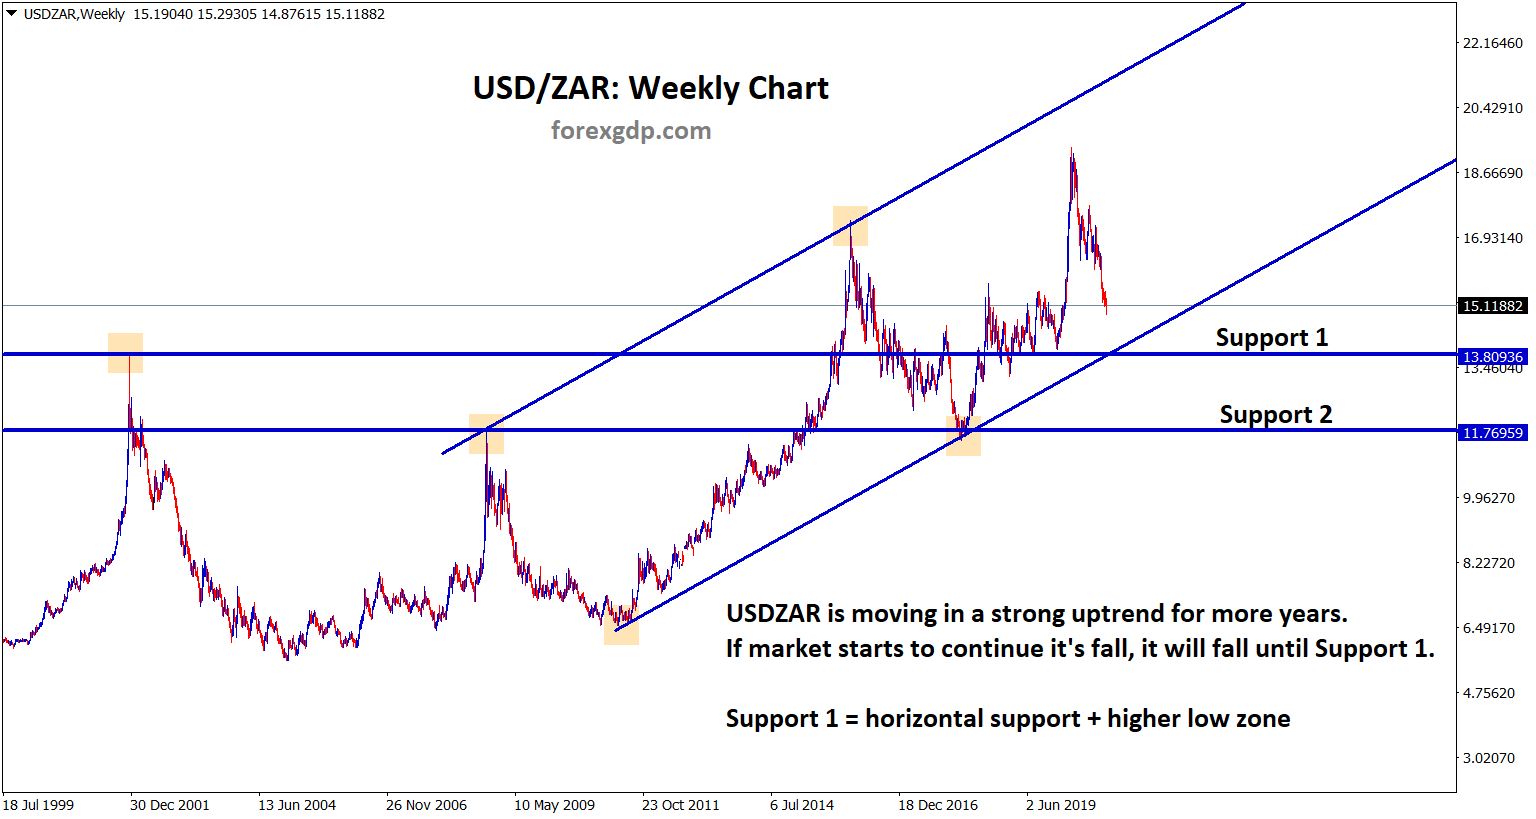
USDZAR Analysis: USDZAR is moving in a strong uptrend for more years. If the market starts to continue its fall,…
-
USDTRY analysis – Uptrend line move
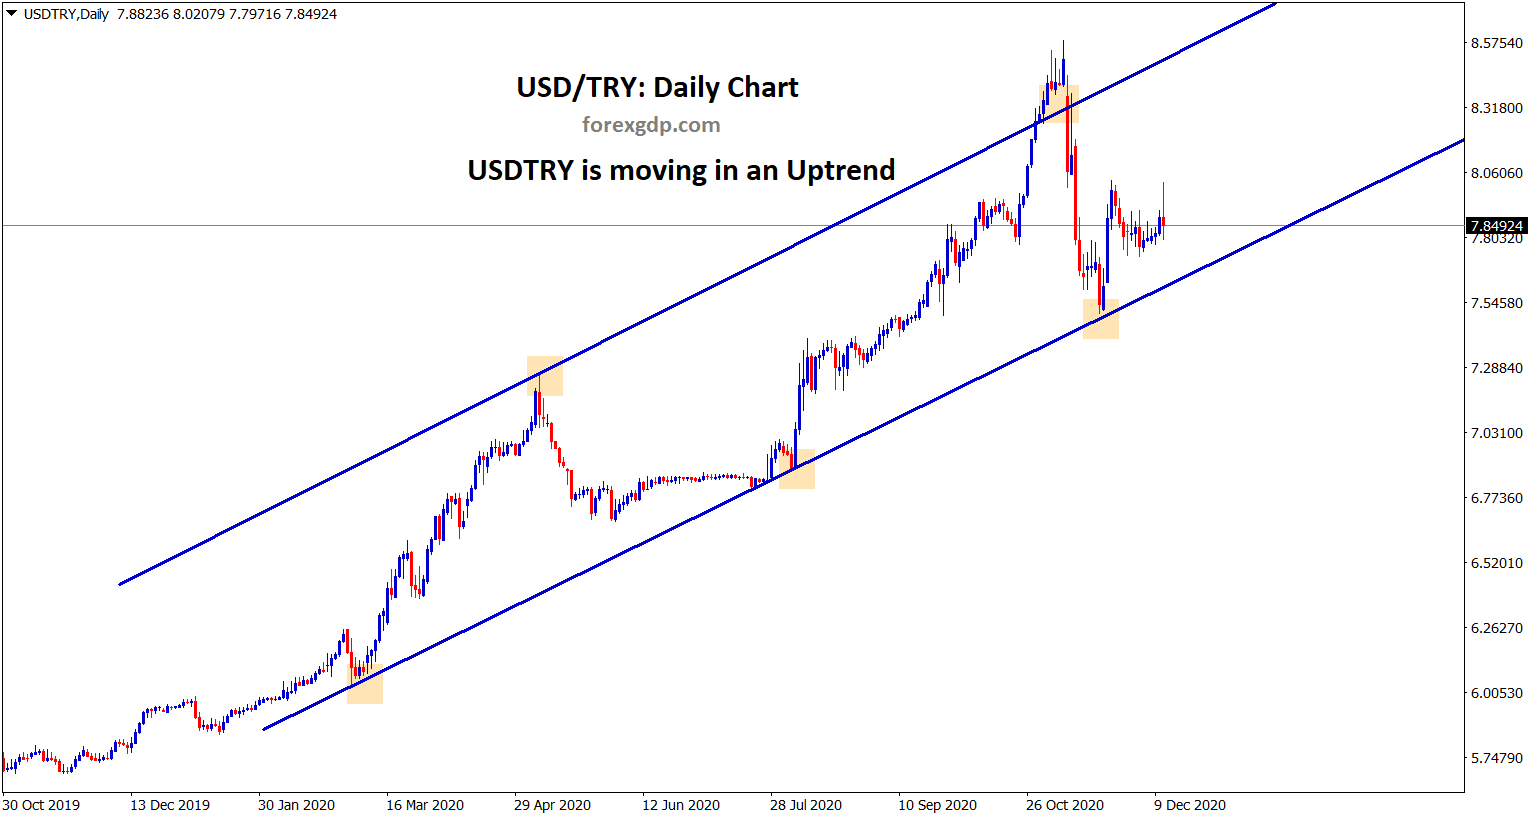
USD/TRY Analysis: USD/TRY is moving in a strong uptrend for a long time in the daily chart.
-
Bullish Pennant Pattern going to break soon on EURJPY
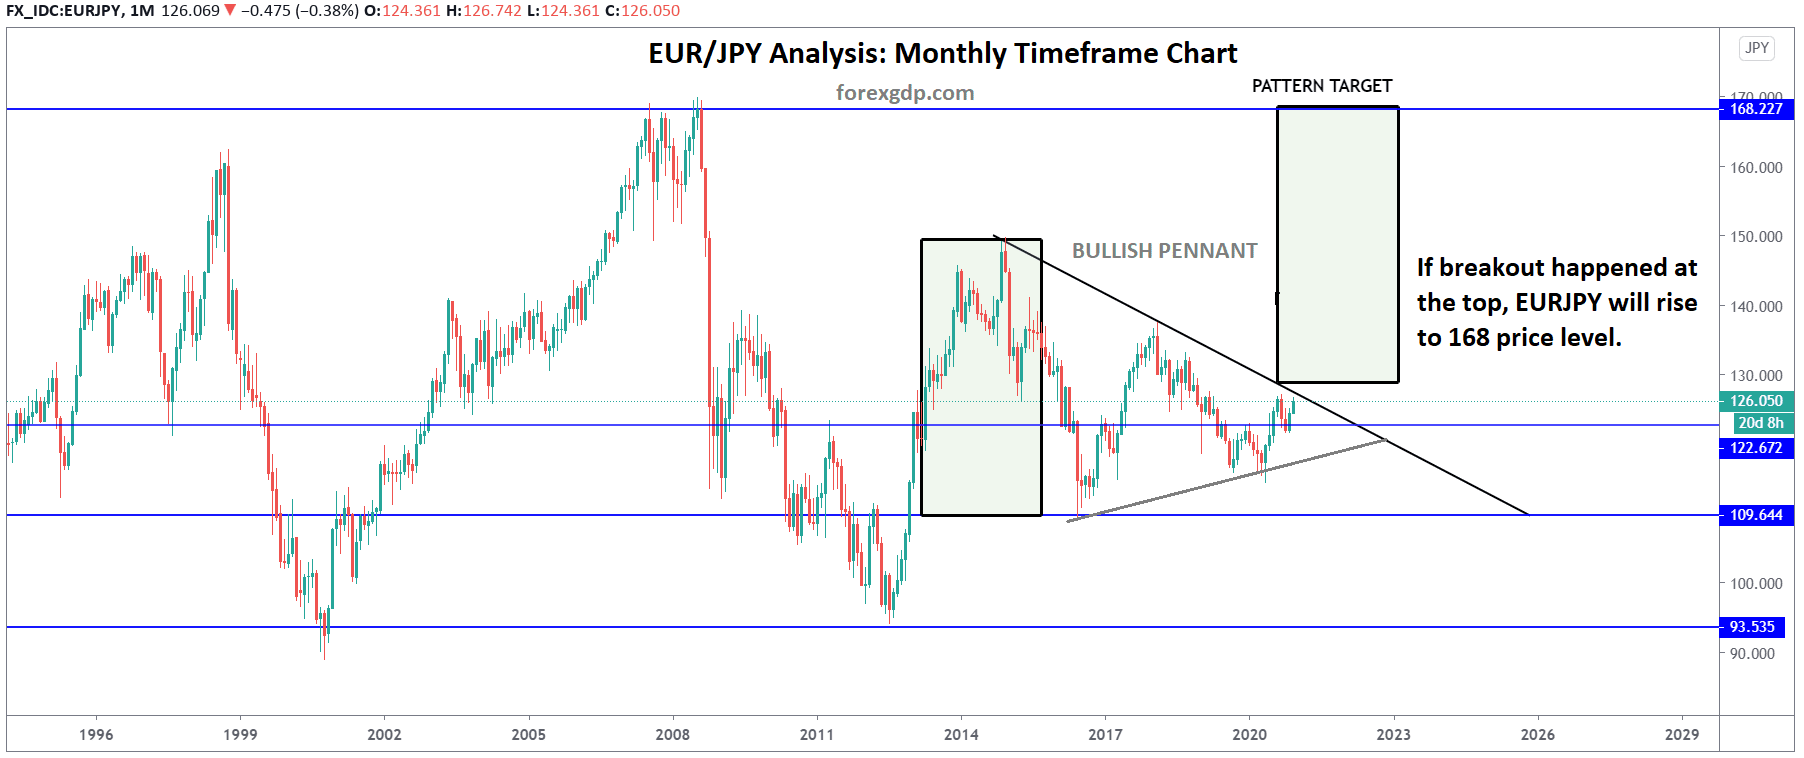
EURJPY Analysis: EURJPY going to break the Bullish Pennant pattern soon. If breakout happened at the top, EURJPY will rise…
-
Descending Triangle top has broken on NZD/CAD
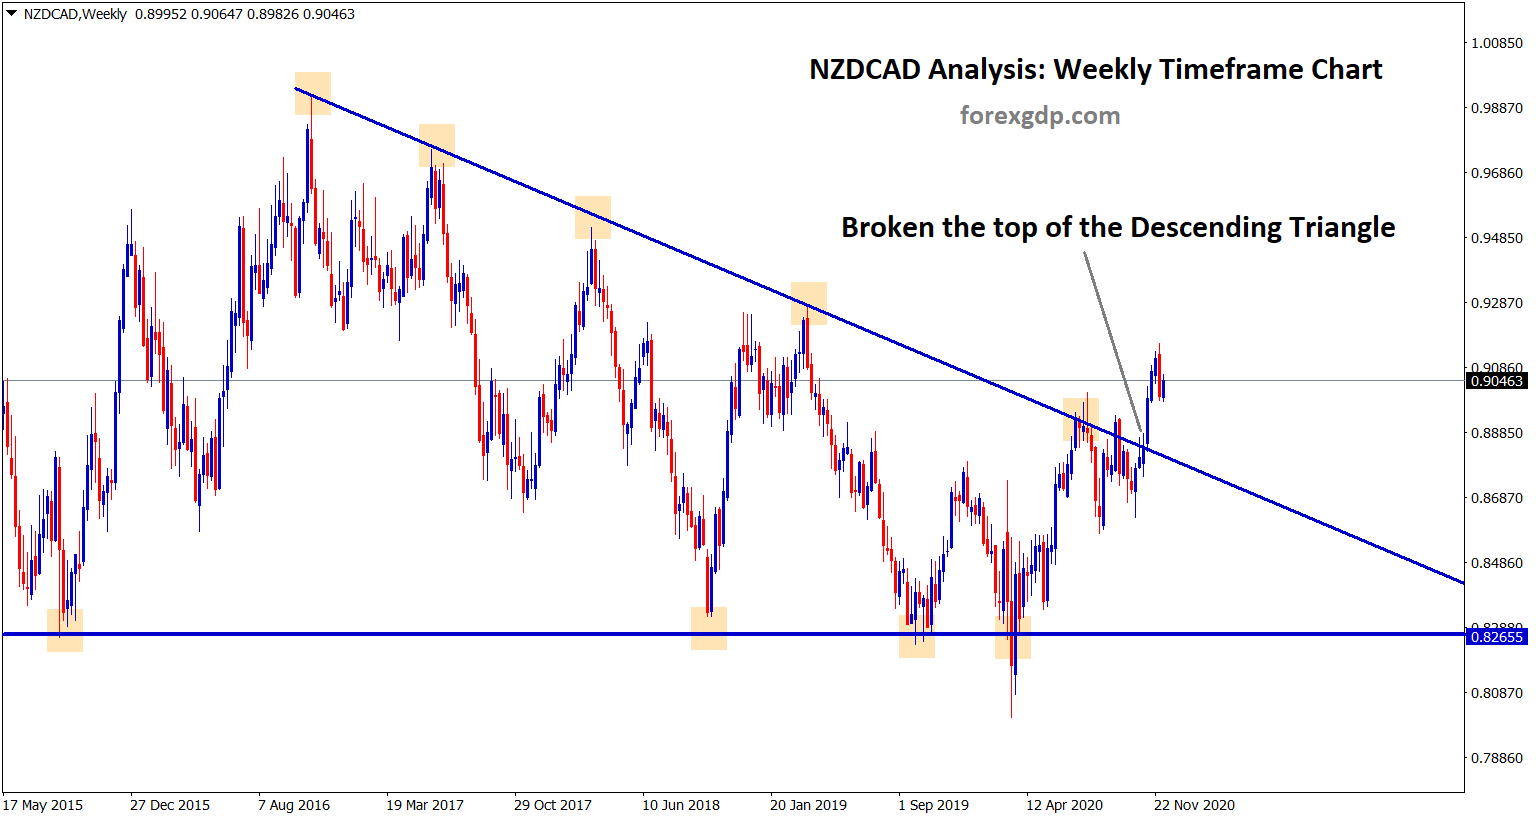
NZD/CAD Analysis: NZD/CAD has broken the top zone of the descending triangle. Wait for the market to retest the broken…
-
AUDNZD has broken the descending channel top?
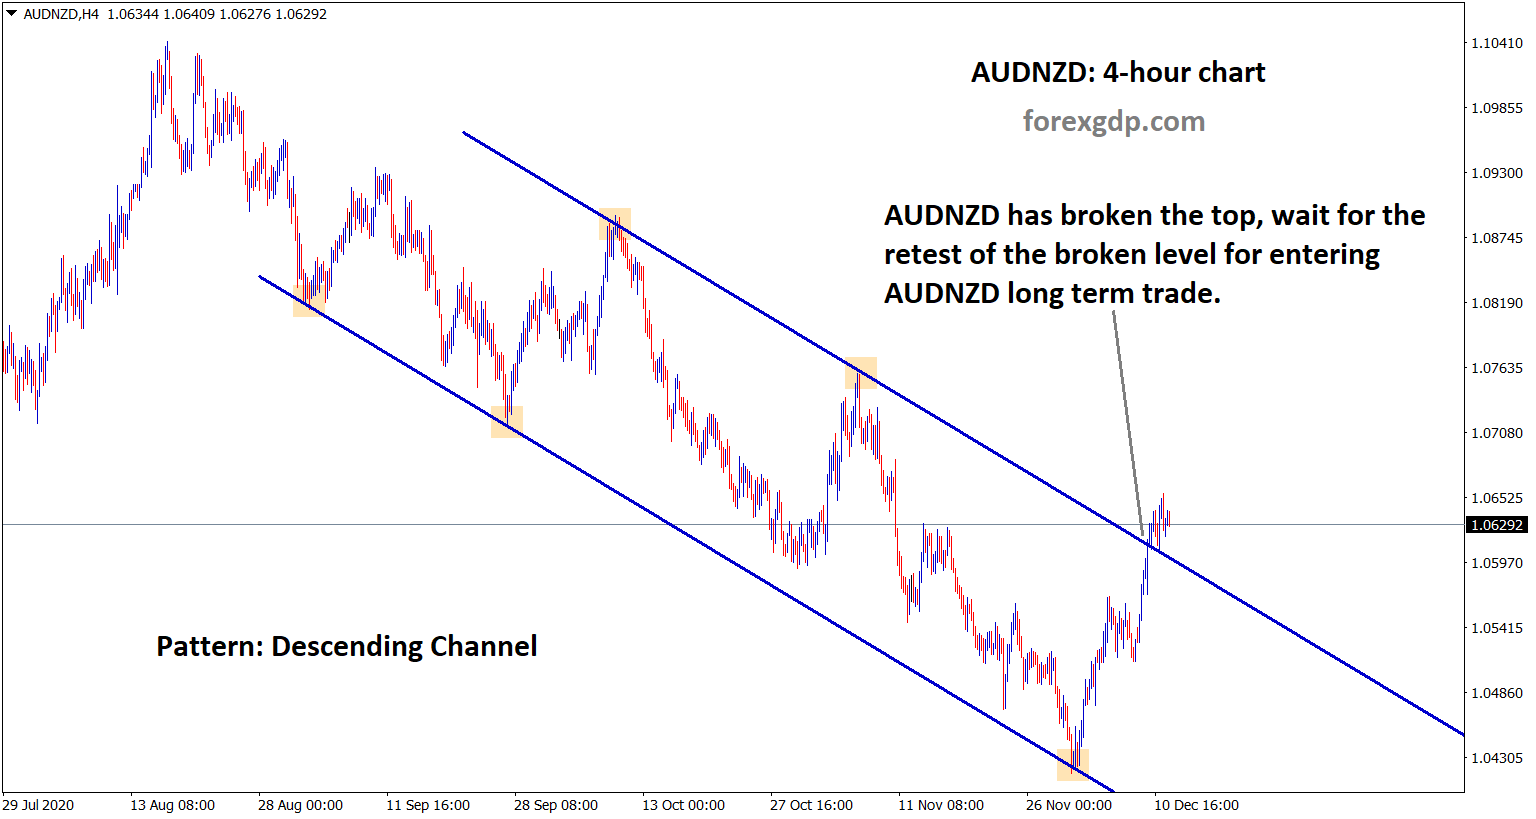
AUDNZD Analysis: AUDNZD has broken the top, wait for one swing and the retest of the broken level for entering…
-
Elliot wave is possible to form from this bounce back on AUD/CHF
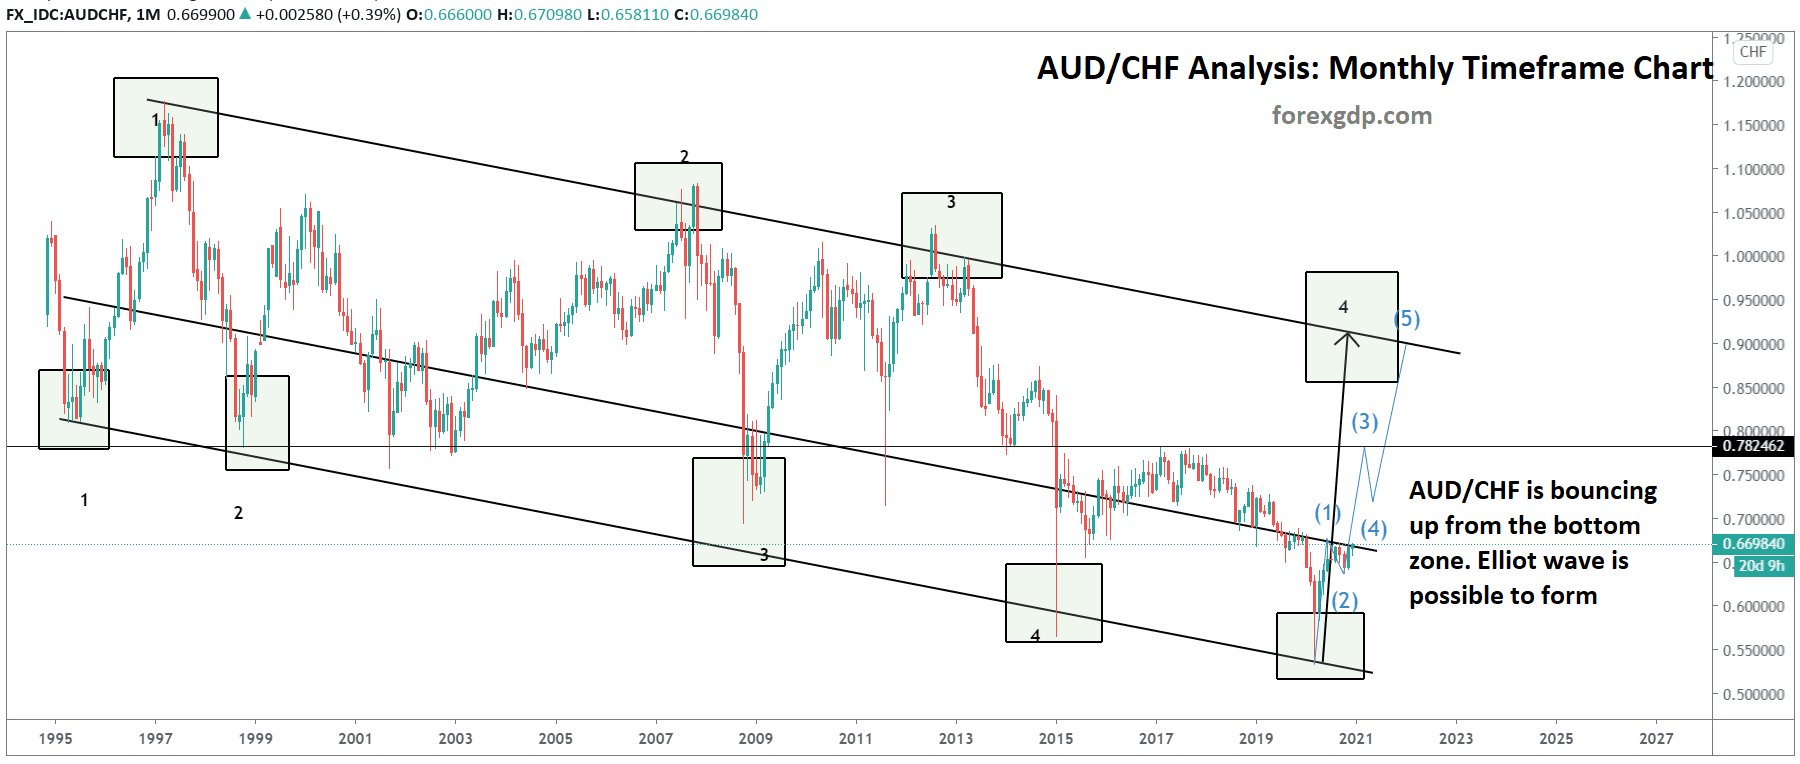
AUDCHF Analysis: AUD/CHF is bouncing up from the bottom zone. Elliot wave is possible to form.
-
Ascending Triangle has broken and retesting now in EURNZD reached +550 Points
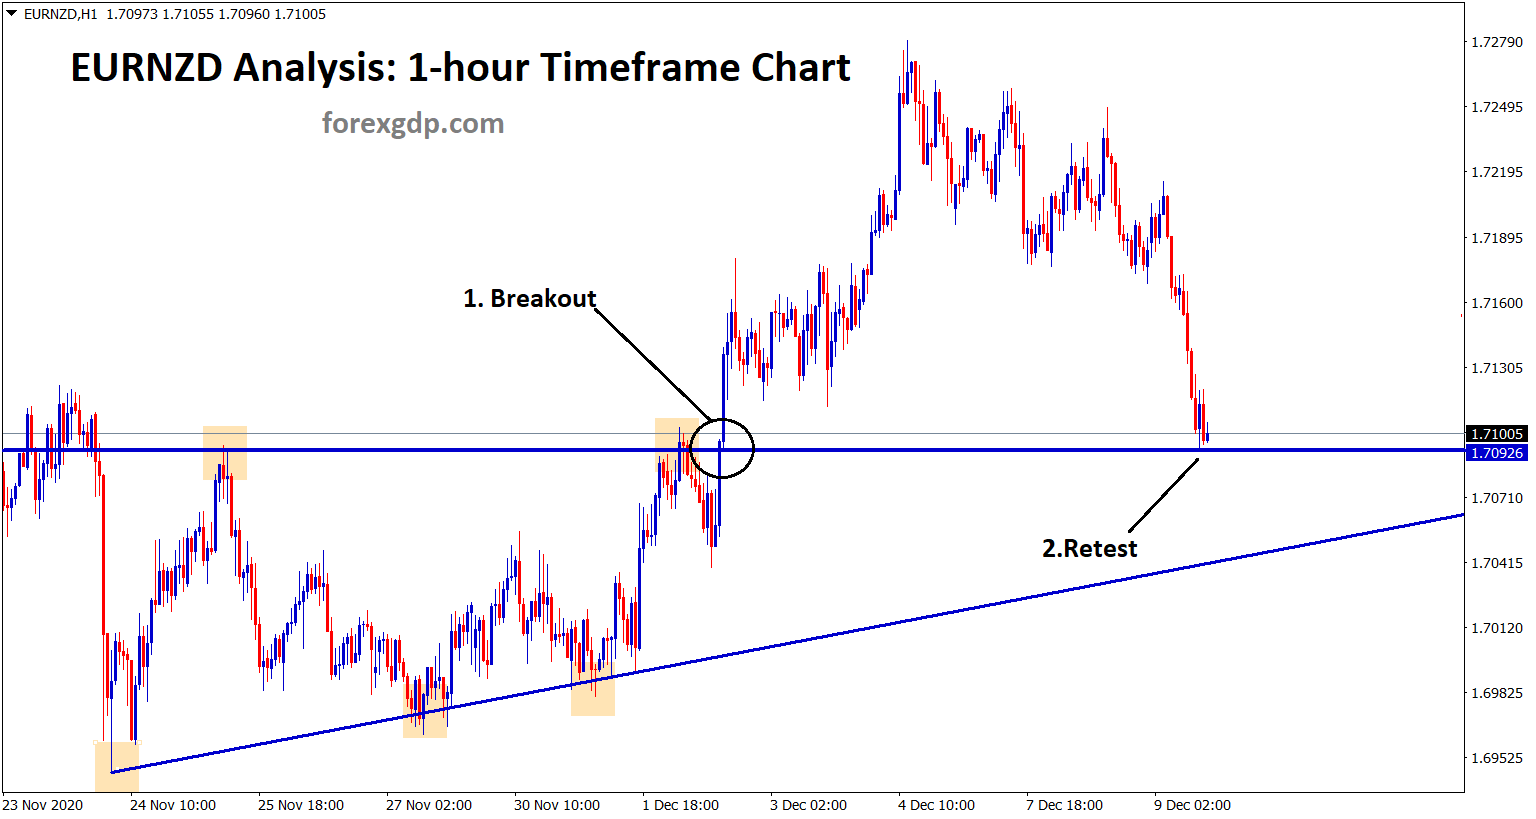
EURNZD Triangle Retest Analysis EURNZD has broken the top level of the Ascending Triangle pattern in the 1-hour timeframe chart.…
-
Gold price – How much it will rise?
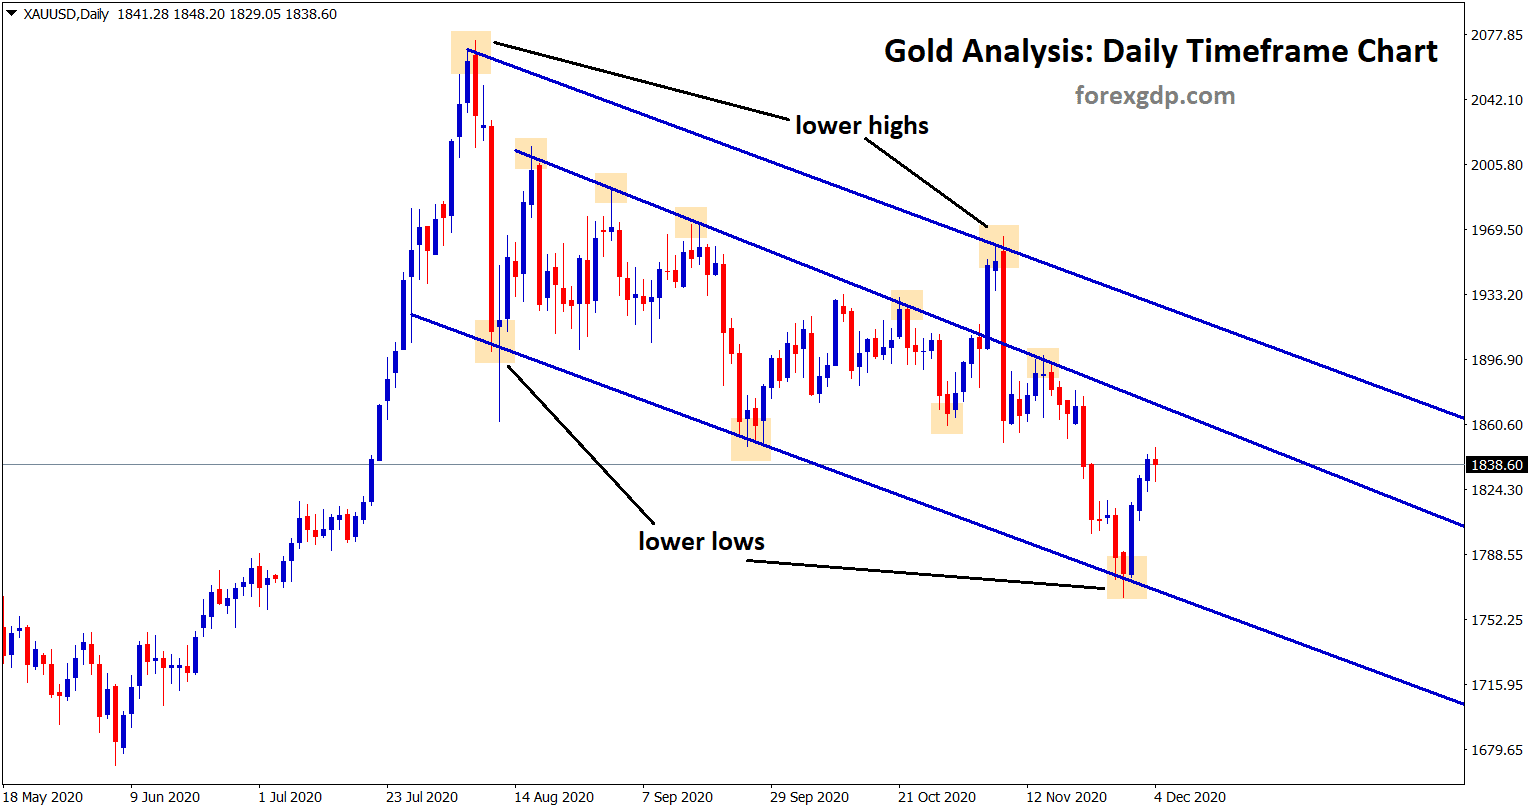
Gold XAU/USD Chart Analysis Gold is moving in a downtrend by forming lower highs and lower lows in the daily…
-
USDCAD, CADJPY, GBPCAD, EURCAD, AUDCAD, CADCHF at the key price levels. Good to enter?
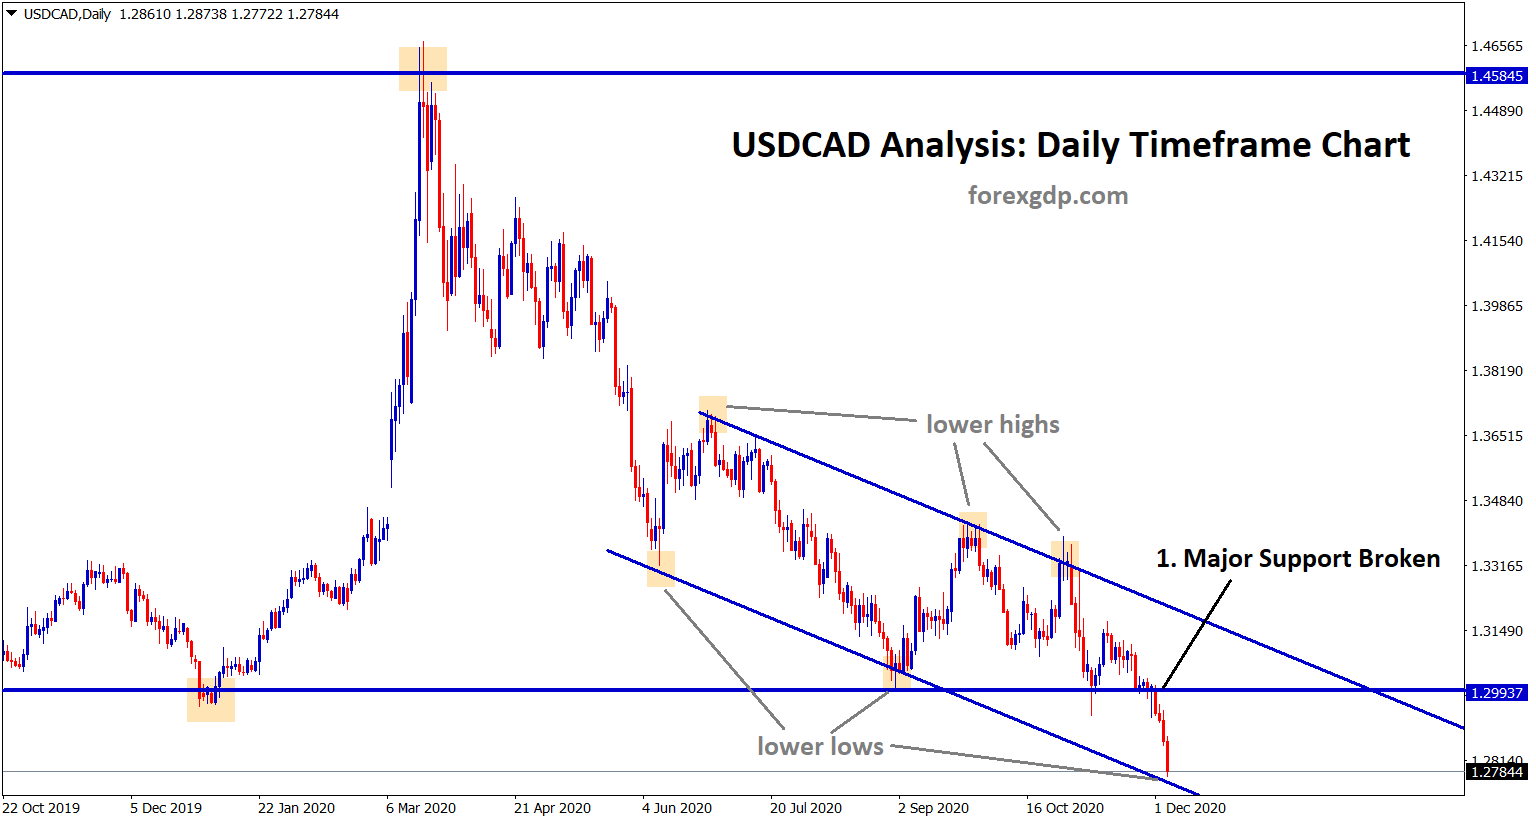
USDCAD USDCAD has broken the major support level and now it reached the lower low zone of the minor downtrend…