Forex Signal Results
Check Full Forex Market Signals with Technical Analysis Chart
Please note : It is better to do nothing instead of taking wrong trades, we focus on providing you the forex signals only at good trade setup. Each trade signal given to you with fundamental and technical analysis chart which helps you to understand why our analyst team has given the Buy signals and Sell Signals. Now, you can trade with confident using our service. Sounds good? Let's look out all our signal charts below. If you want to test our forex signals, Try free plan (or) if you need more important forex signals, Join here for Premium or Supreme planCheck some of our Subscriber's Myfxbook Live Real Trading results - Click here to see Live Real USD Trading Accounts Try our free service now, let the results speak the rest.
-
+580 Points Reached in AUDCHF Buy signal after rebounding from the lower low area
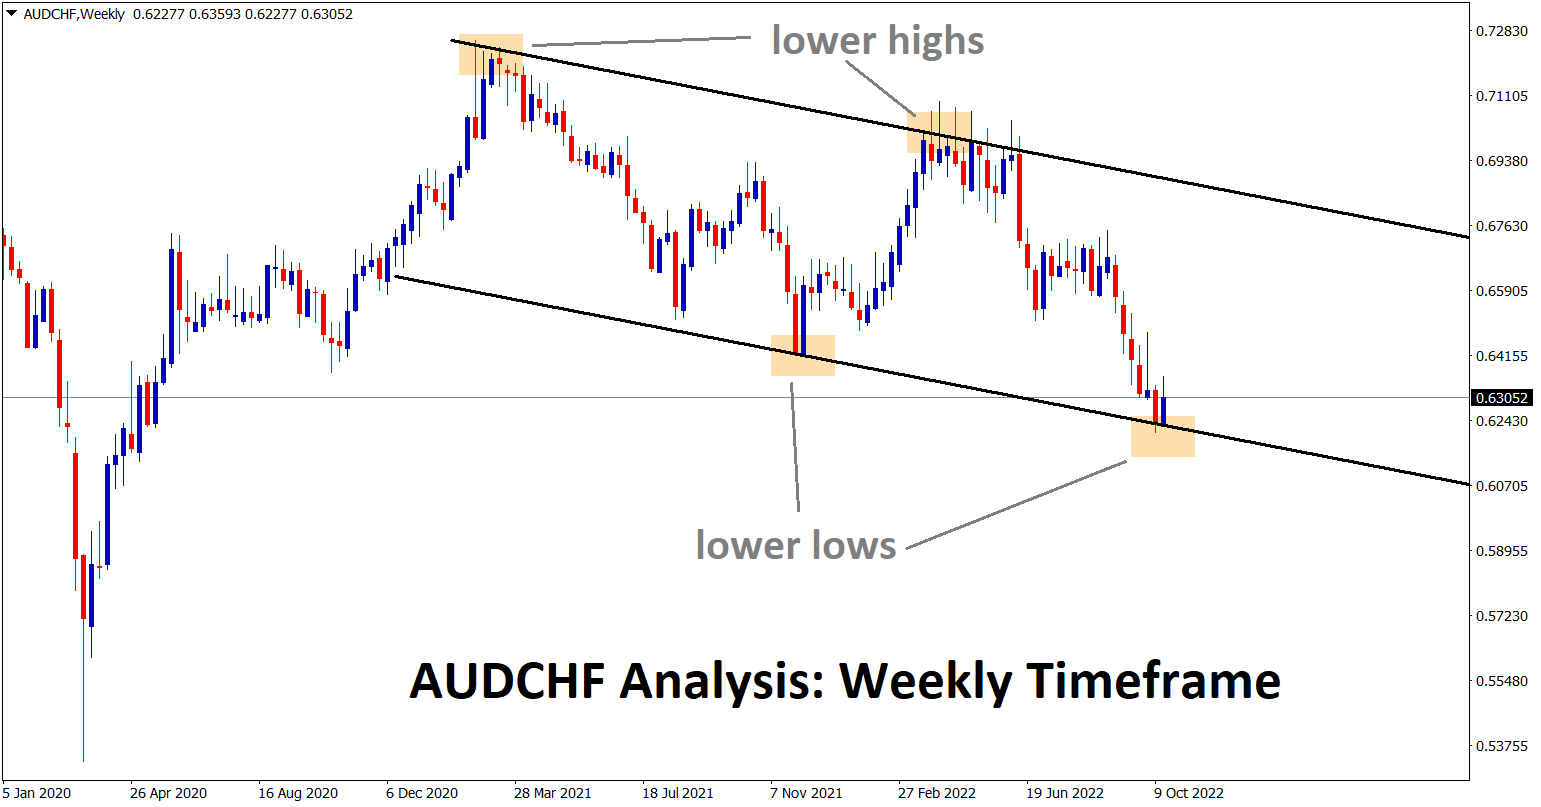
AUDCHF Analysis AUDCHF is rebounding from the lower low area of the descending channel in the weekly timeframe chart. In…
-
USDJPY reached the higher high of the Uptrend line and the round price 150.00 during the attempt to break the high leads to -725 points
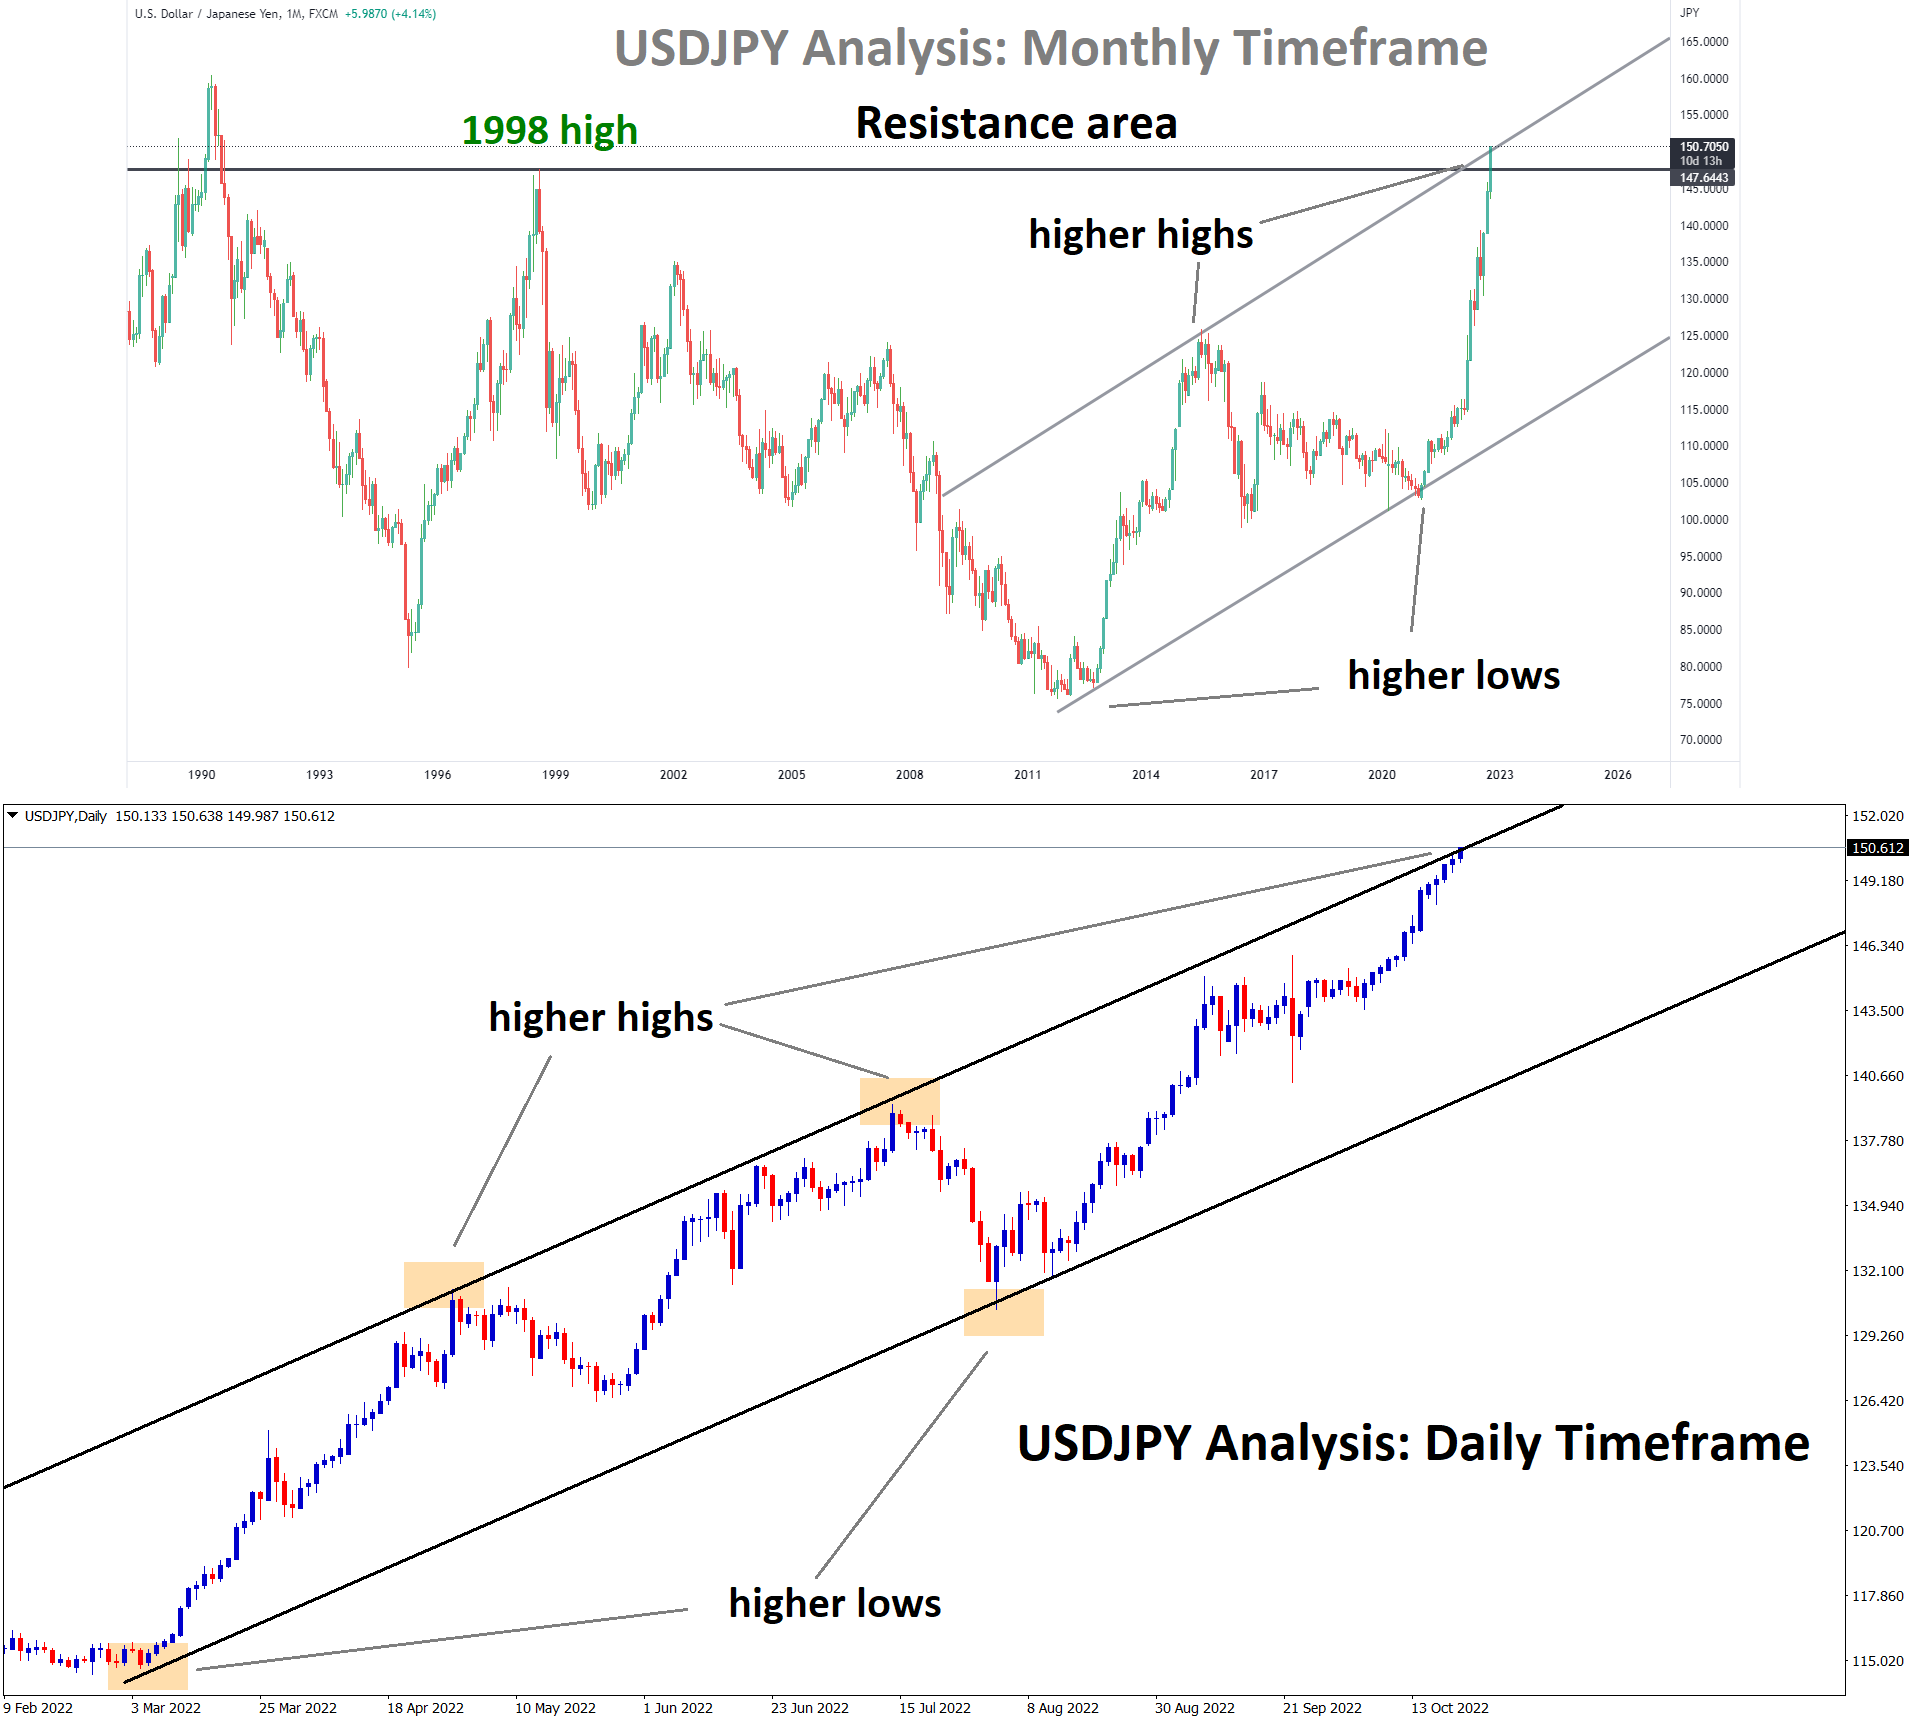
USDJPY Analysis: USDJPY has reached the higher high area of the Uptrend line and the round number 150.00 price area…
-
+750 Points Reached in AUDUSD Buy signal after rebounding from the lower low area
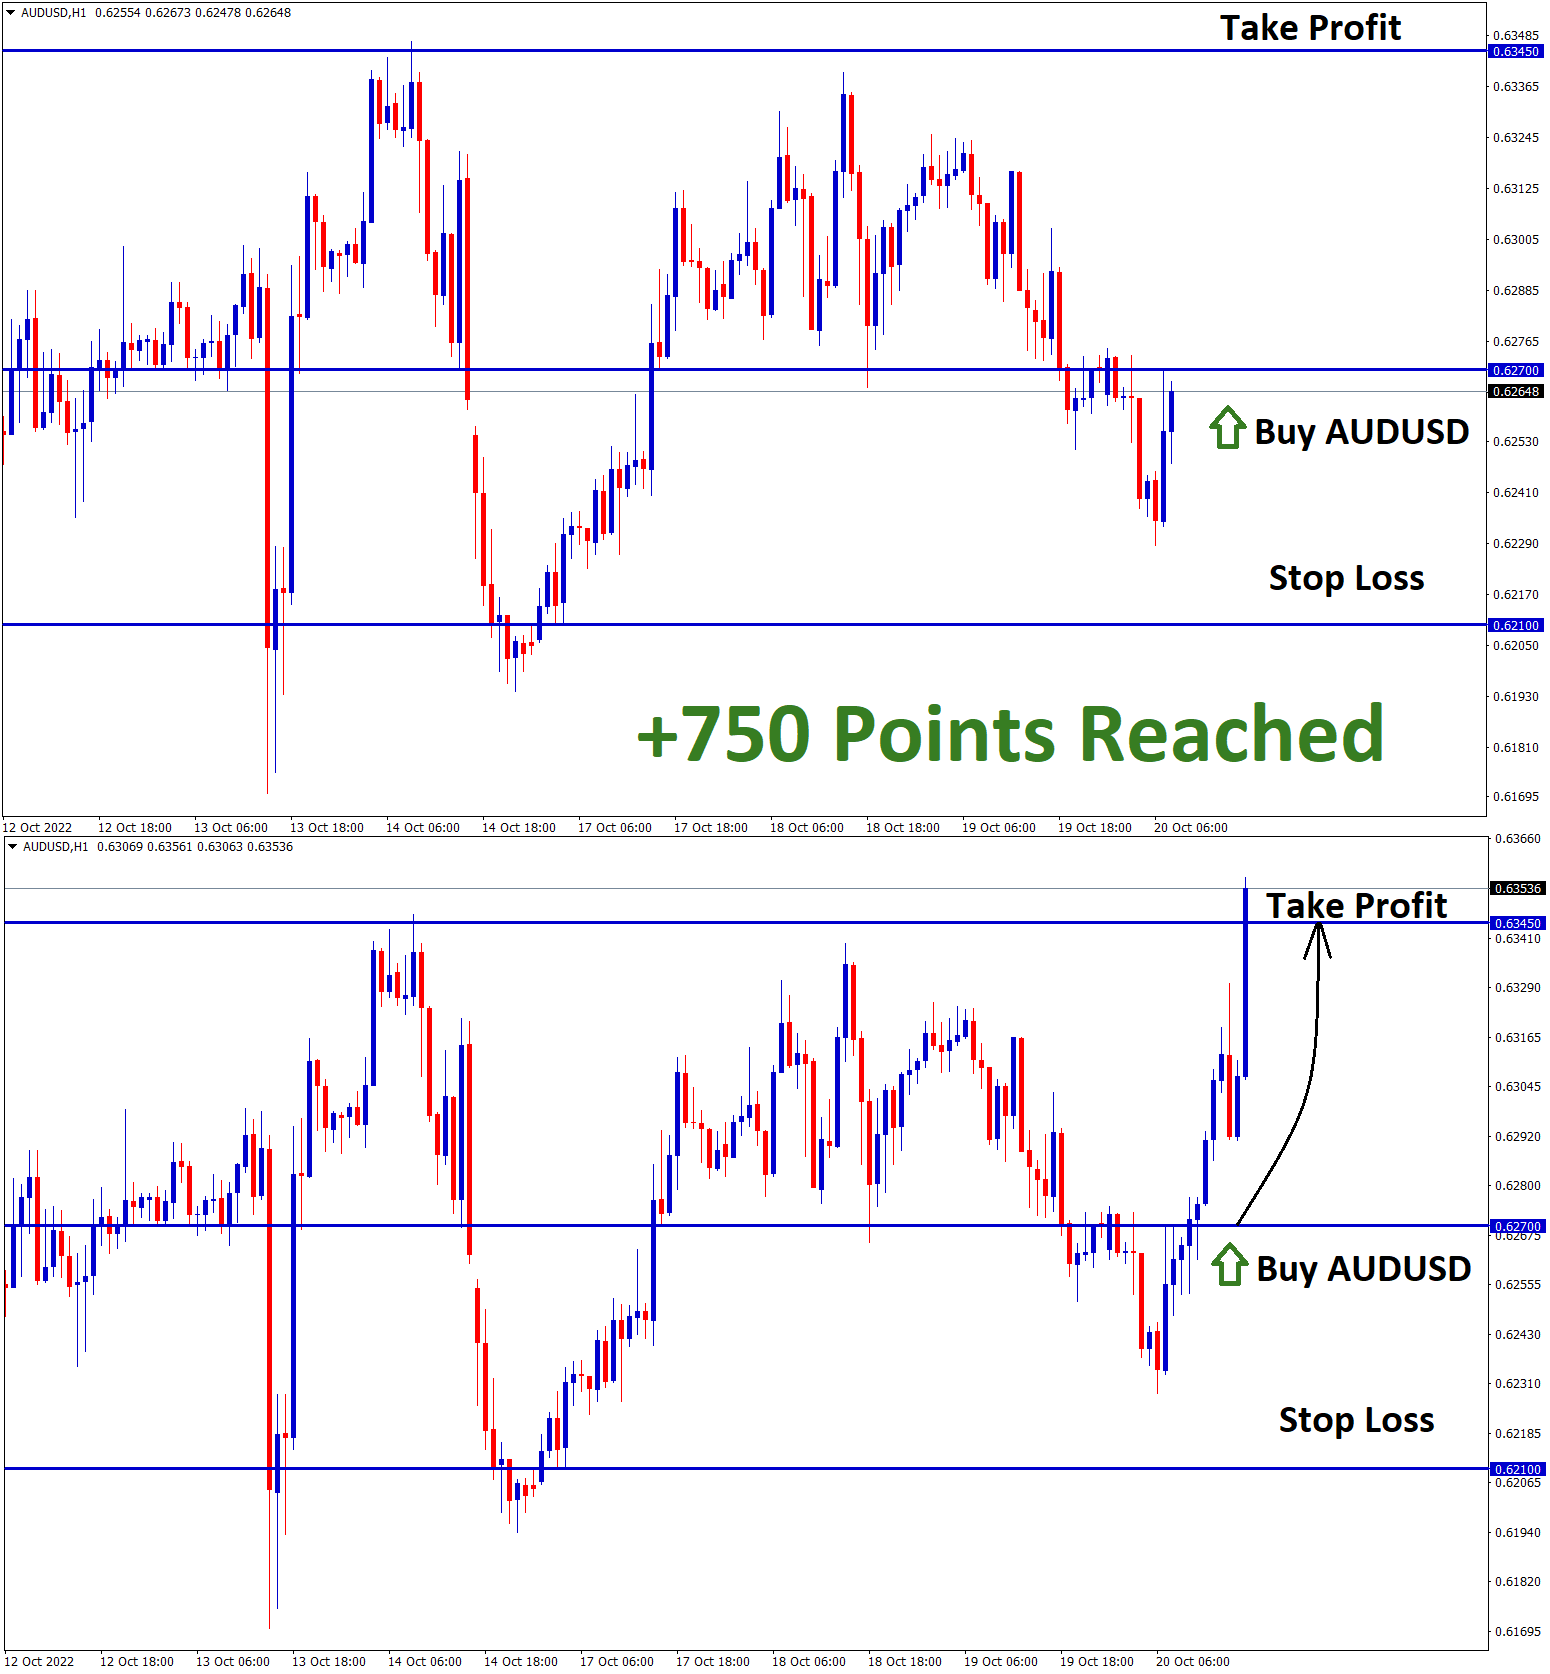
AUDUSD Analysis AUDUSD is rebounding from the lower low area of the descending channel in the daily timeframe chart. After…
-
+1180 Points Reached in EURCAD Buy signal after reached the higher low area of the ascending channel
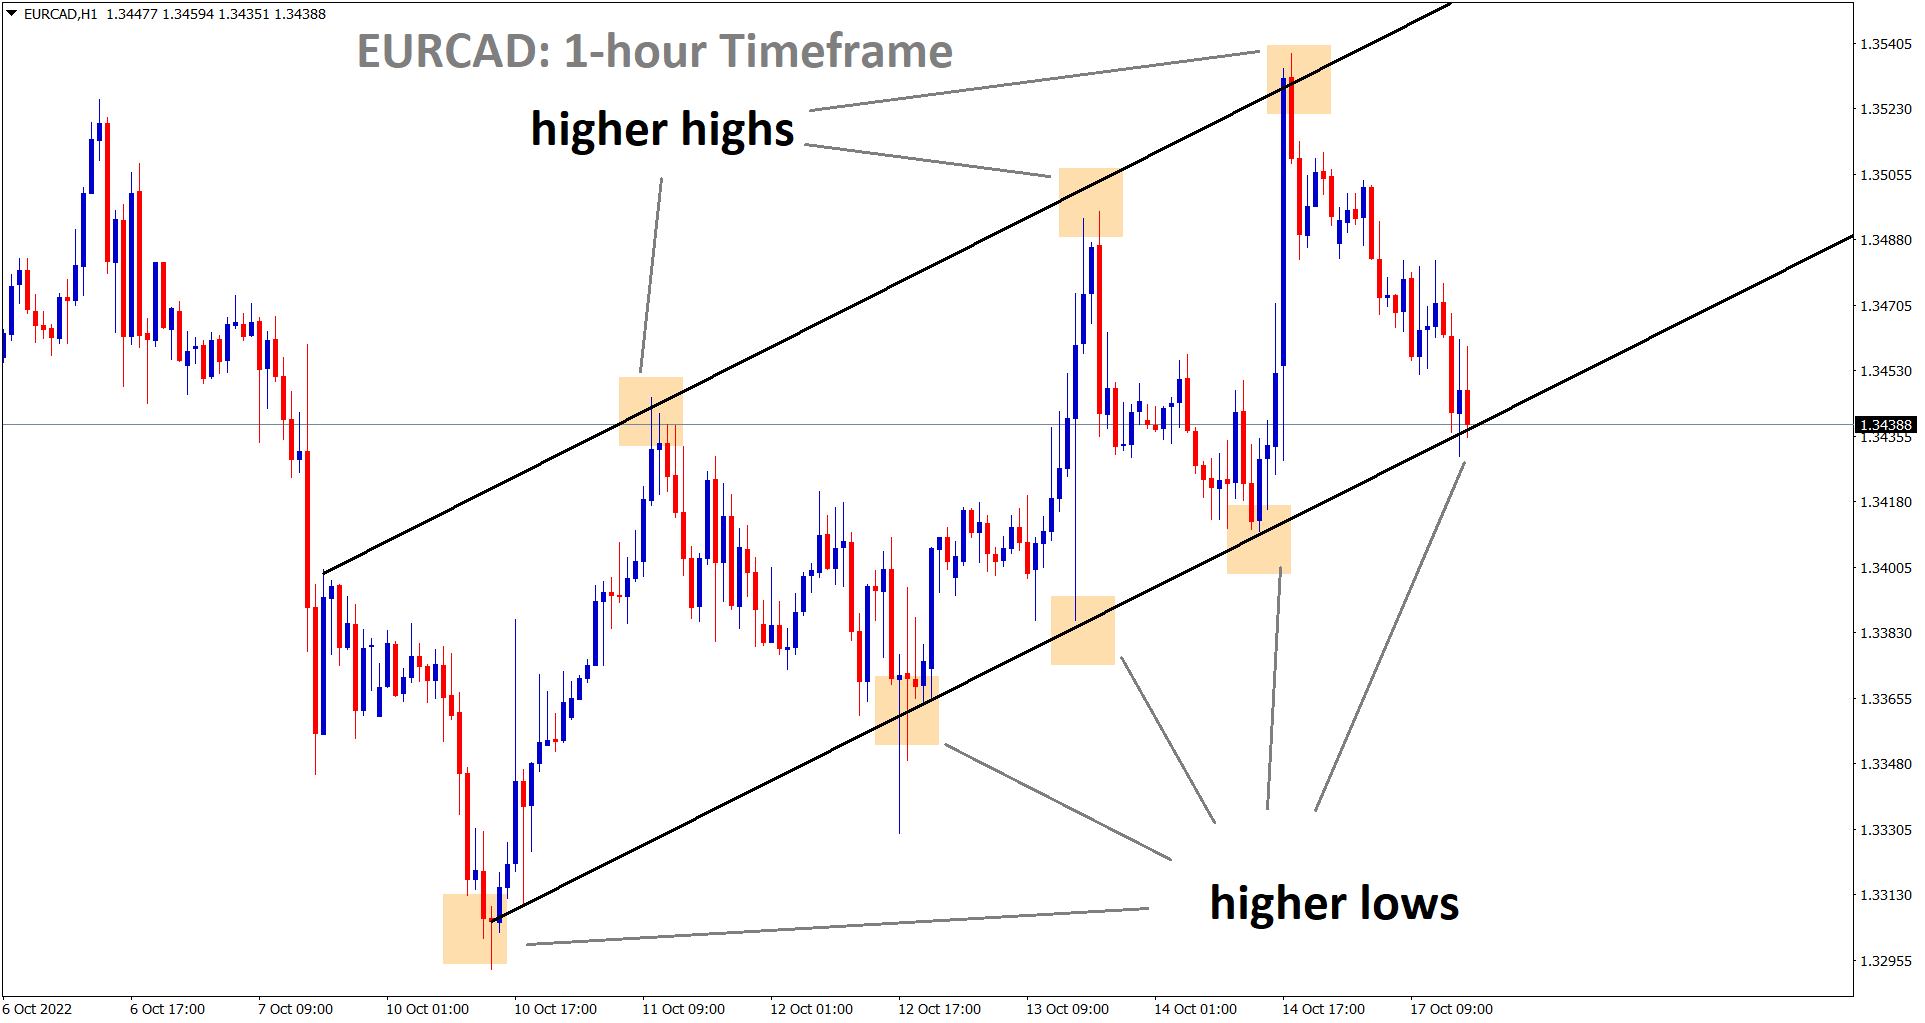
EURCAD Analysis EURCAD reached the higher low area of the ascending channel in the 1-hour timeframe chart. After the confirmation…
-
+560 Points Reached in EURCAD Buy signal after reached the higher low area of the ascending channel

EURCAD Analysis EURCAD reached the higher low area of the ascending channel in the 1-hour timeframe chart. After the confirmation…
-
CADJPY reached the higher low area of the ascending channel and the US CPI economic data came positive which leads to -650 points
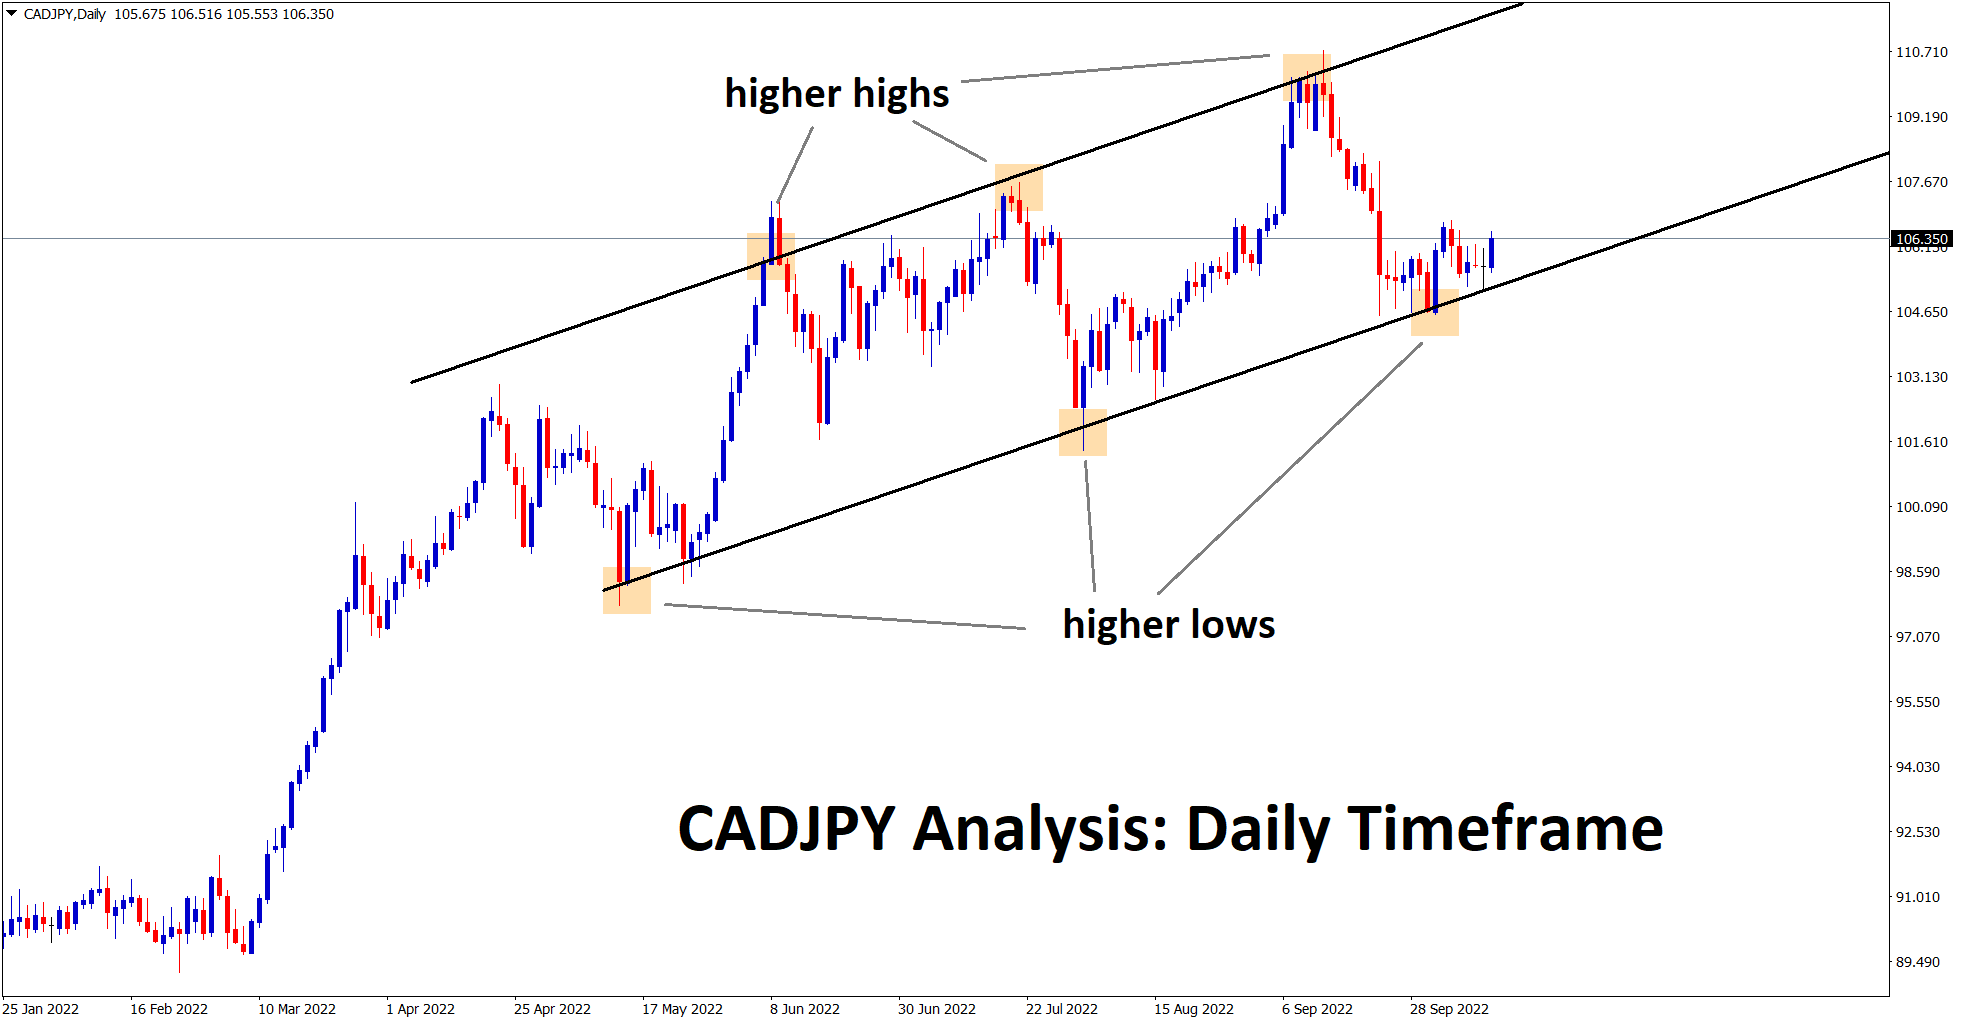
CADJPY Analysis CADJPY is rebounding from the higher low area of the ascending channel in the higher timeframe daily chart.…
-
+460 Points Reached in AUDUSD Buy signal after rebounding from the lower low area in the higher timeframe
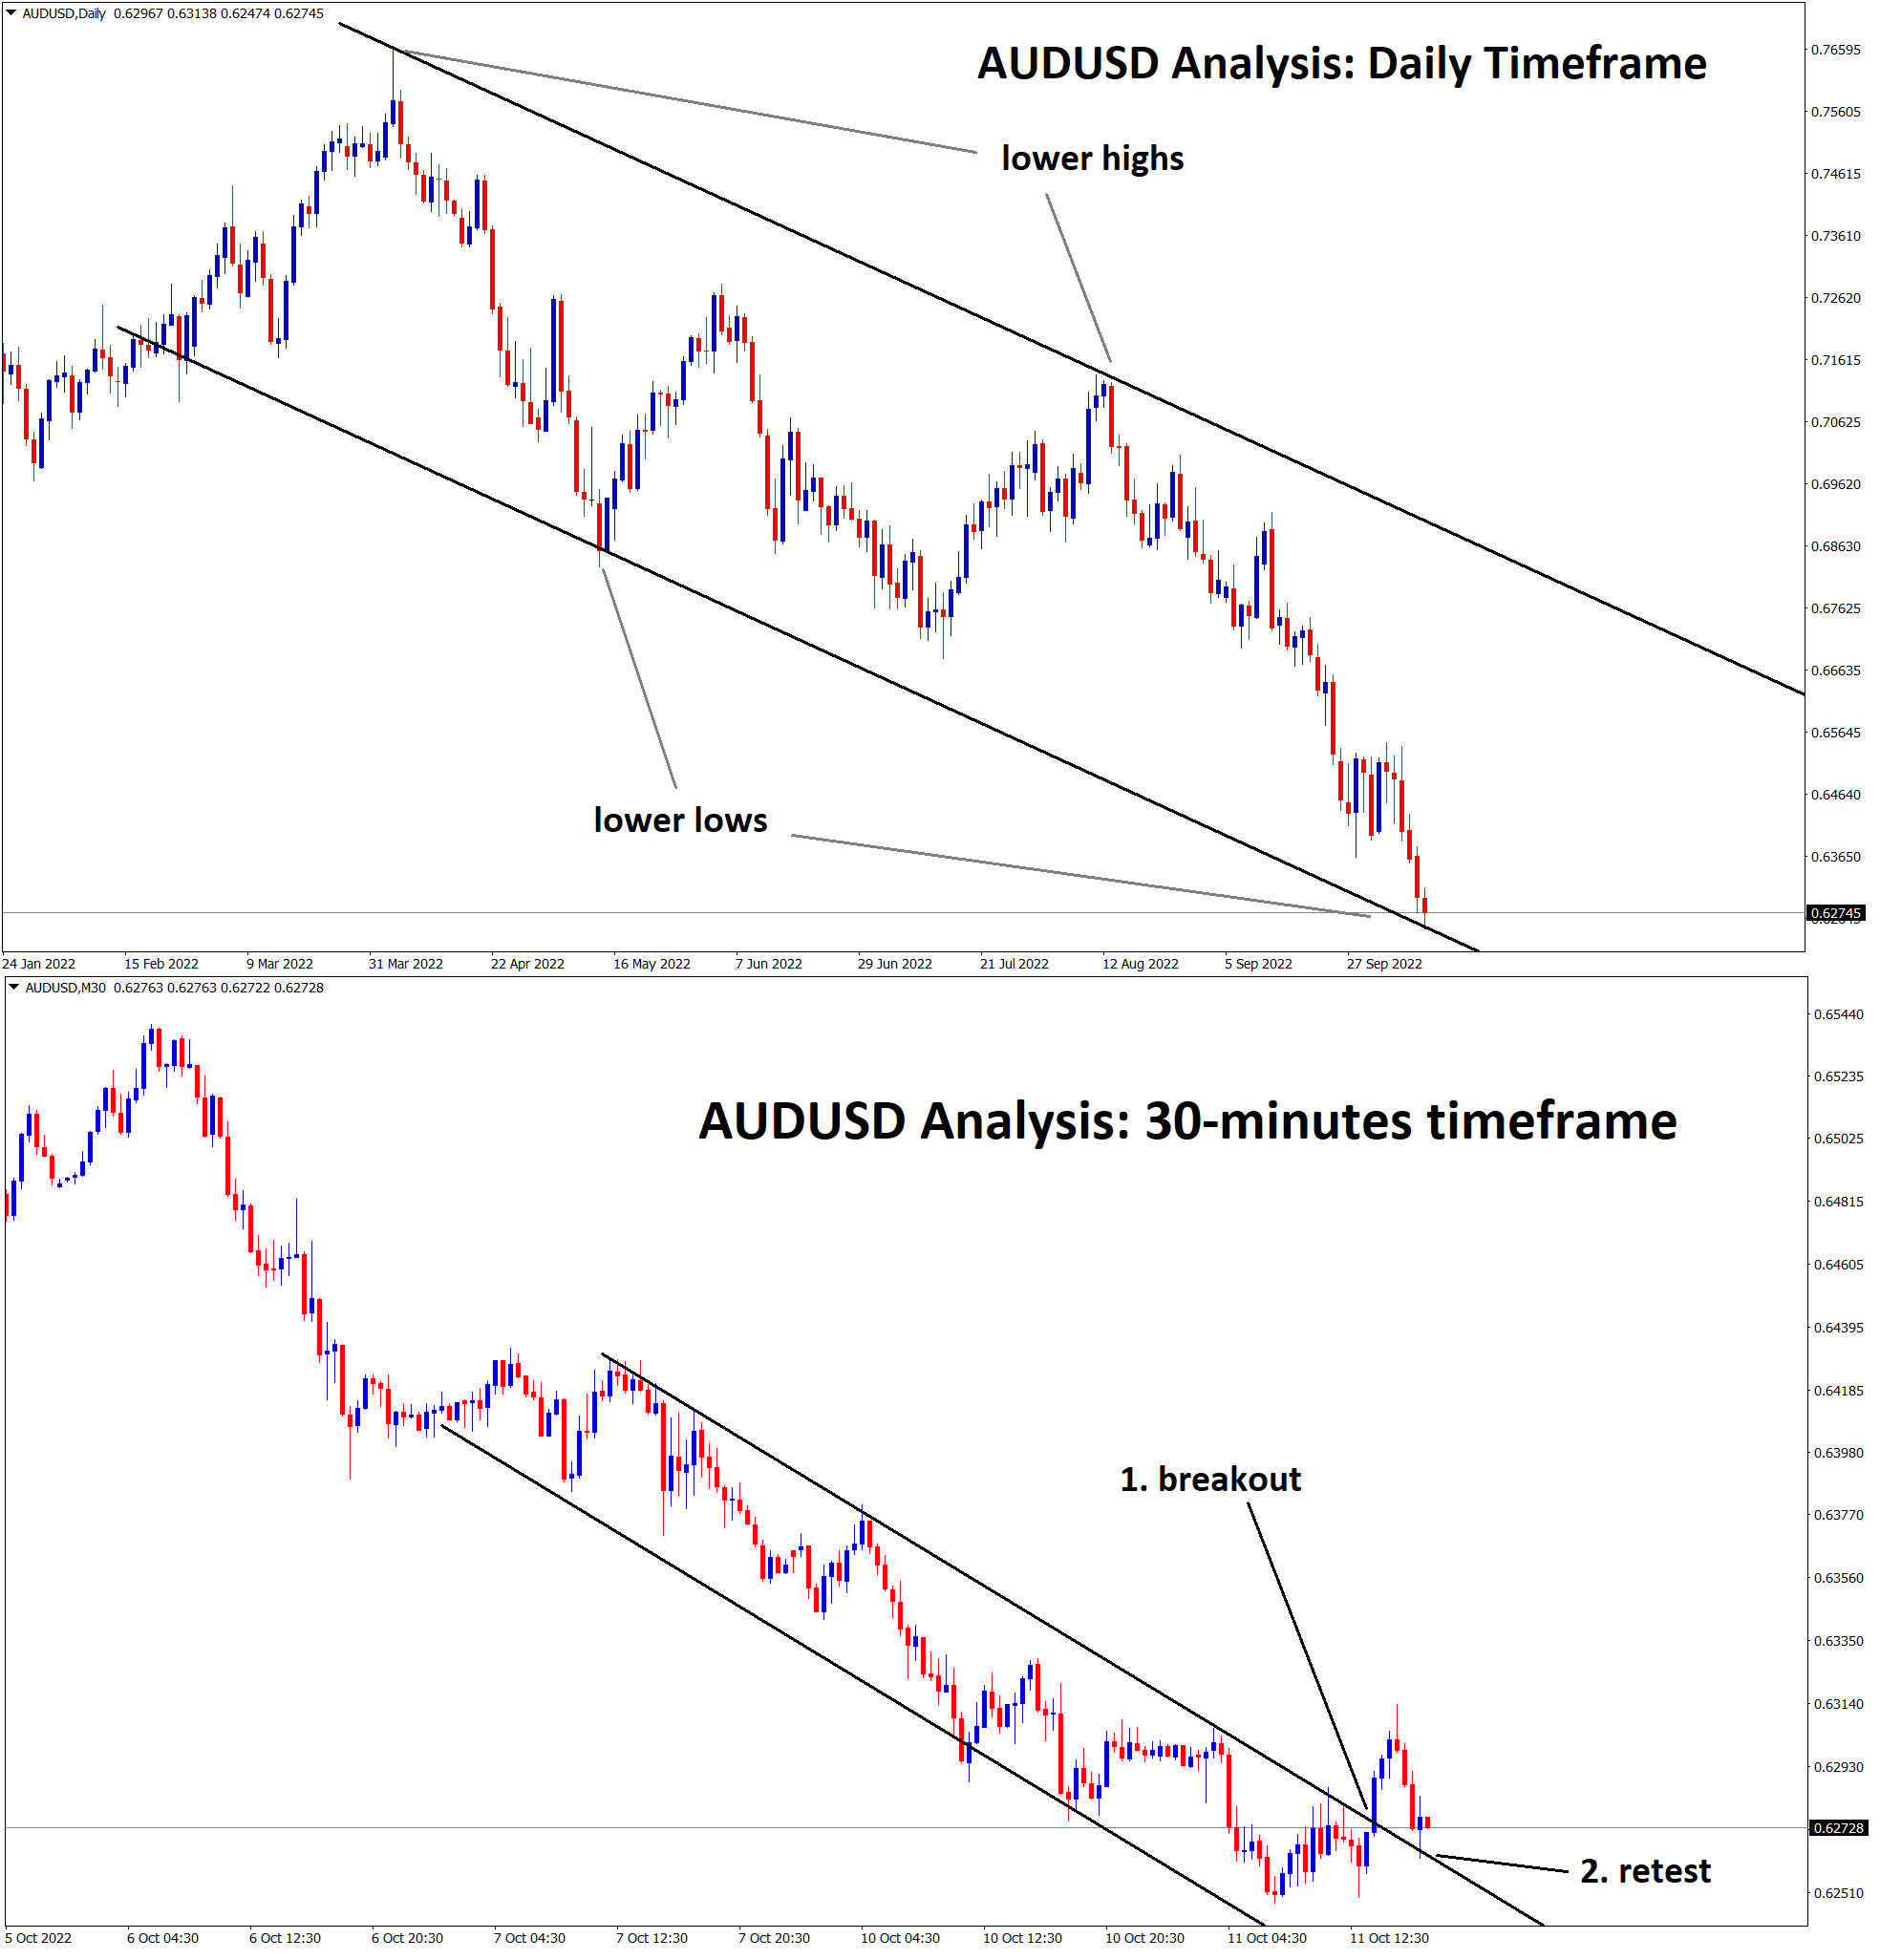
AUDUSD Analysis AUDUSD is rebounding from the lower low area in the higher timeframe daily chart. In the smaller timeframe…
-
+570 Points Reached in EURCAD Buy signal after reached the support and the low area
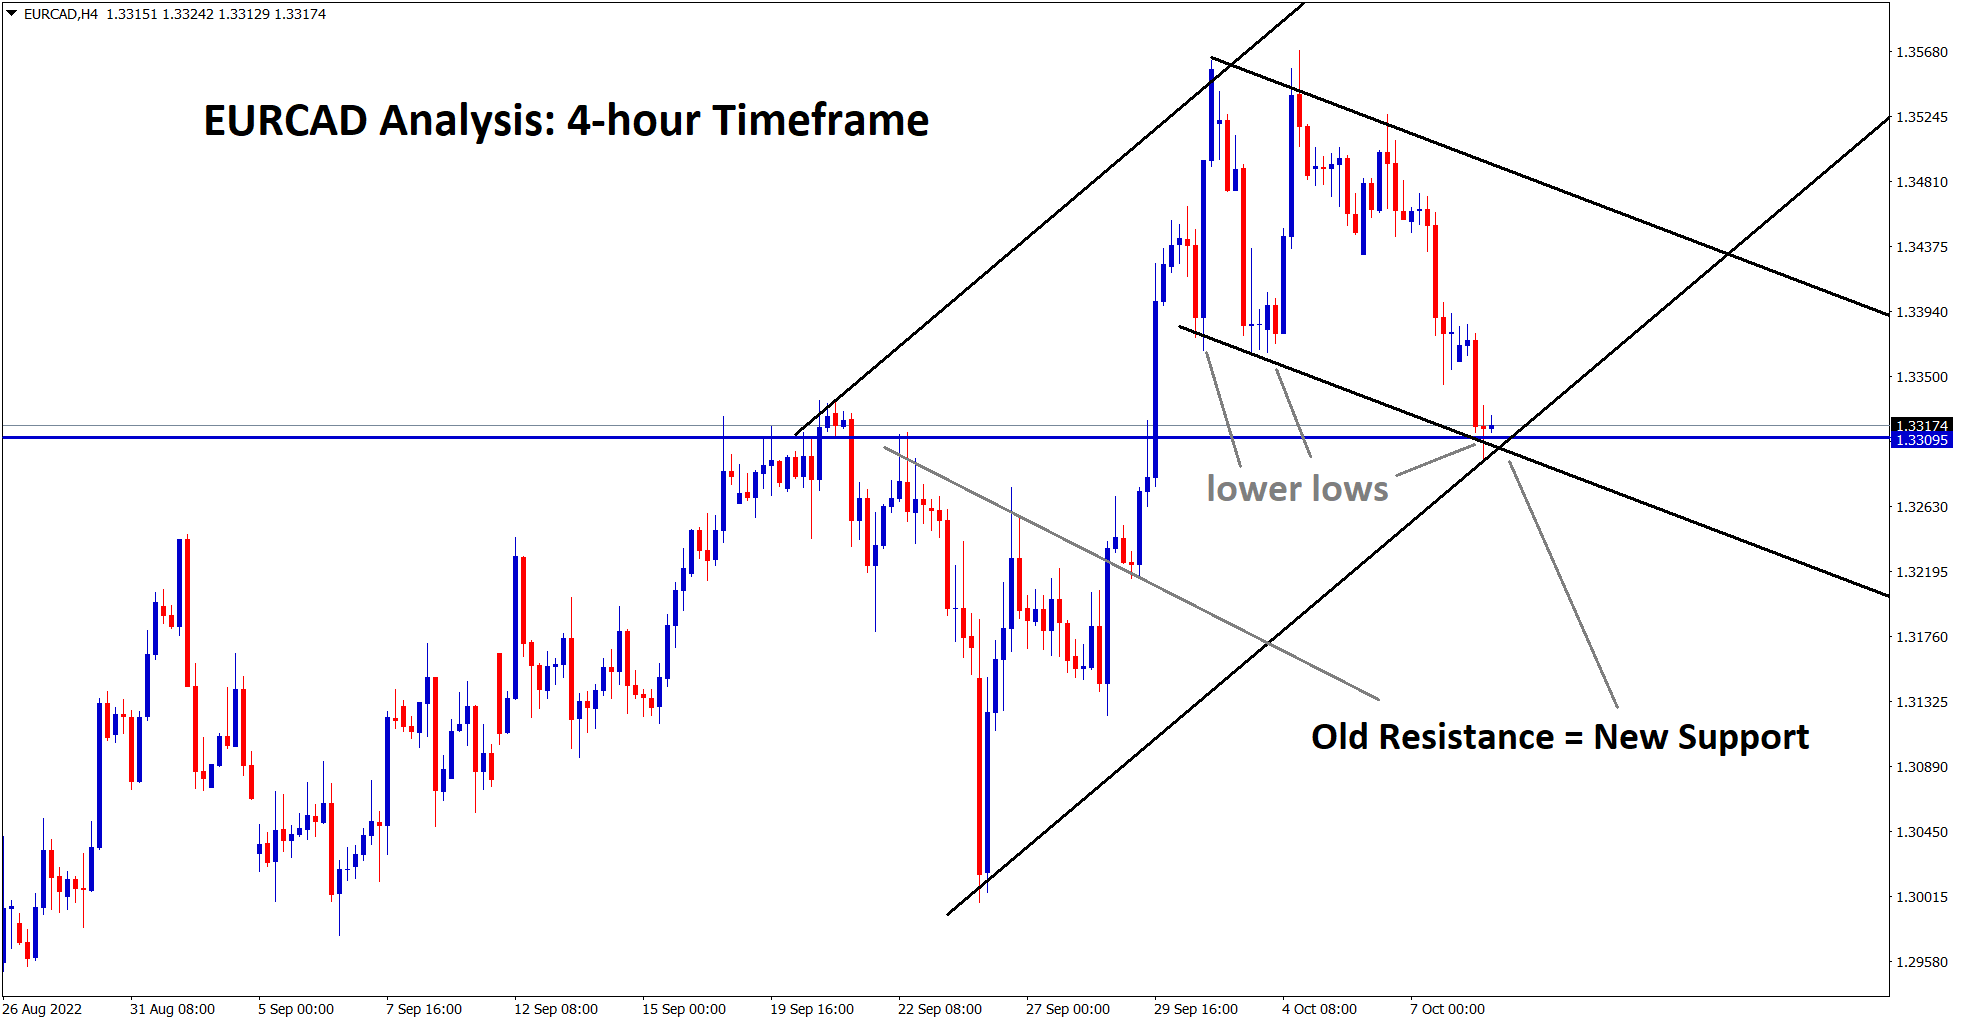
EURCAD Analysis: EURCAD reached the support and the low area in the 4-hour timeframe chart. After the confirmation of the…
-
+450 Points Reached in EURGBP Buy signal after rebounding from the retest area of the previous broken Ascending Triangle
EURGBP Analysis: EURGBP is rebounding from the retest area of the previous broken Ascending Triangle in the daily timeframe chart.…
-
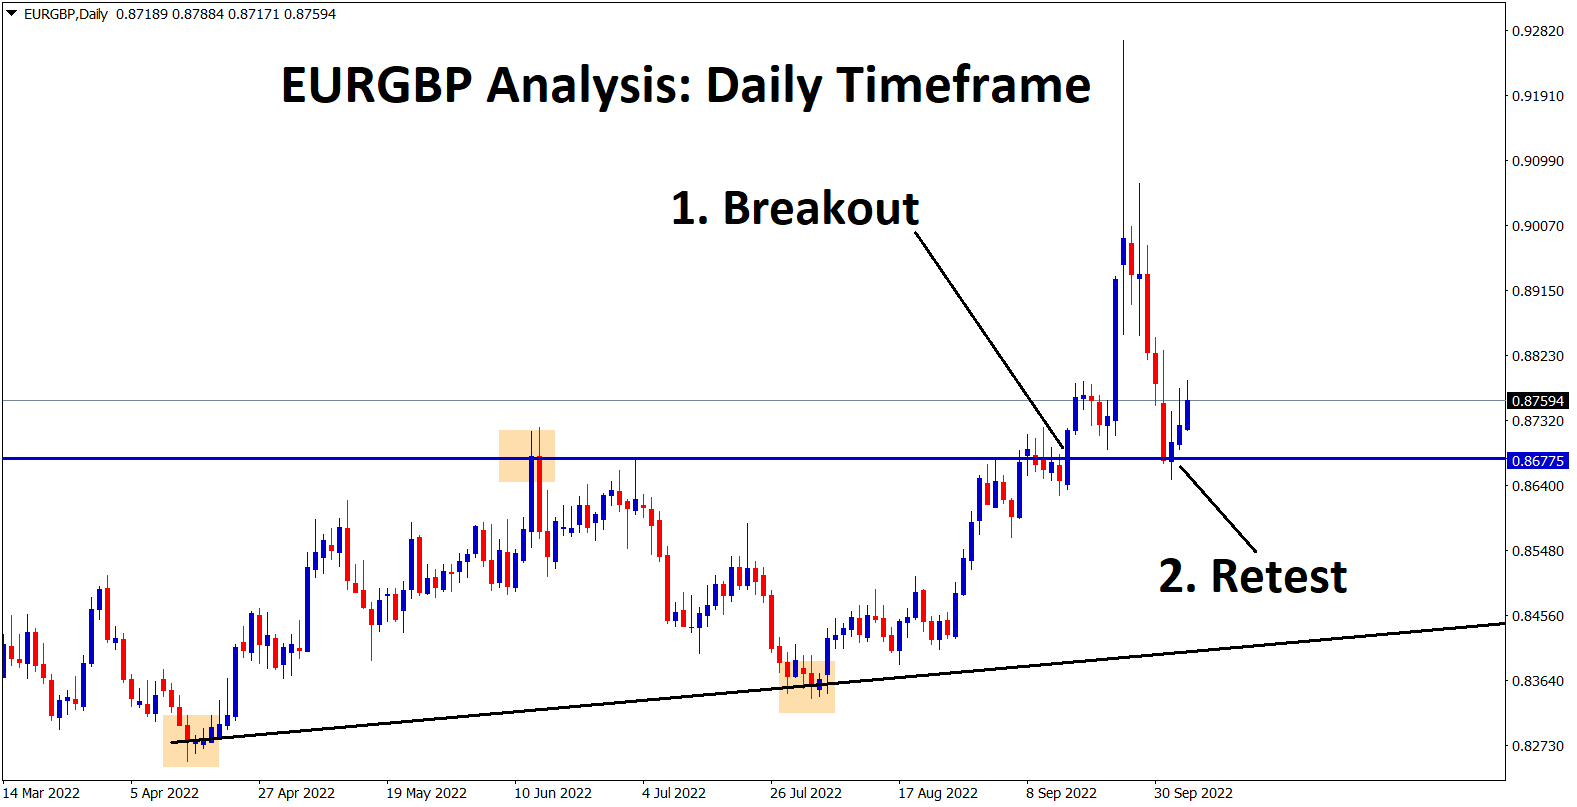
+1400 Points Reached in EURGBP Buy signal after retesting the previous broken Ascending channel
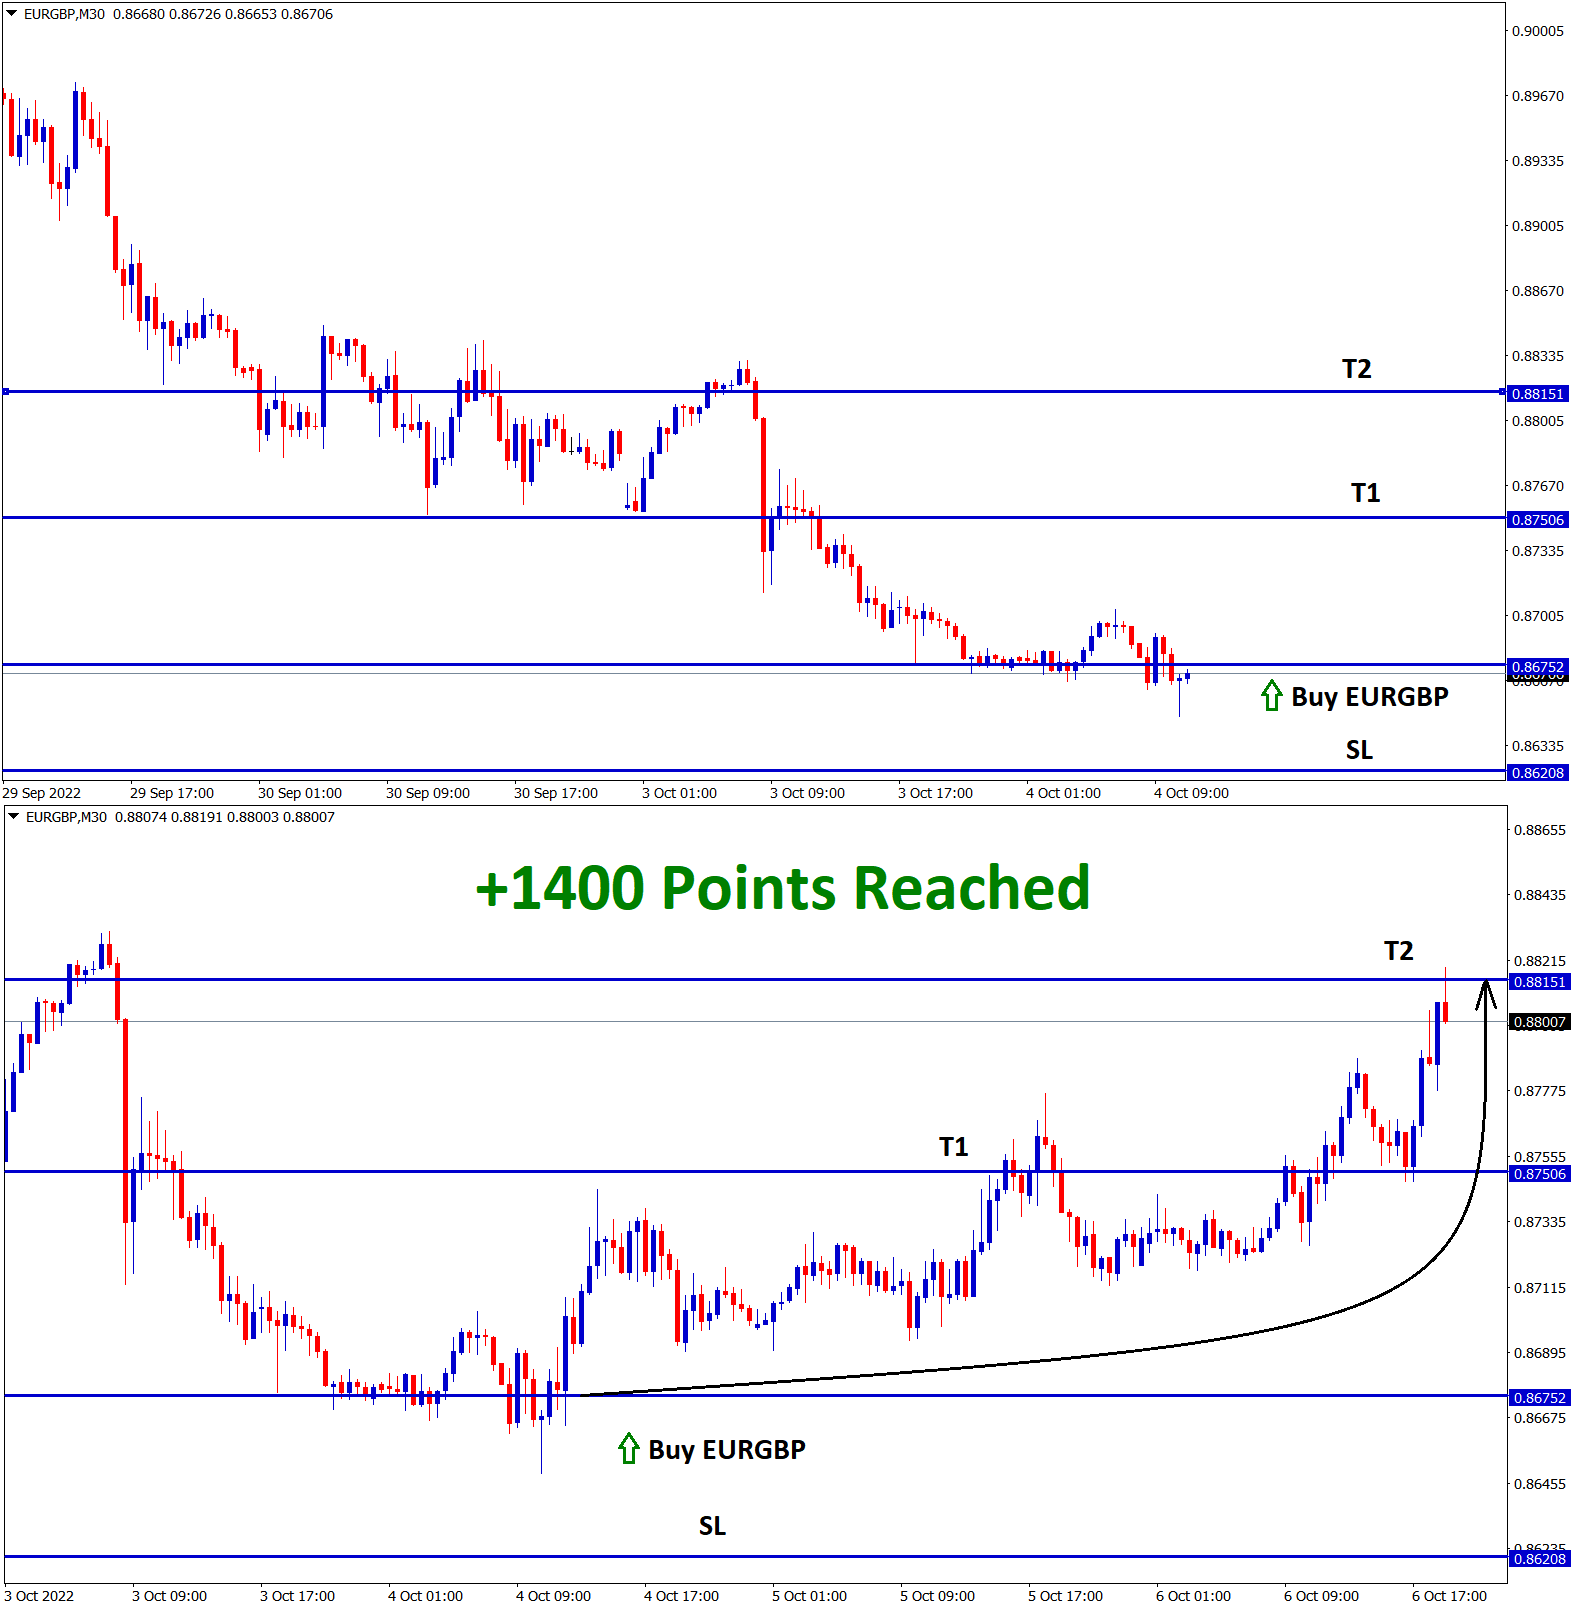
EURGBP Analysis: EURGBP is retesting the previous broken Ascending channel in the daily timeframe chart. After the confirmation of the…
-
+520 Points Reached in AUDCHF Buy signal after reached the support area
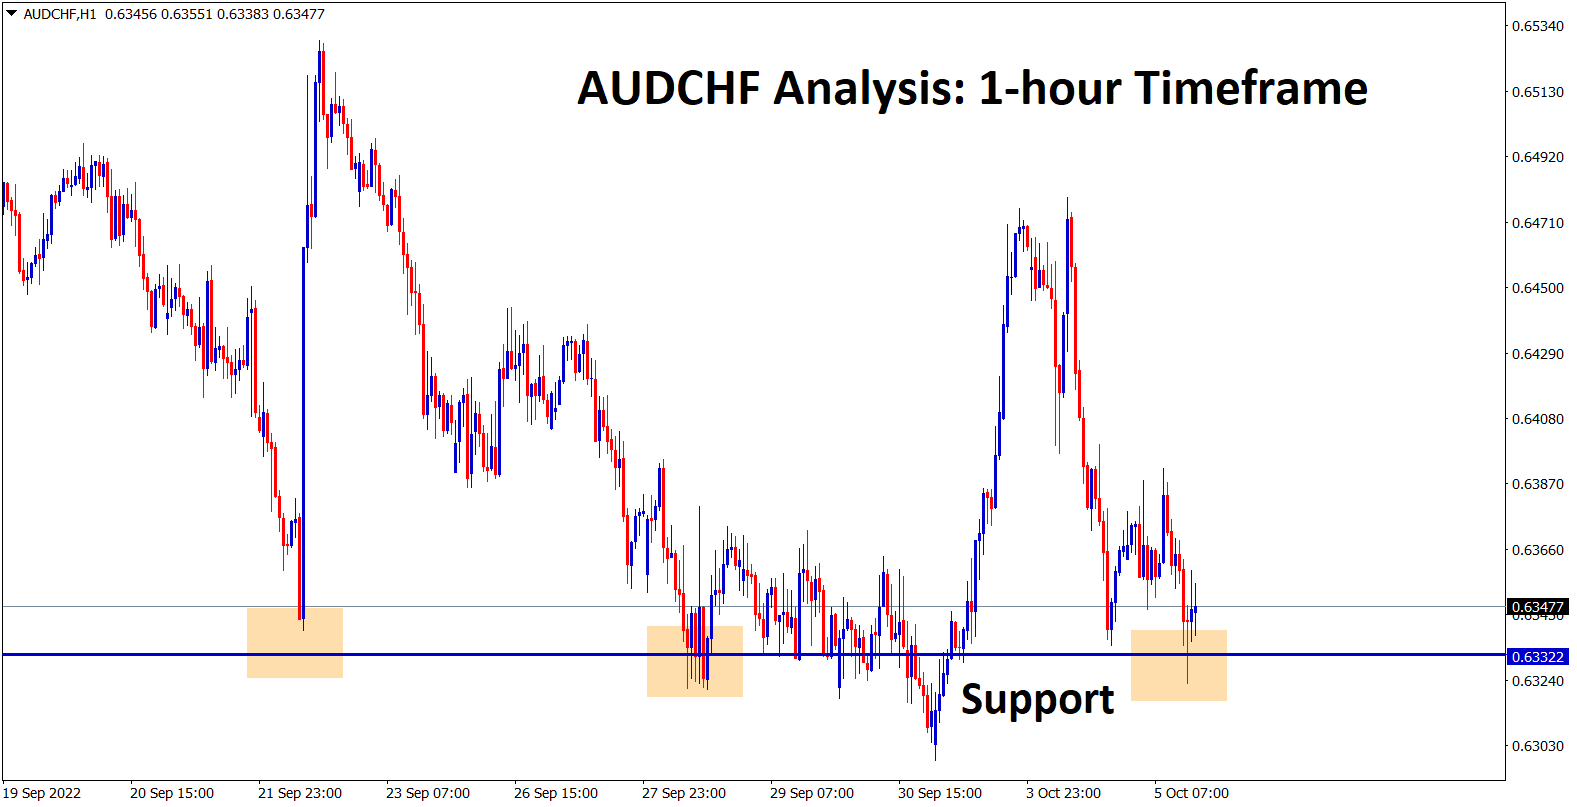
AUDCHF Analysis: AUDCHF reached the support area in the 1-hour timeframe chart. After the confirmation of the Upward movement, the…
-
+750 Points Reached in EURGBP Buy signal after retesting the previous broken Ascending channel
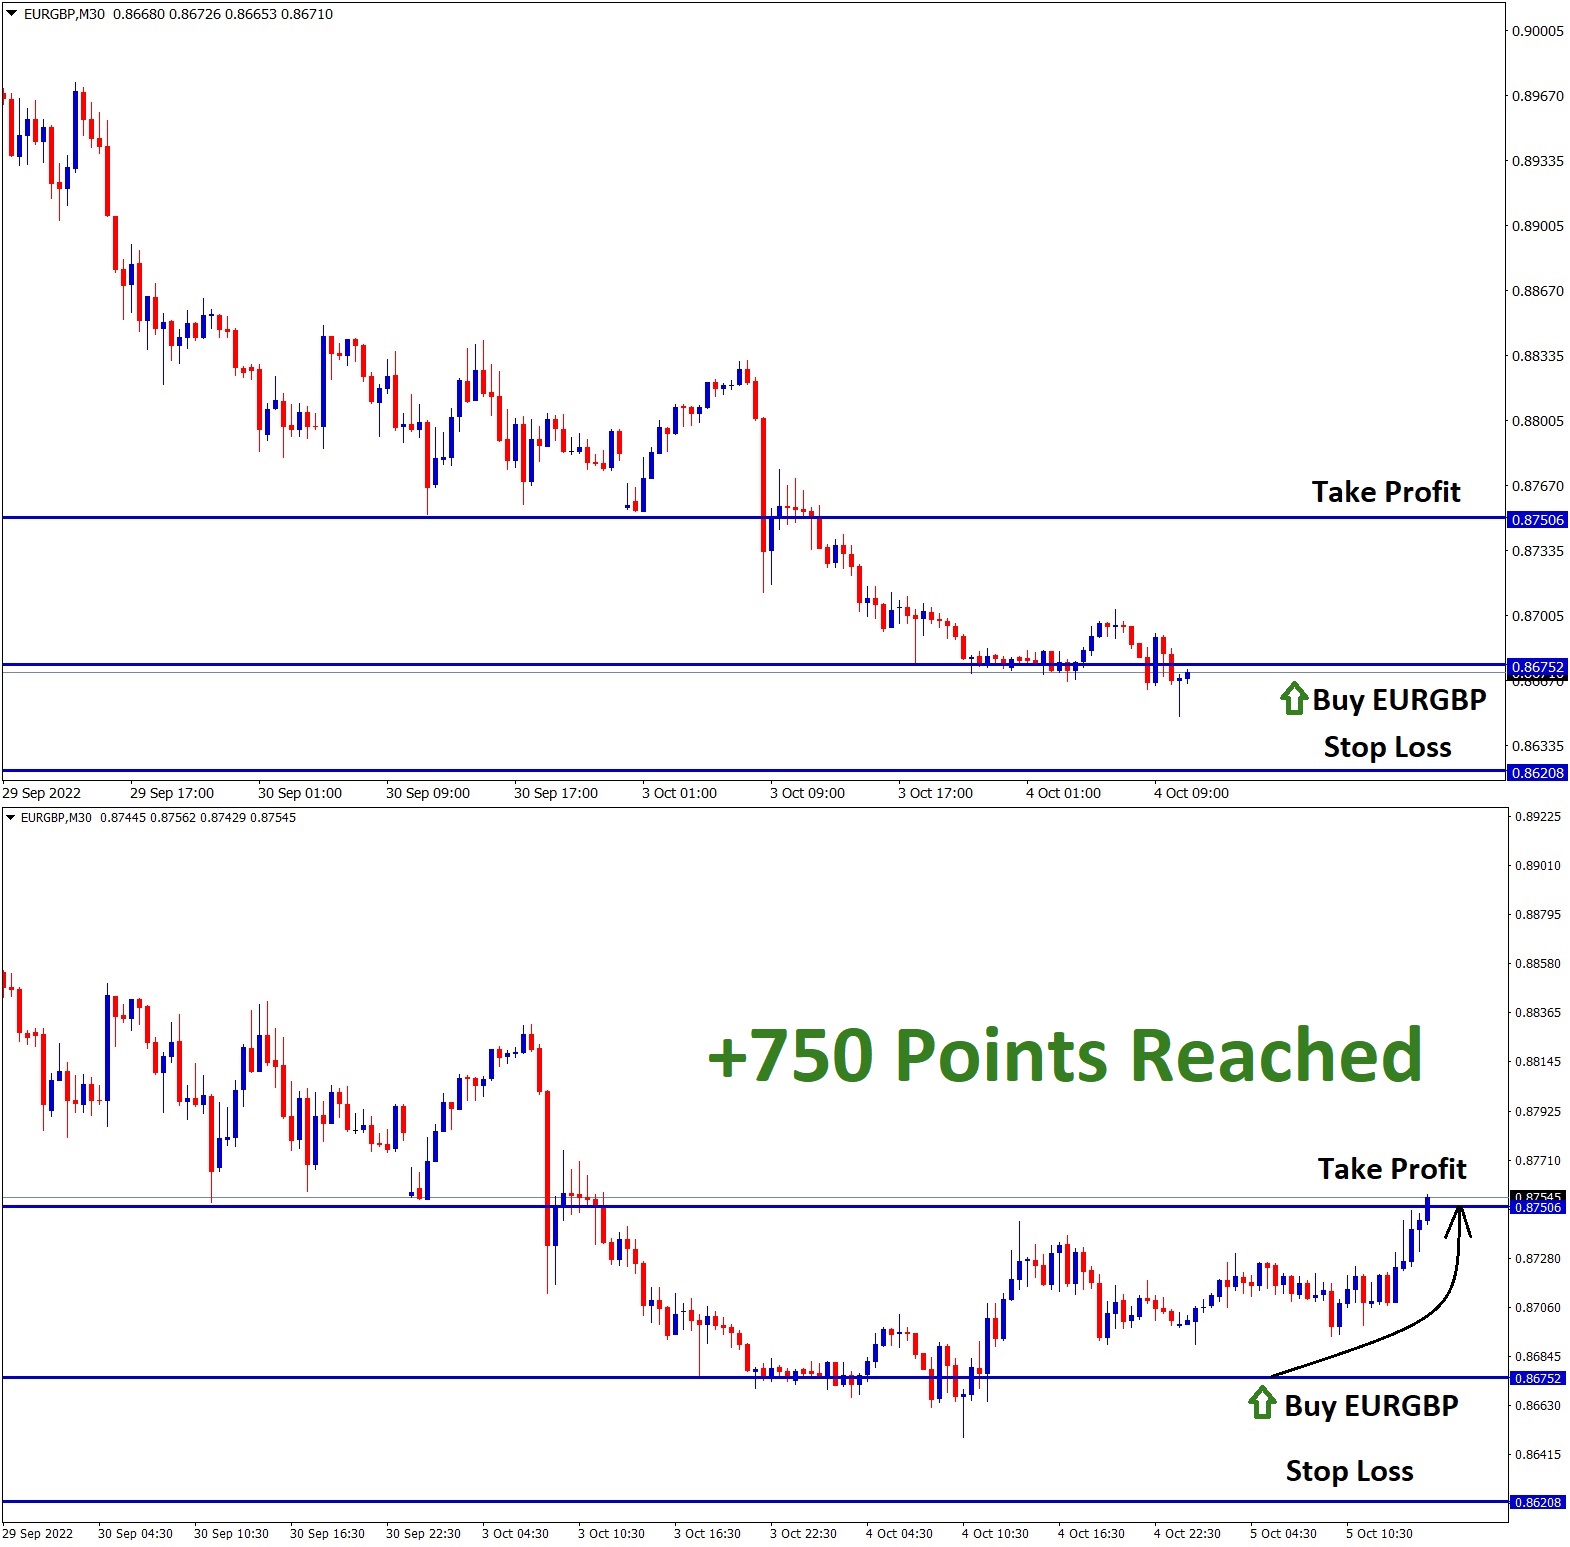
EURGBP Analysis: EURGBP is retesting the previous broken Ascending channel in the daily timeframe chart. After the confirmation of the…