Forex Signal Results
Check Full Forex Market Signals with Technical Analysis Chart
Please note : It is better to do nothing instead of taking wrong trades, we focus on providing you the forex signals only at good trade setup. Each trade signal given to you with fundamental and technical analysis chart which helps you to understand why our analyst team has given the Buy signals and Sell Signals. Now, you can trade with confident using our service. Sounds good? Let's look out all our signal charts below. If you want to test our forex signals, Try free plan (or) if you need more important forex signals, Join here for Premium or Supreme planCheck some of our Subscriber's Myfxbook Live Real Trading results - Click here to see Live Real USD Trading Accounts Try our free service now, let the results speak the rest.
-
NZDUSD Buy signal closed at entry after retested the descending channel
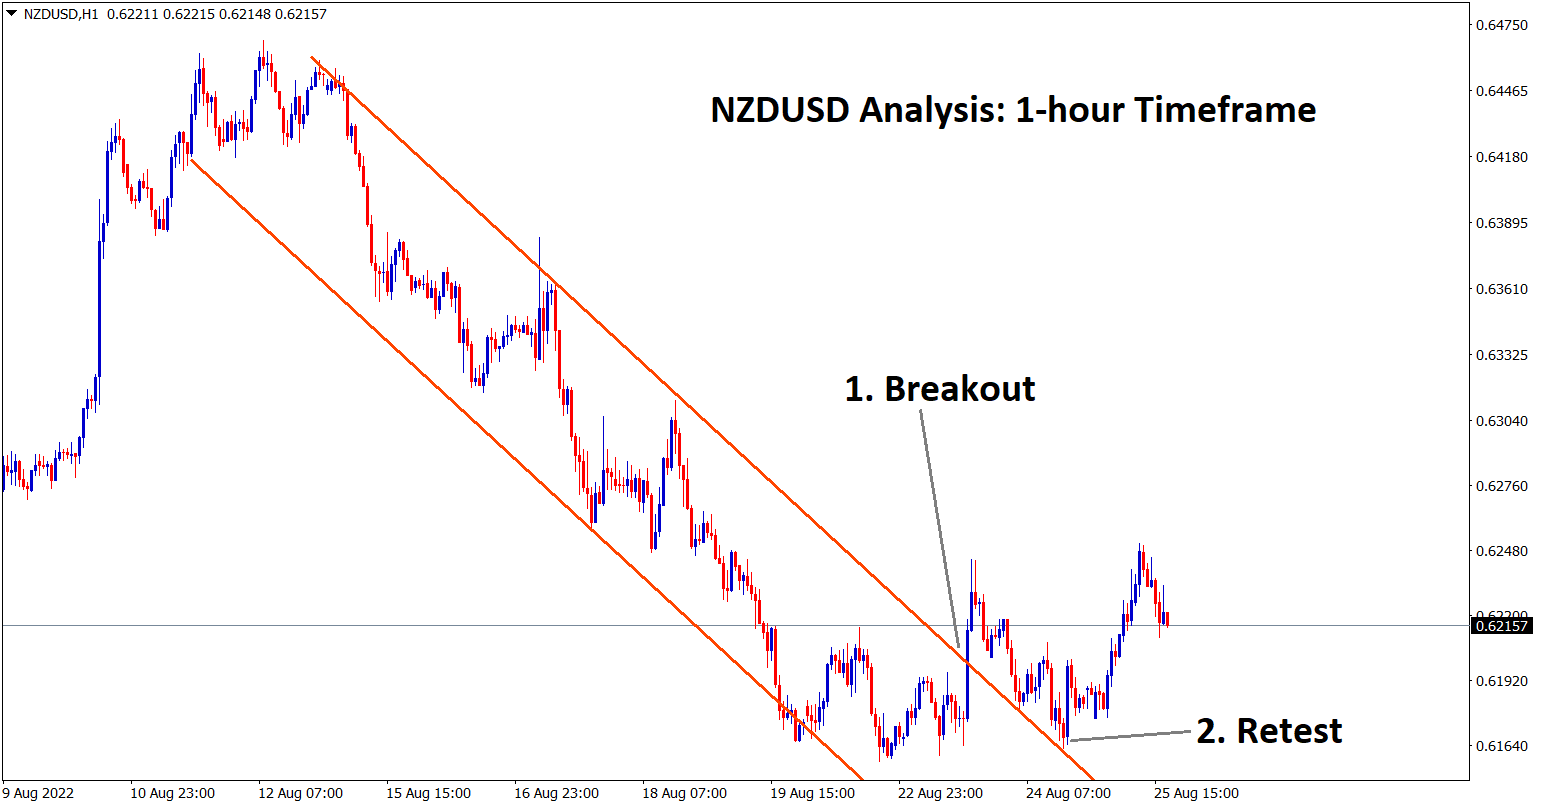
NZDUSD Analysis: NZDUSD has broken and retested the descending channel in the 1-hour timeframe chart. After the confirmation of the…
-
+860 Points reached in AUDCHF Buy signal after rebounding from the support area
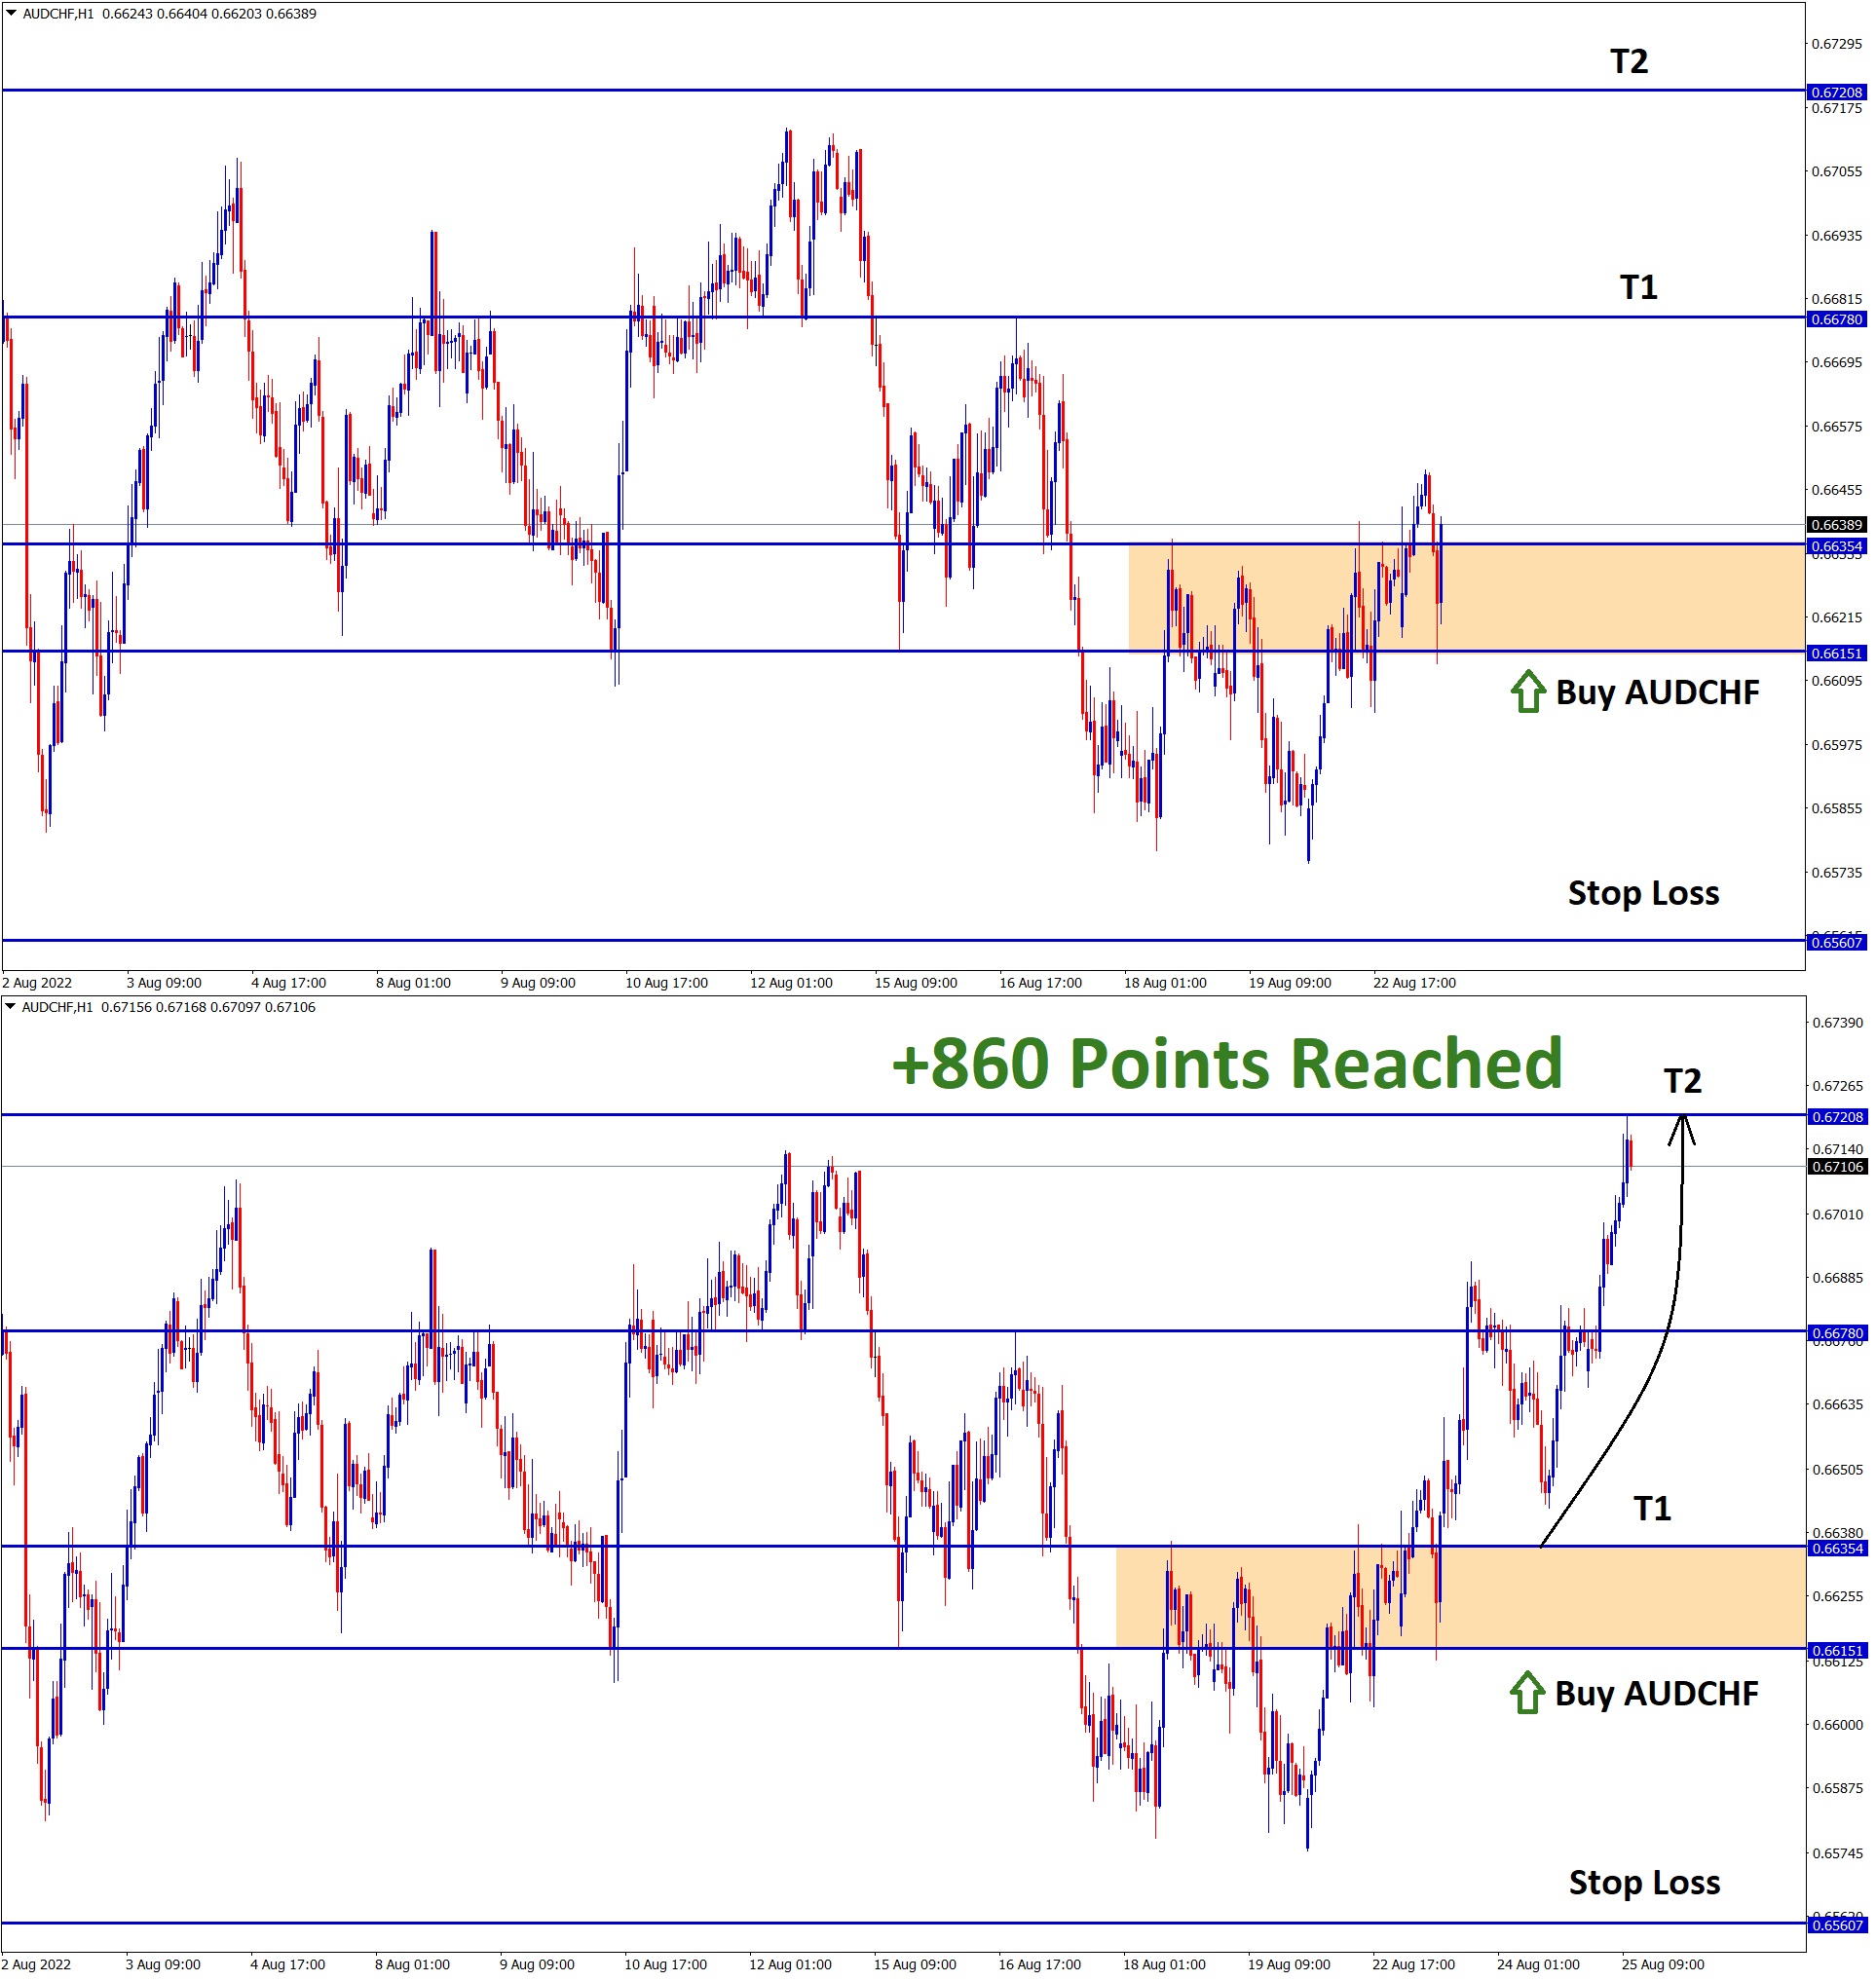
AUDCHF Analysis: AUDCHF has broken the minor descending channel after rebounding from the support area in the 4-hour timeframe. In…
-
+700 Points Reached in USDJPY Sell signal after reaching the higher area of the channel
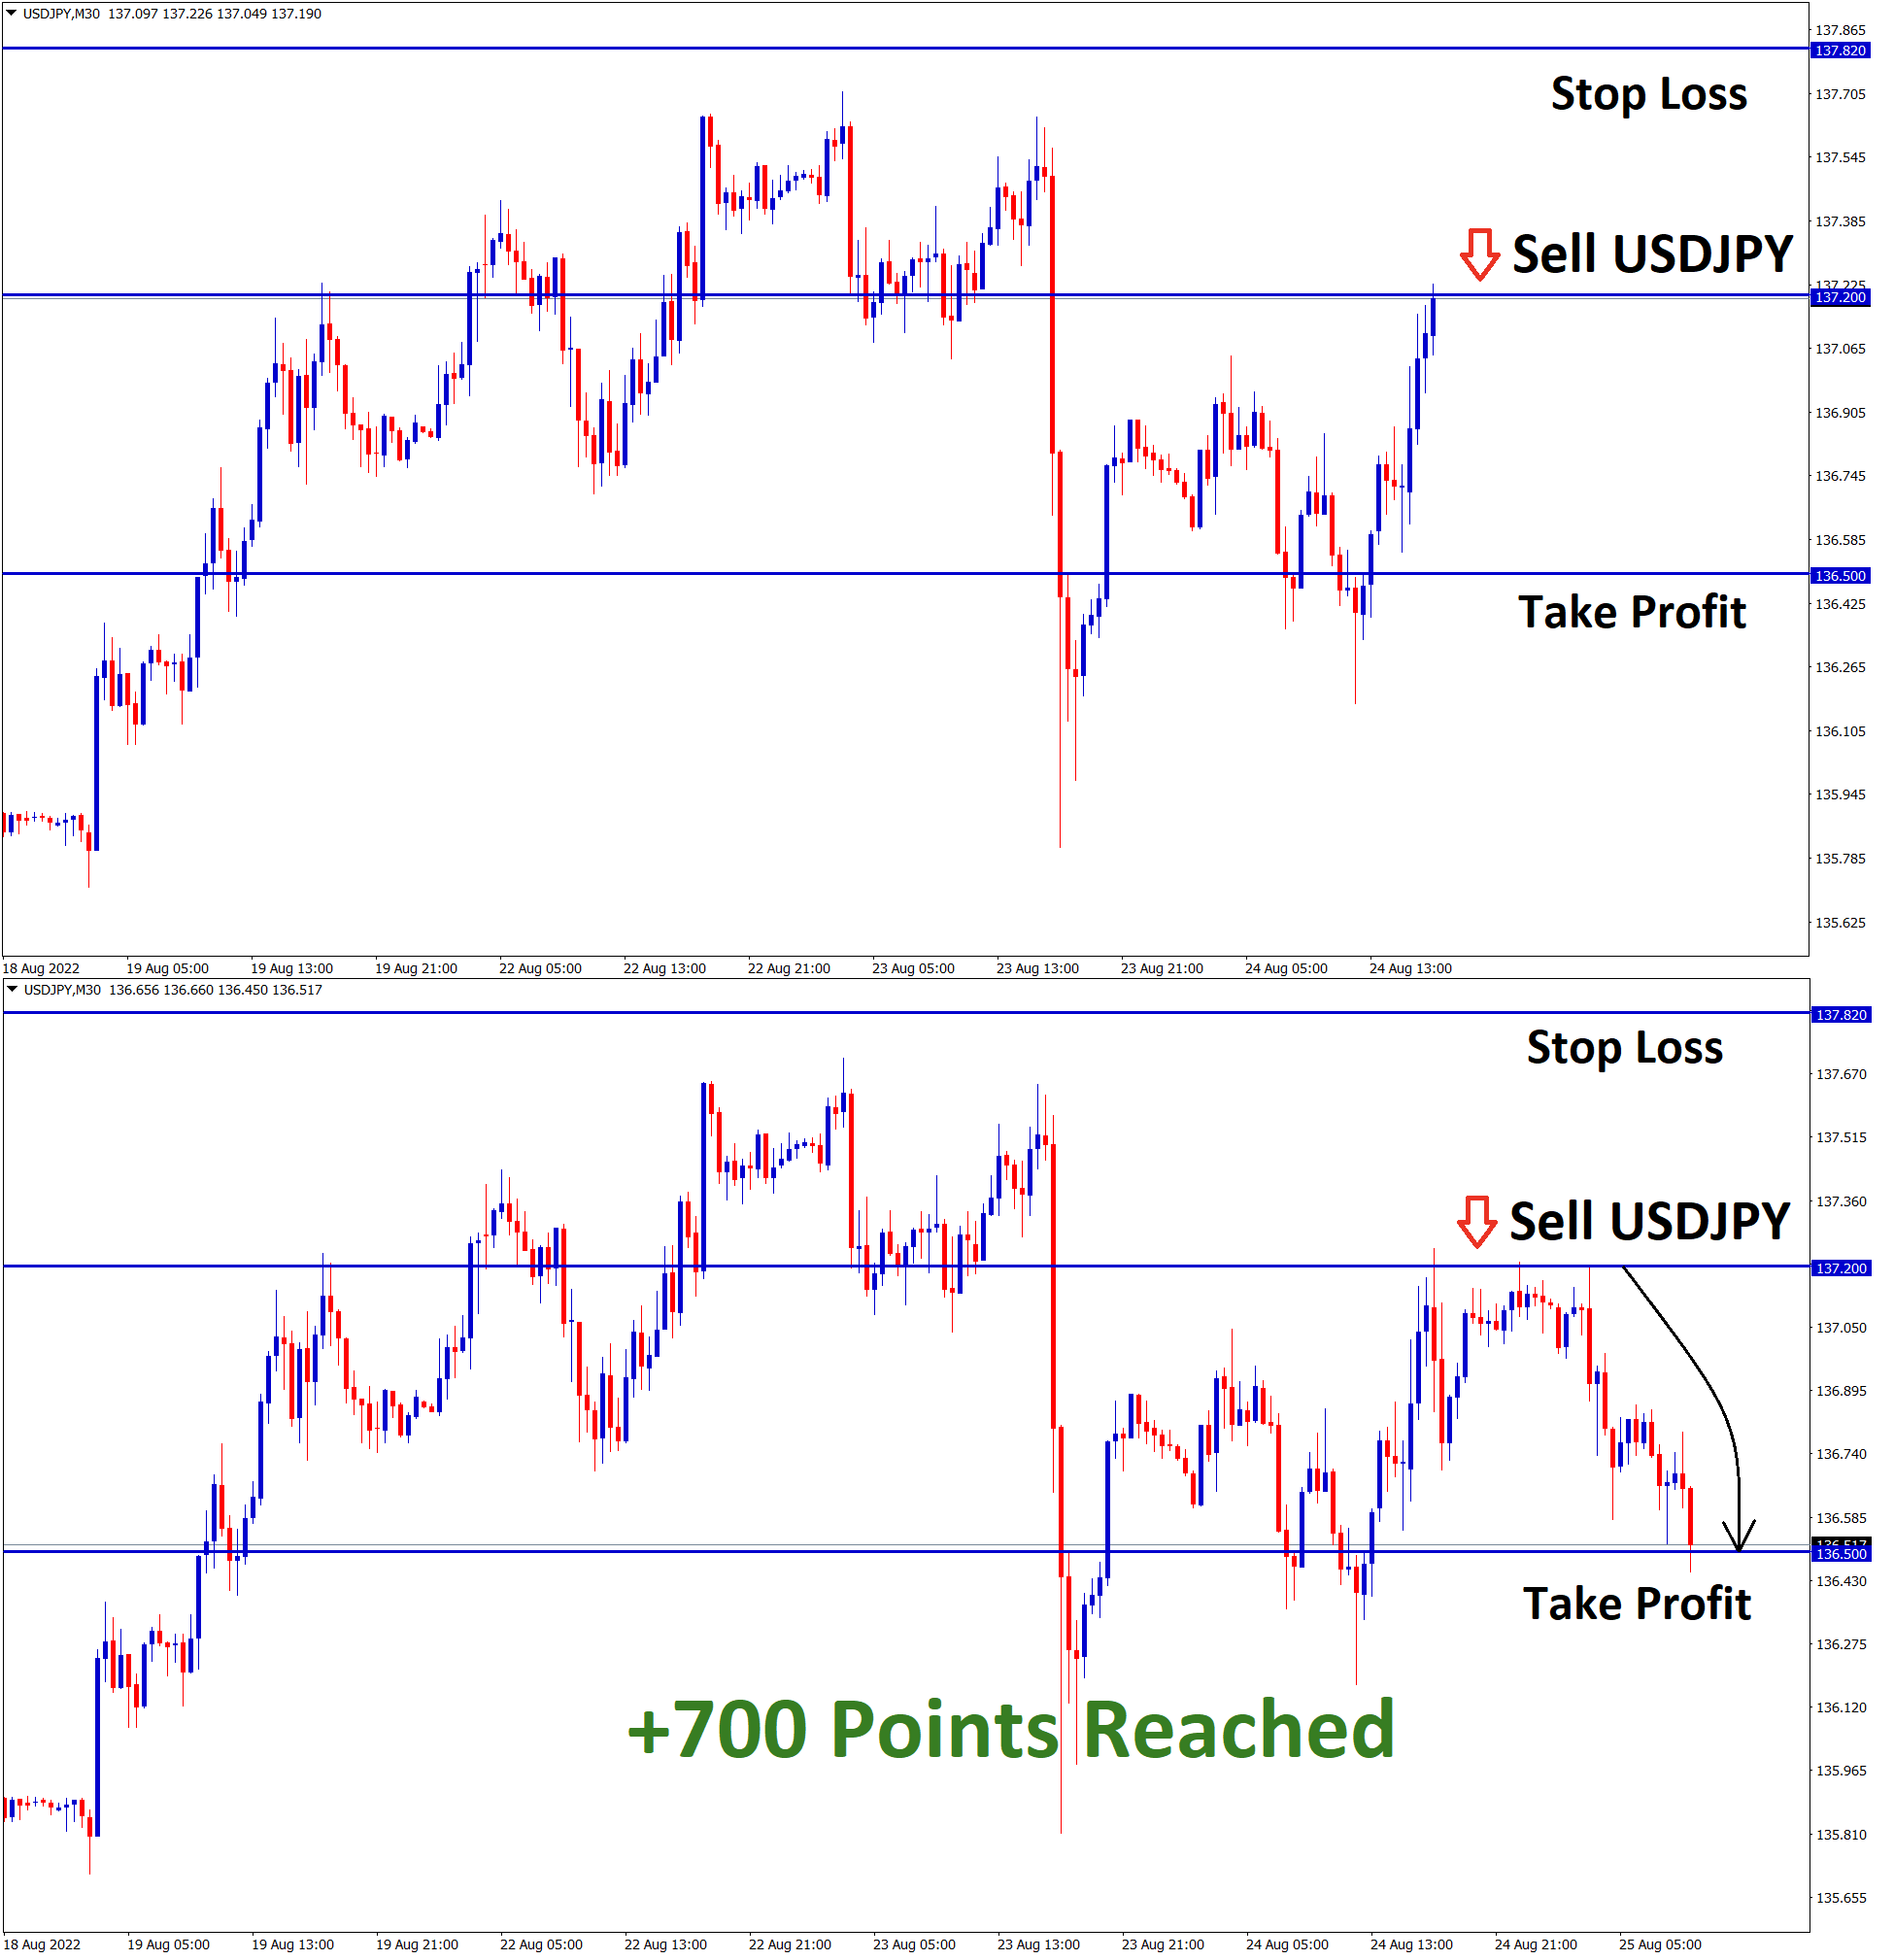
USDJPY Analysis: USDJPY has reached the higher area of the channel in the higher timeframe daily chart. In the smaller…
-
+650 Points Reached in USDJPY Sell signal after reaching the higher area of the channel
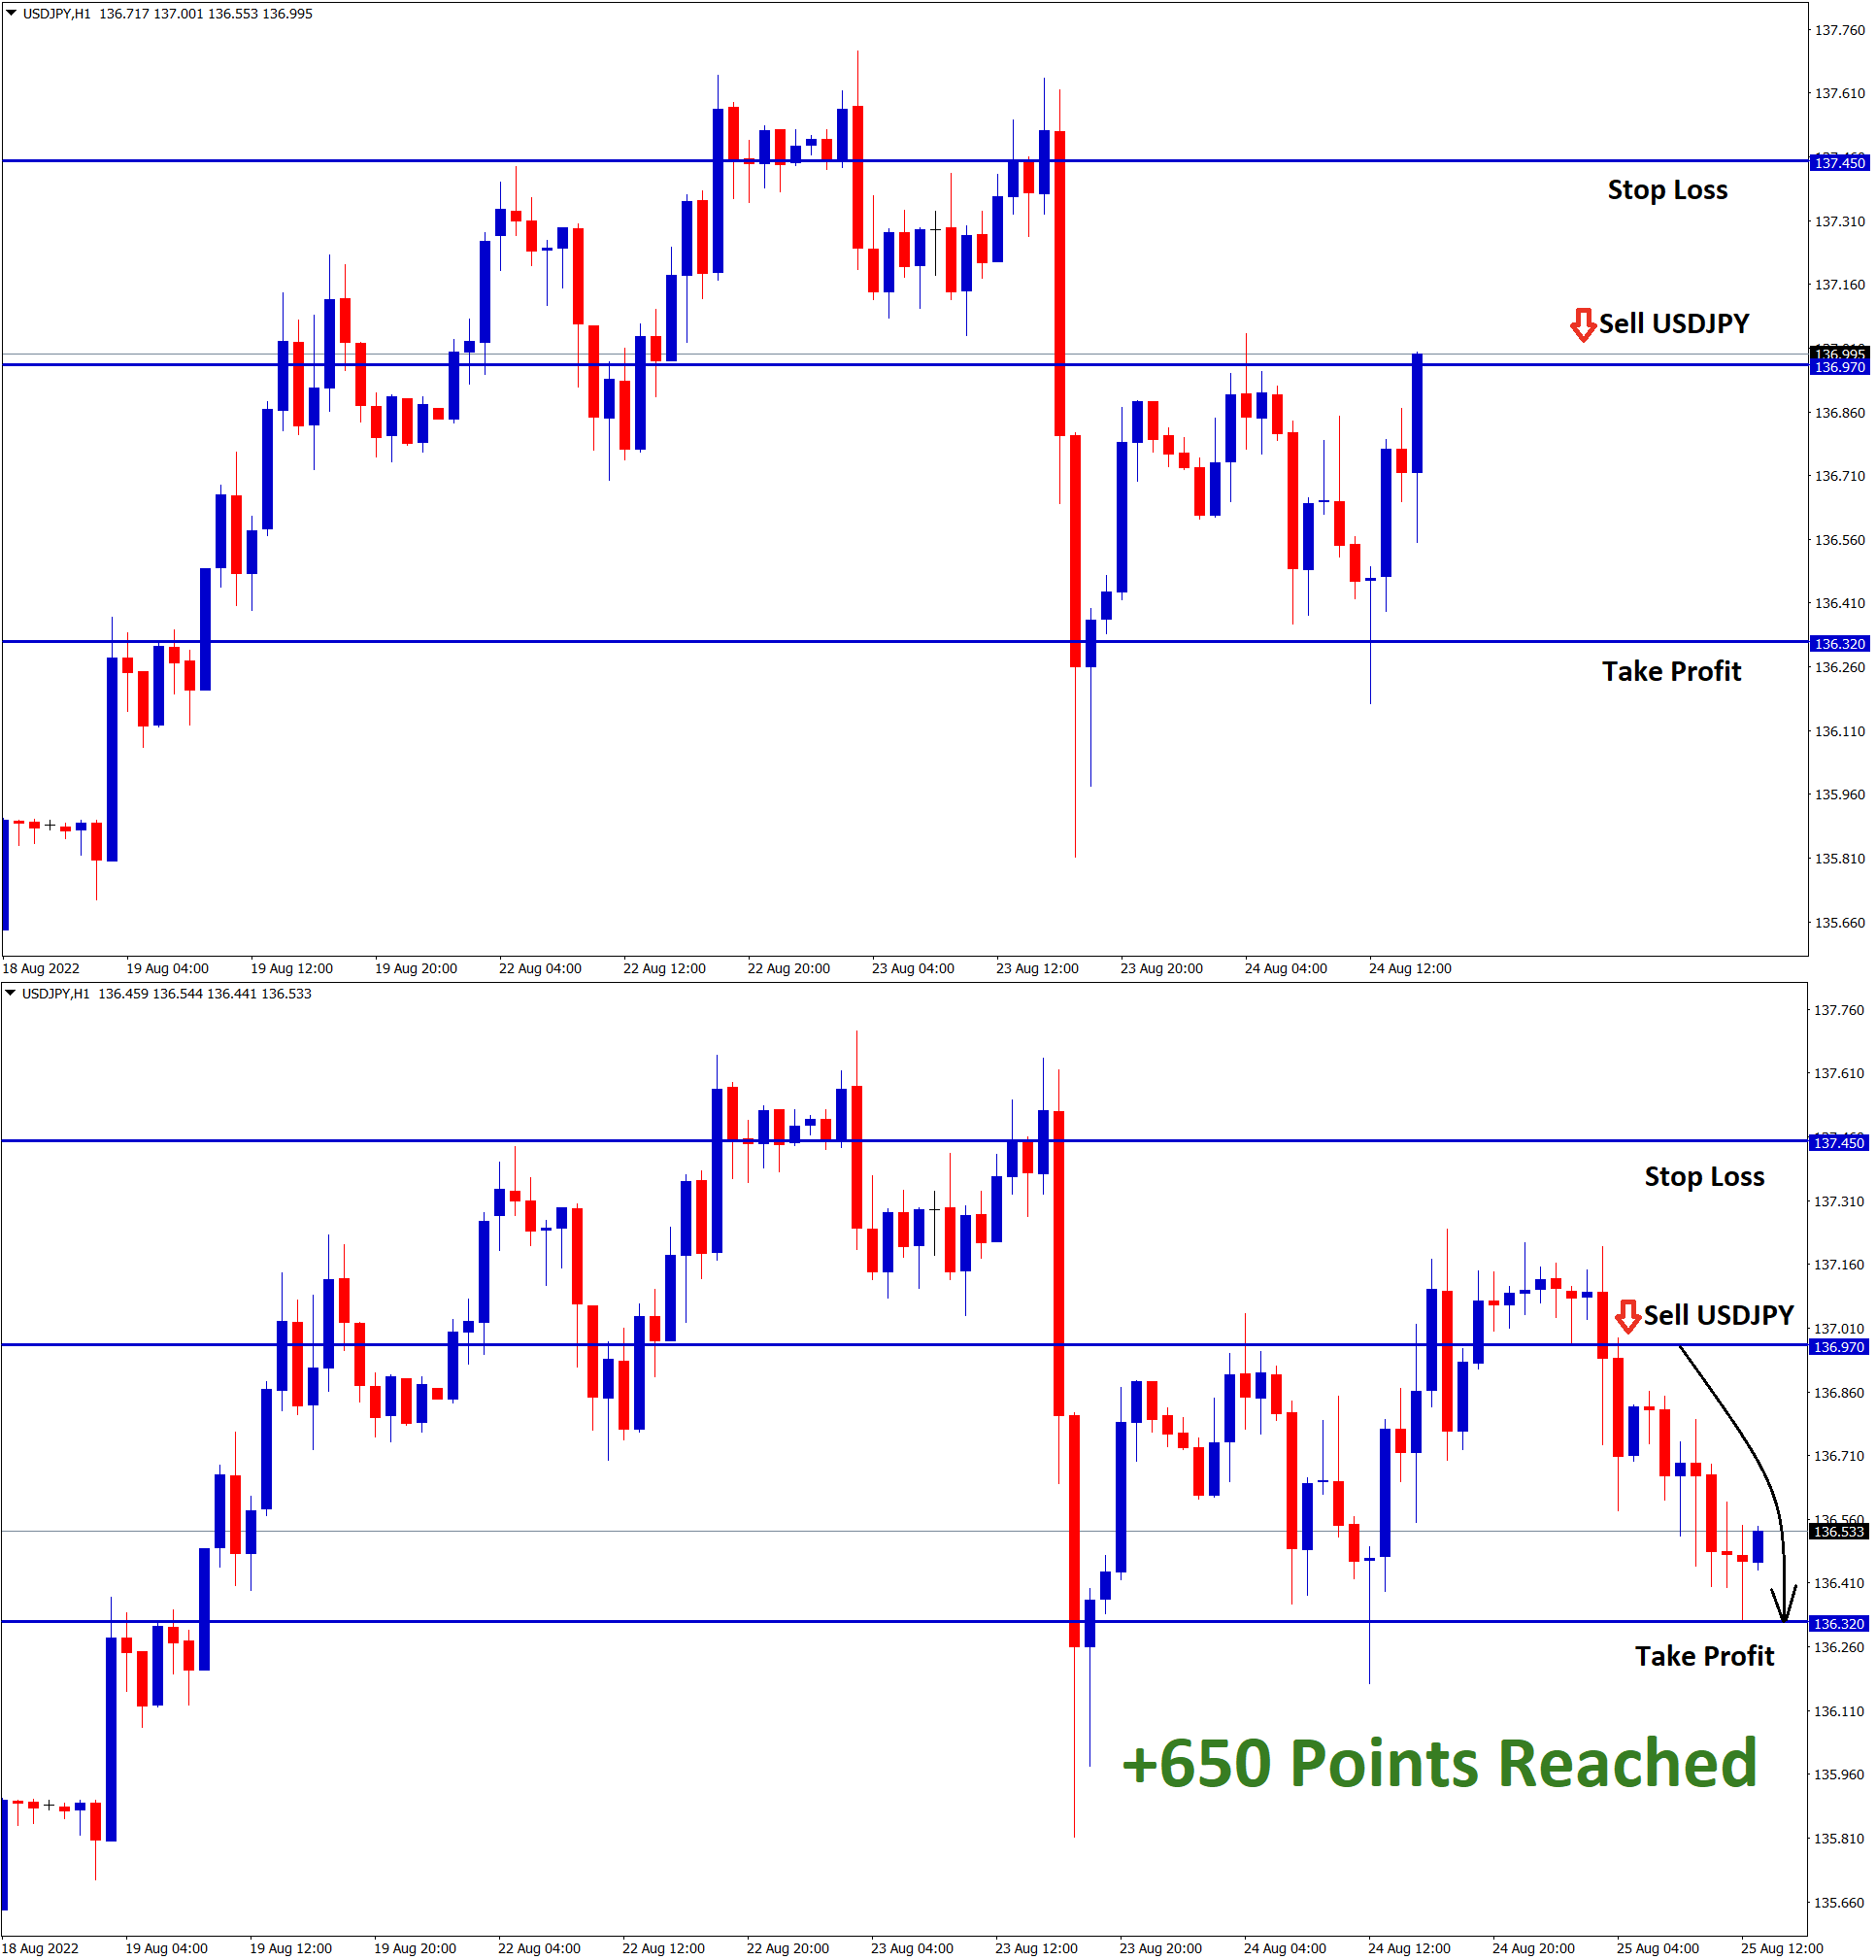
USDJPY Analysis: USDJPY has reached the higher area of the channel in the higher timeframe daily chart. In the smaller…
-
+600 Points Reached in USDJPY Sell signal after reaching the higher area of the channel
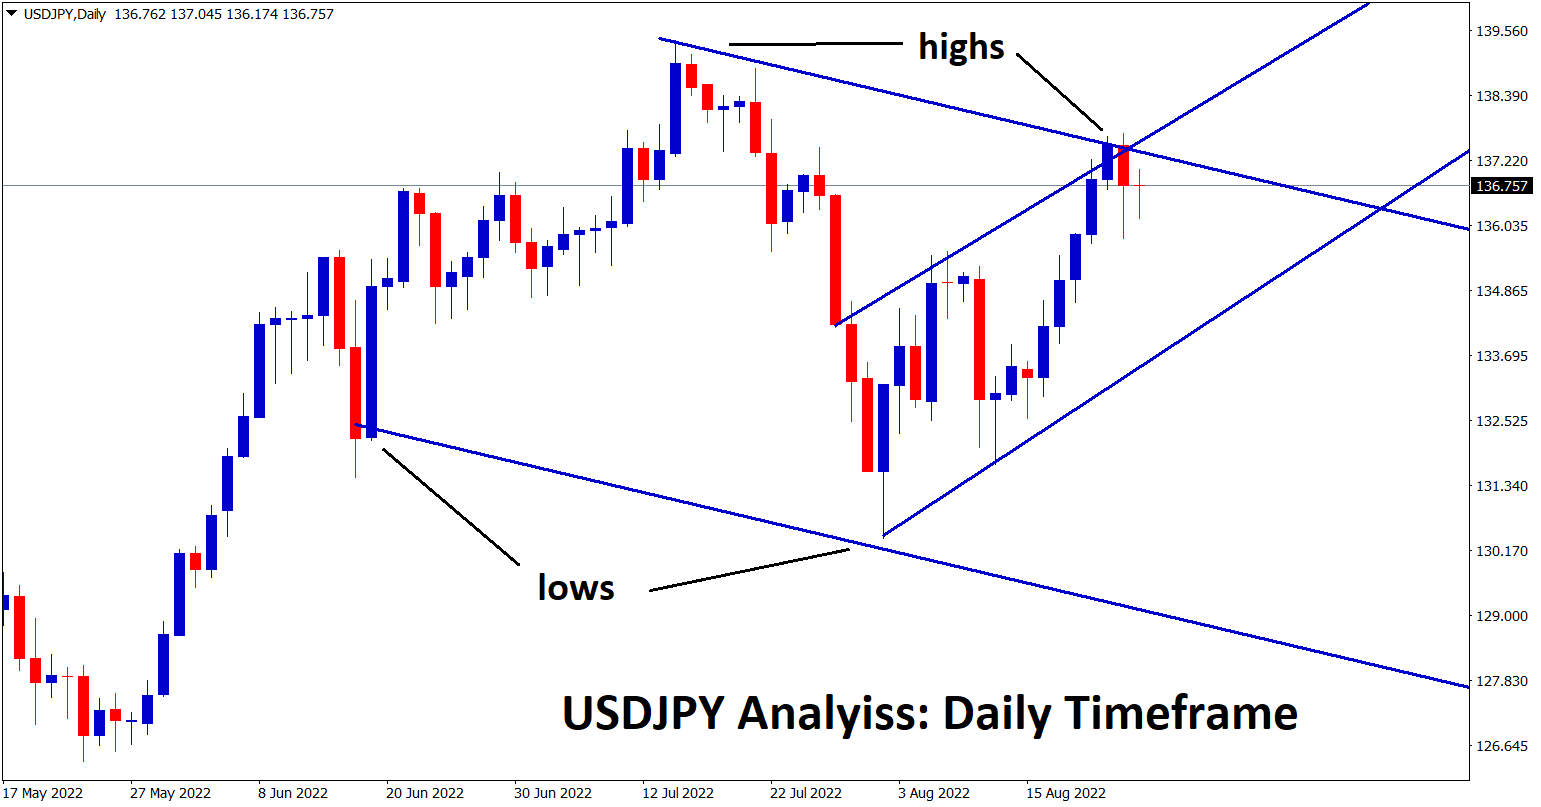
USDJPY Analysis: USDJPY has reached the higher area of the channel in the higher timeframe daily chart. In the smaller…
-
+430 Points reached in AUDCHF Buy signal after rebounding from the support area
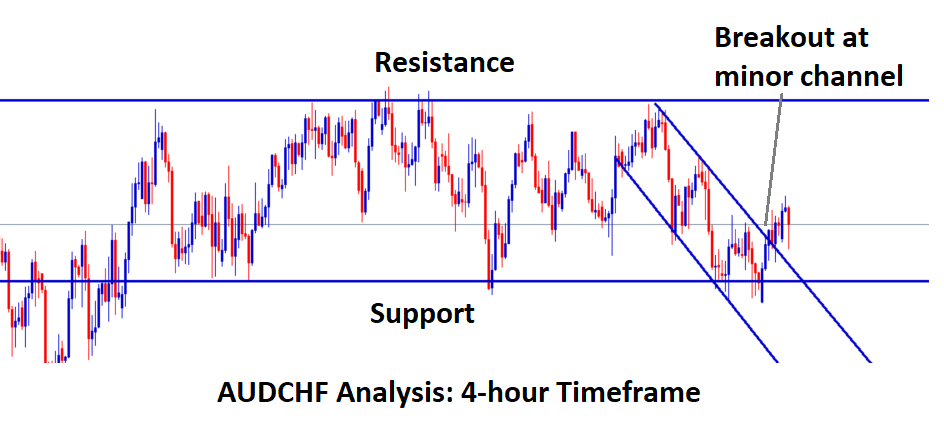
AUDCHF Analysis: AUDCHF has broken the minor descending channel after rebounding from the support area in the 4-hour timeframe. In…
-
EURUSD is trying to break the major support area without rebound which leads to – 730 points
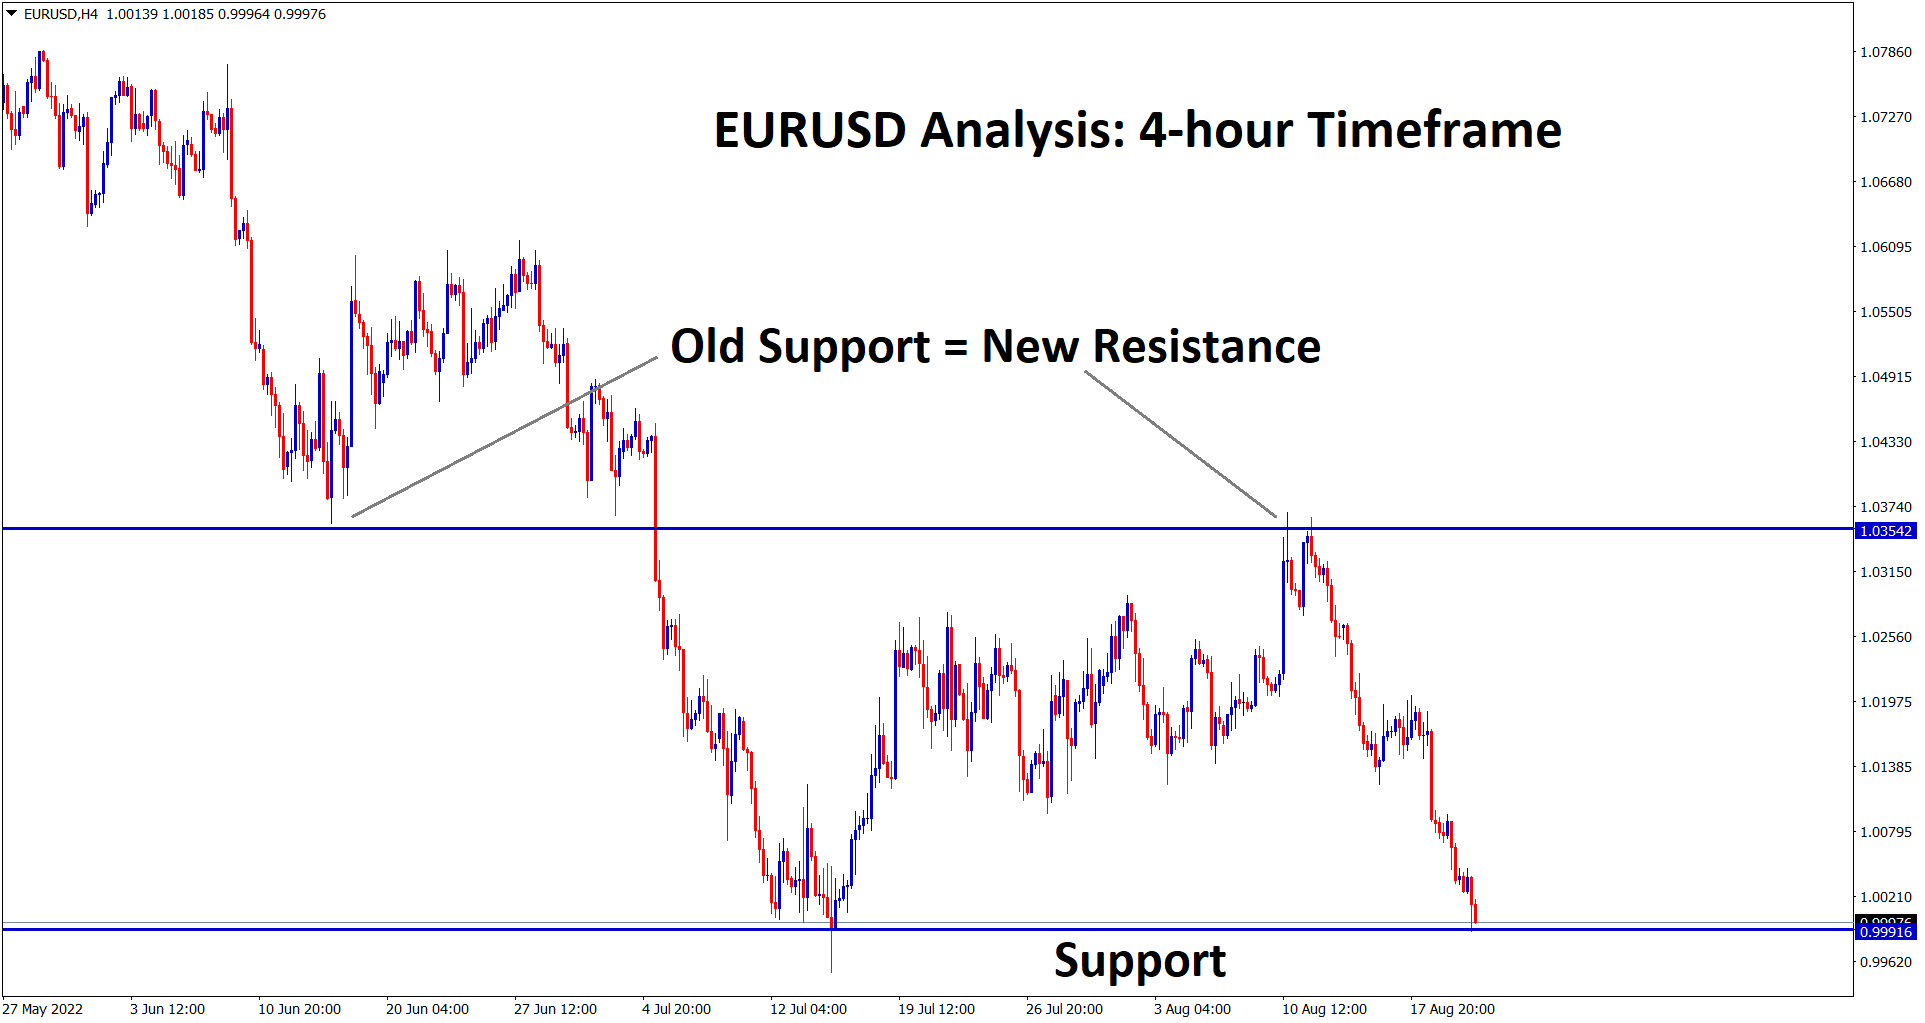
EURUSD Analysis EURUSD has reached the horizontal support area in the 4-hour timeframe chart. In the 1-hour timeframe, EURUSD hit…
-
NZDUSD Buy signal closed at entry after reaching the important support area
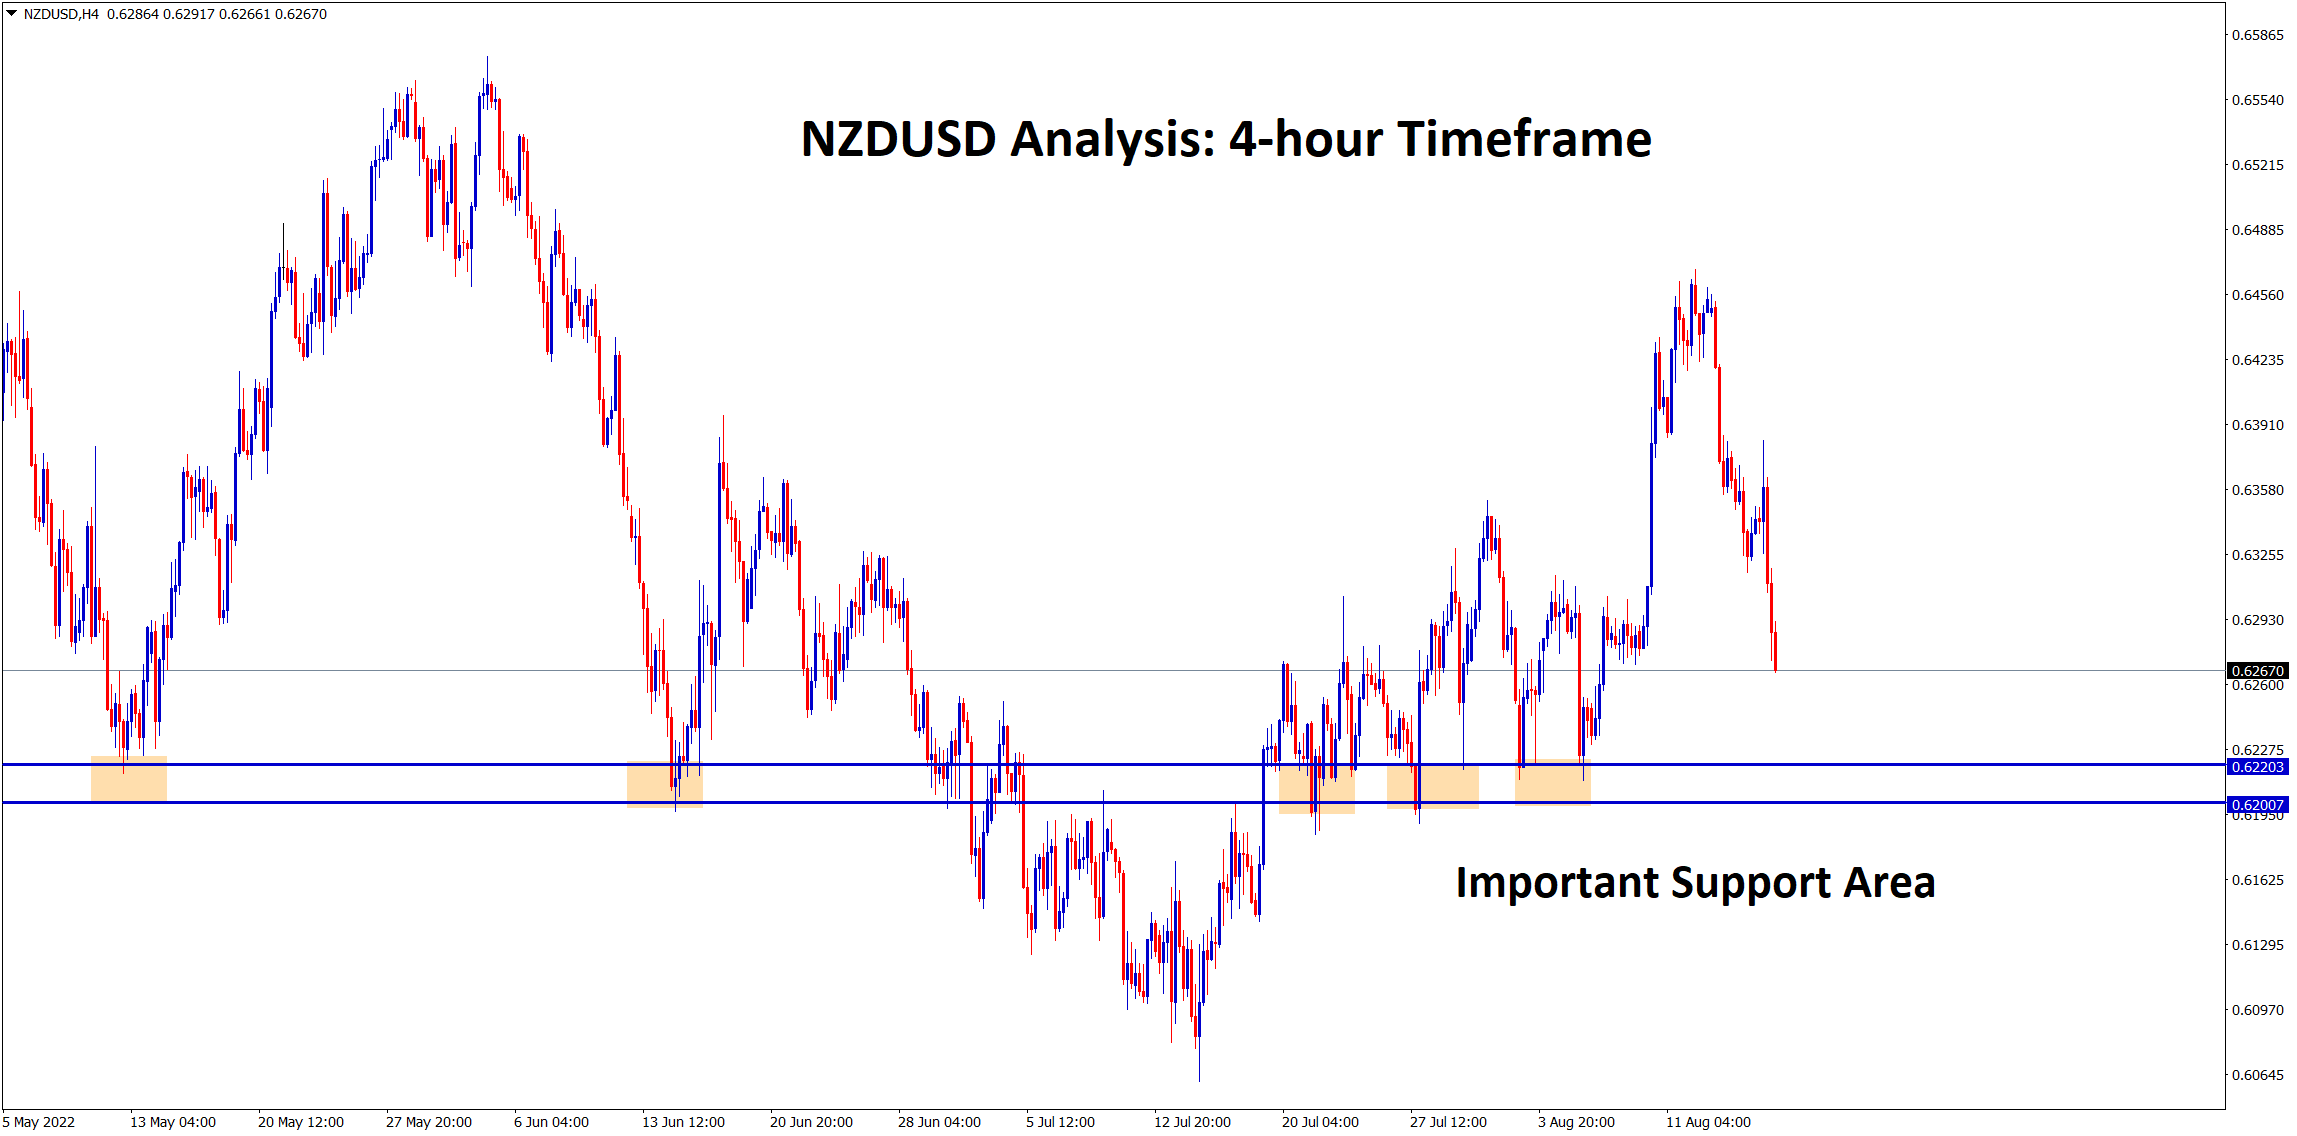
NZDUSD Analysis NZDUSD is going to reach the important support area in the 4-hour timeframe. After the confirmation of the…
-
GBPAUD try to retest the low level again which leads to -725 points
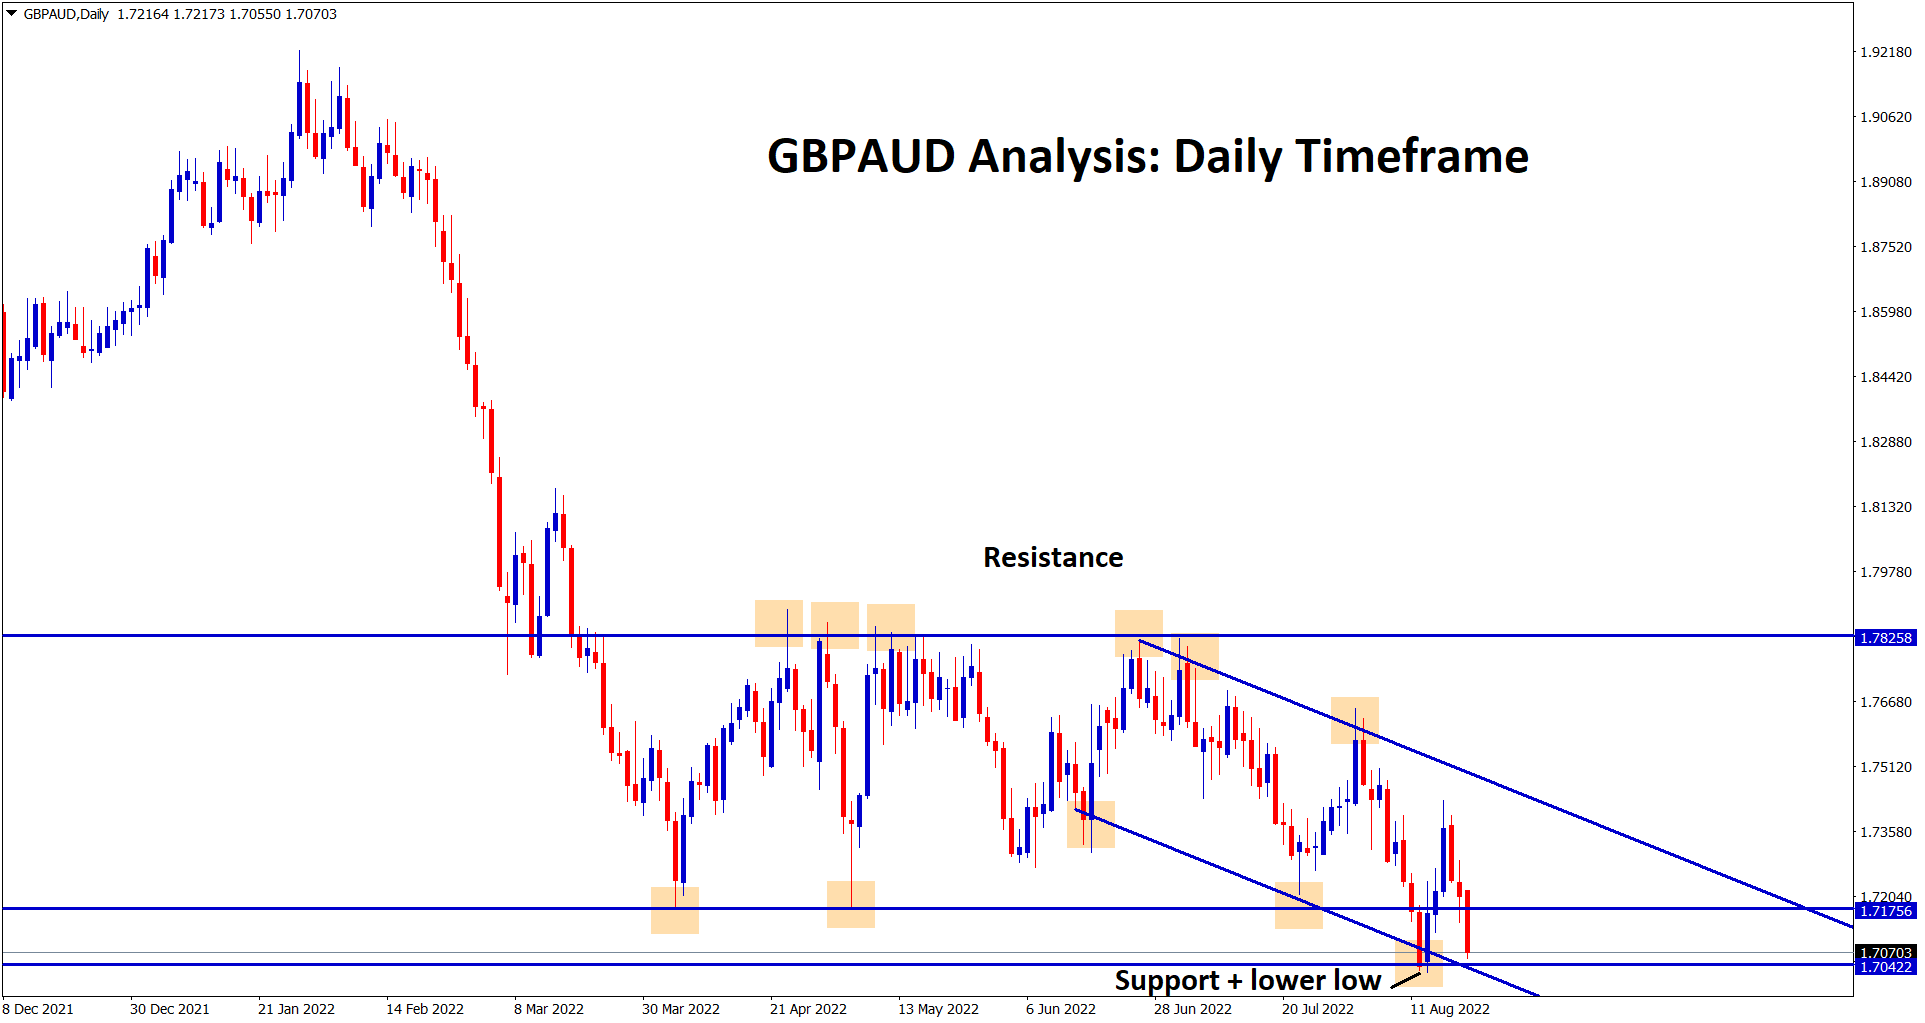
GBPAUD Analysis: GBPAUD rebound from the horizontal support and the lower low area in the daily timeframe. GBPAUD has reached…
-
EURGBP Sell signal closed at entry price after retesting the broken ascending channel
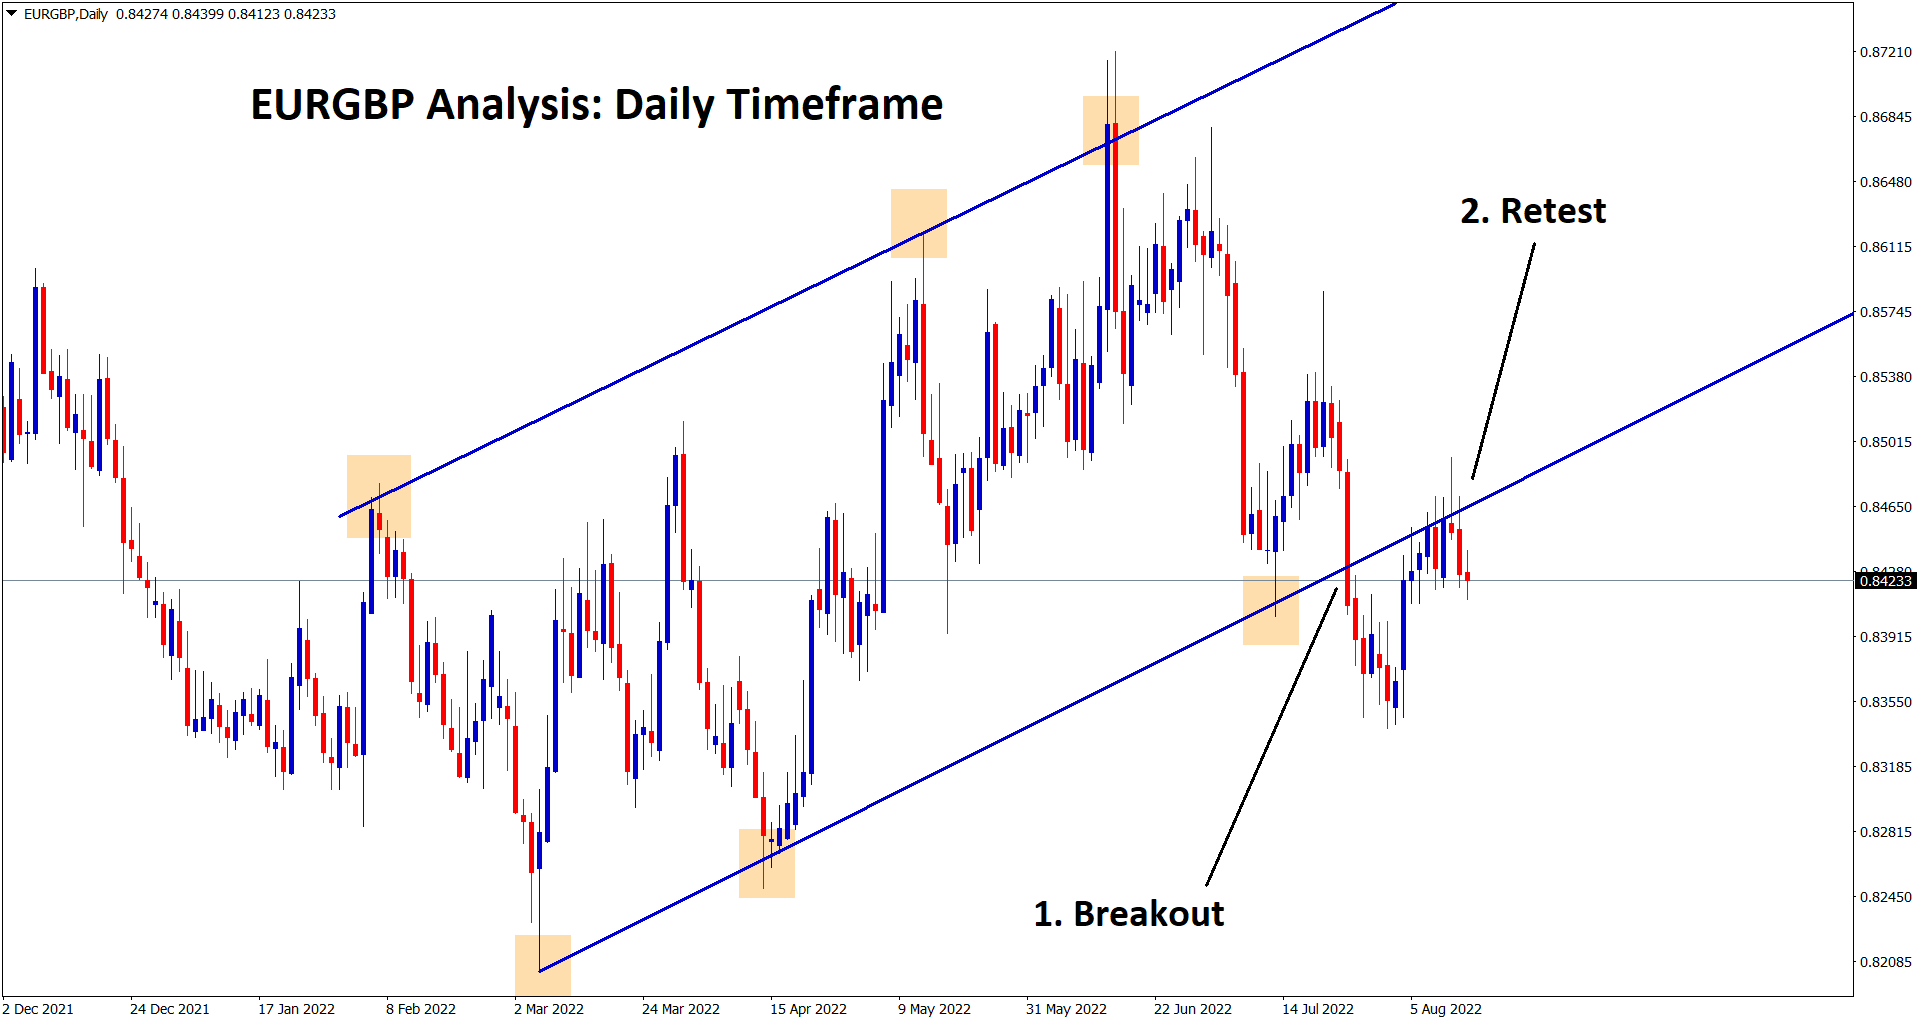
EURGBP Analysis: EURGBP has retested the broken ascending channel in the daily timeframe chart. EURGBP is falling from the top…
-
CADCHF Buy signal closed at entry price after reaching the higher low area
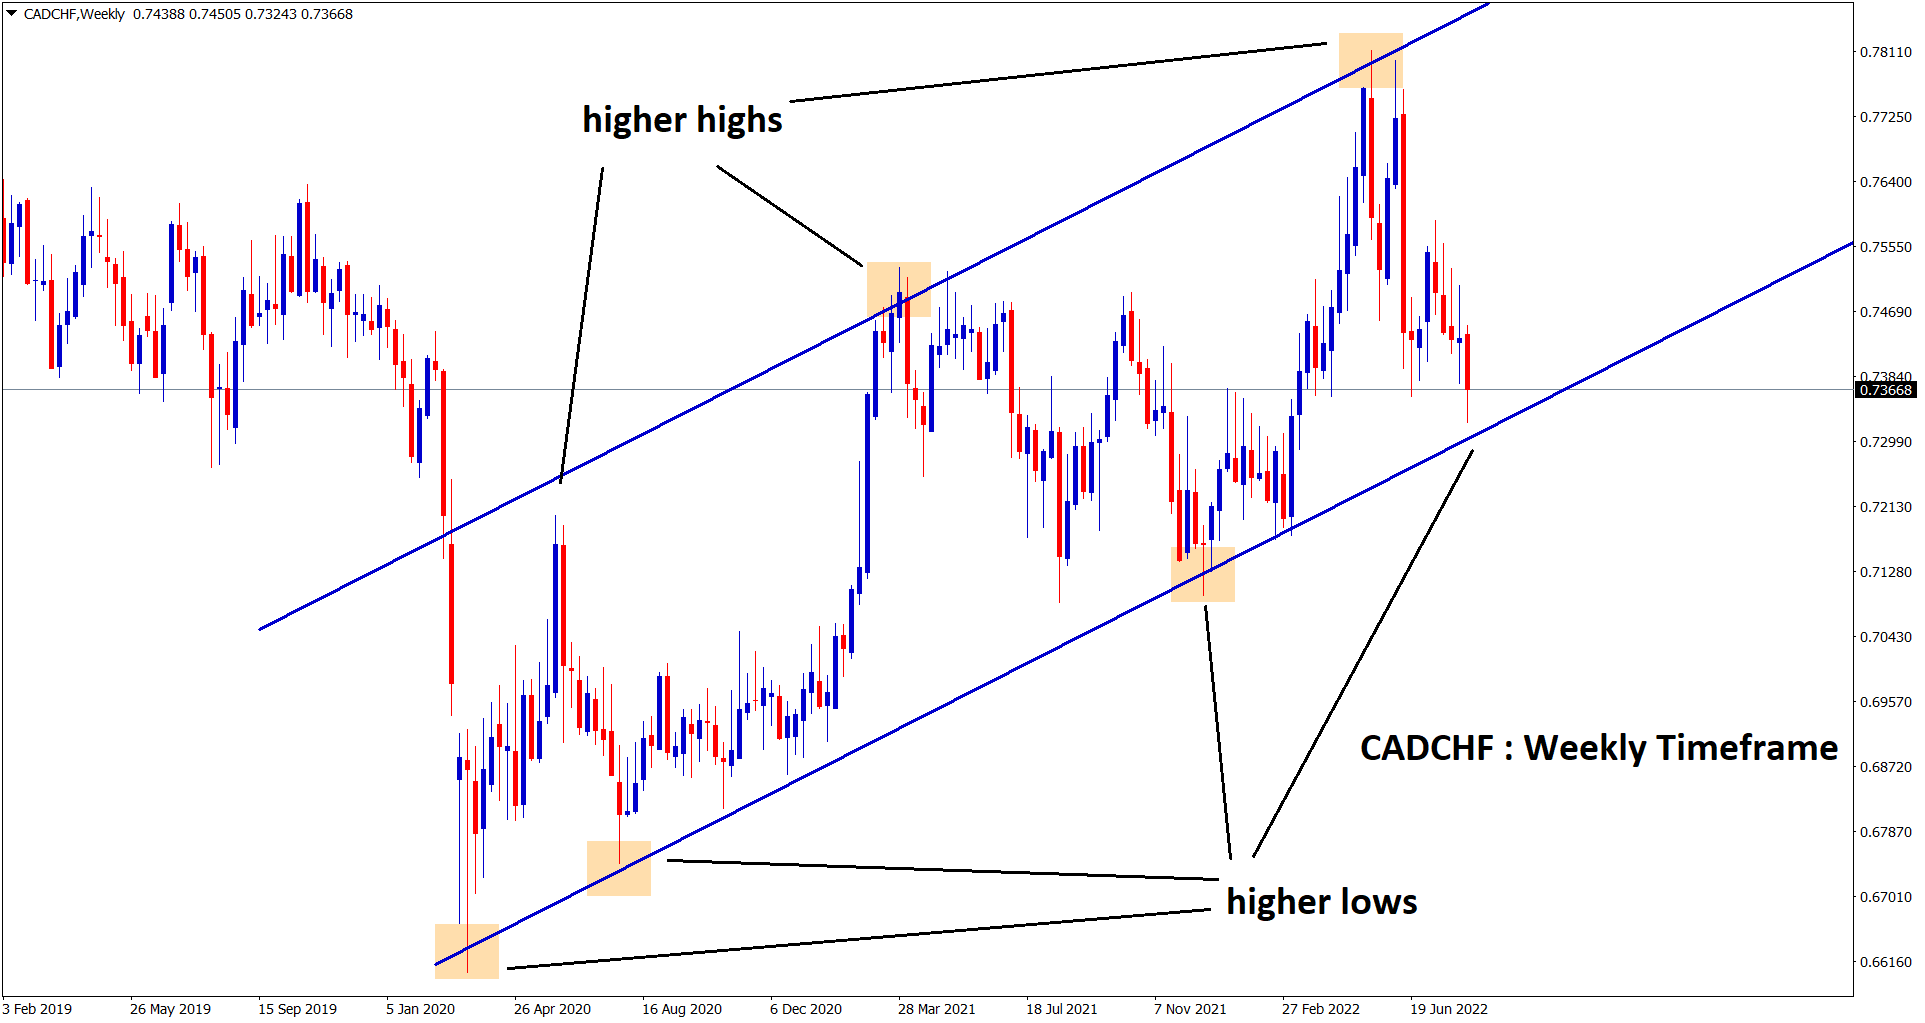
CADCHF Analysis: CADCHF has reached the higher low area of the uptrend line in the weekly timeframe chart. CADCHF hits…
-
CHFJPY falling from the top (lower high) area and reached -700 Points
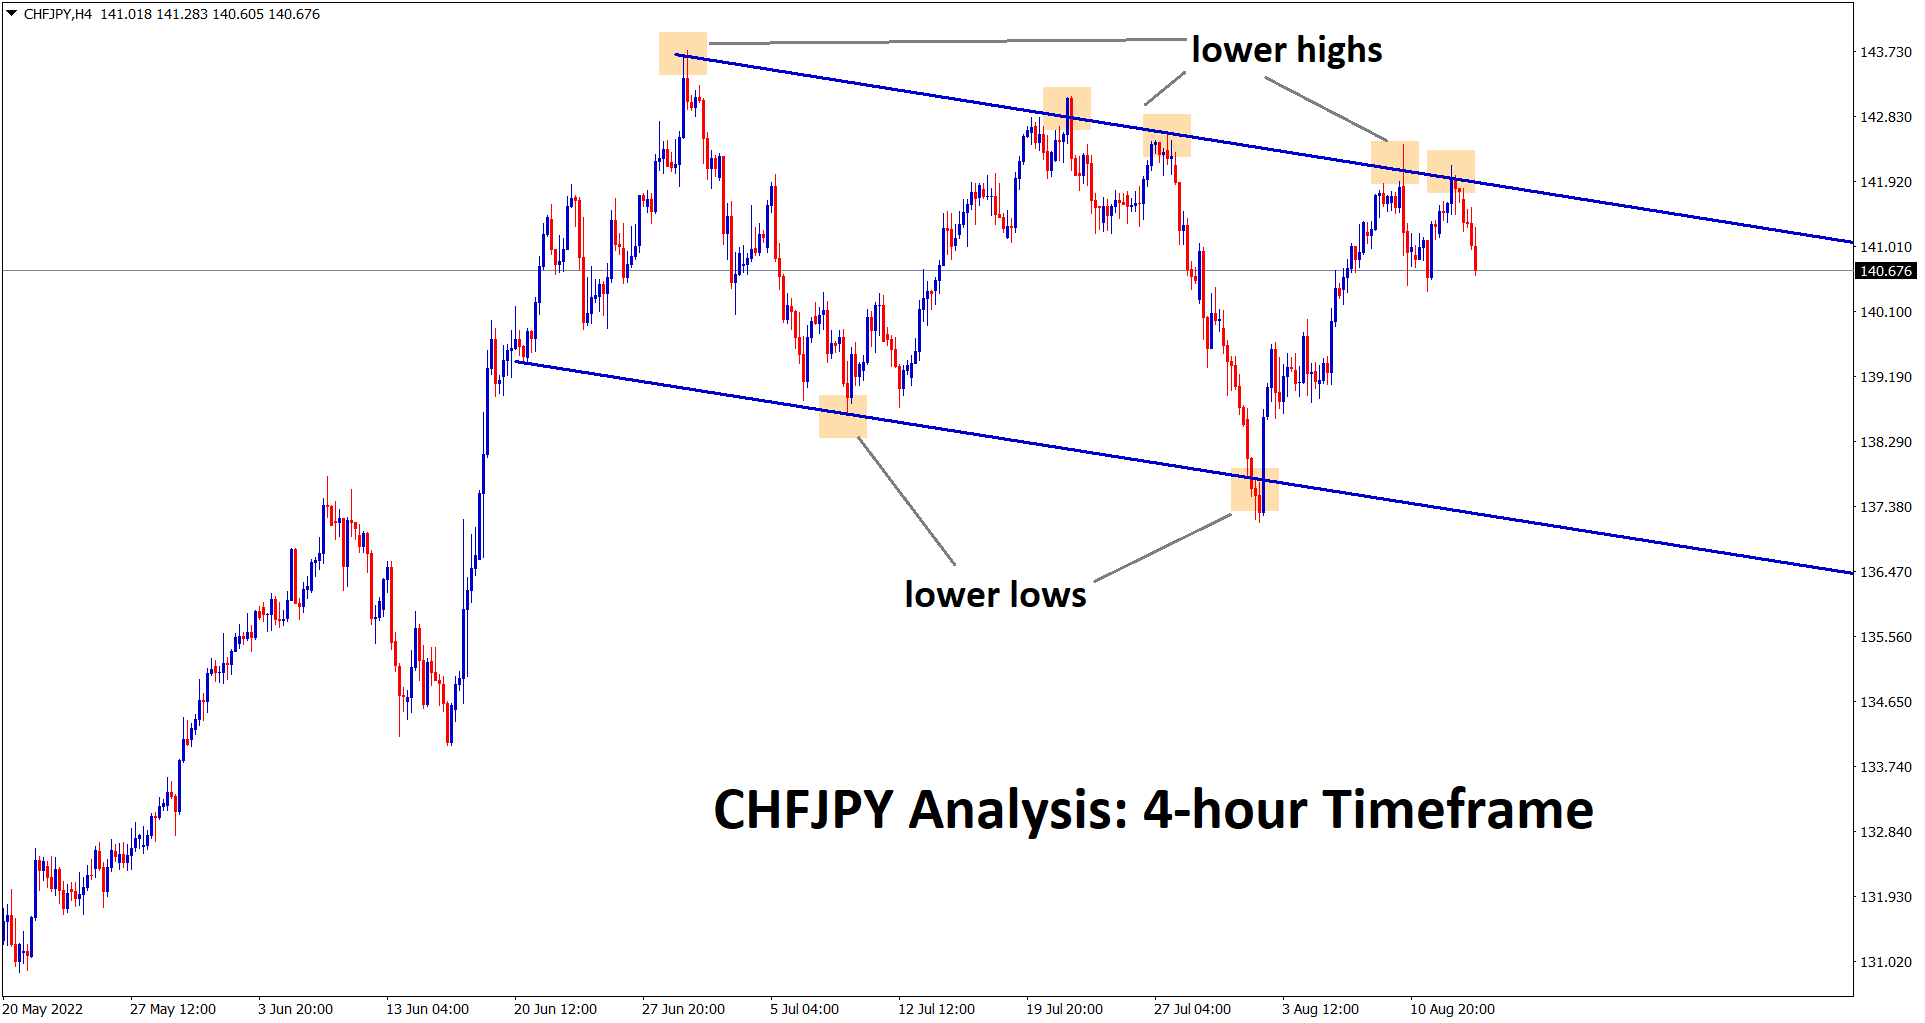
CHFJPY Analysis: CHFJPY is falling from the top (lower high) area of the descending channel in the 4-hour timeframe chart.…