USDCHF starts to fall after a breakout
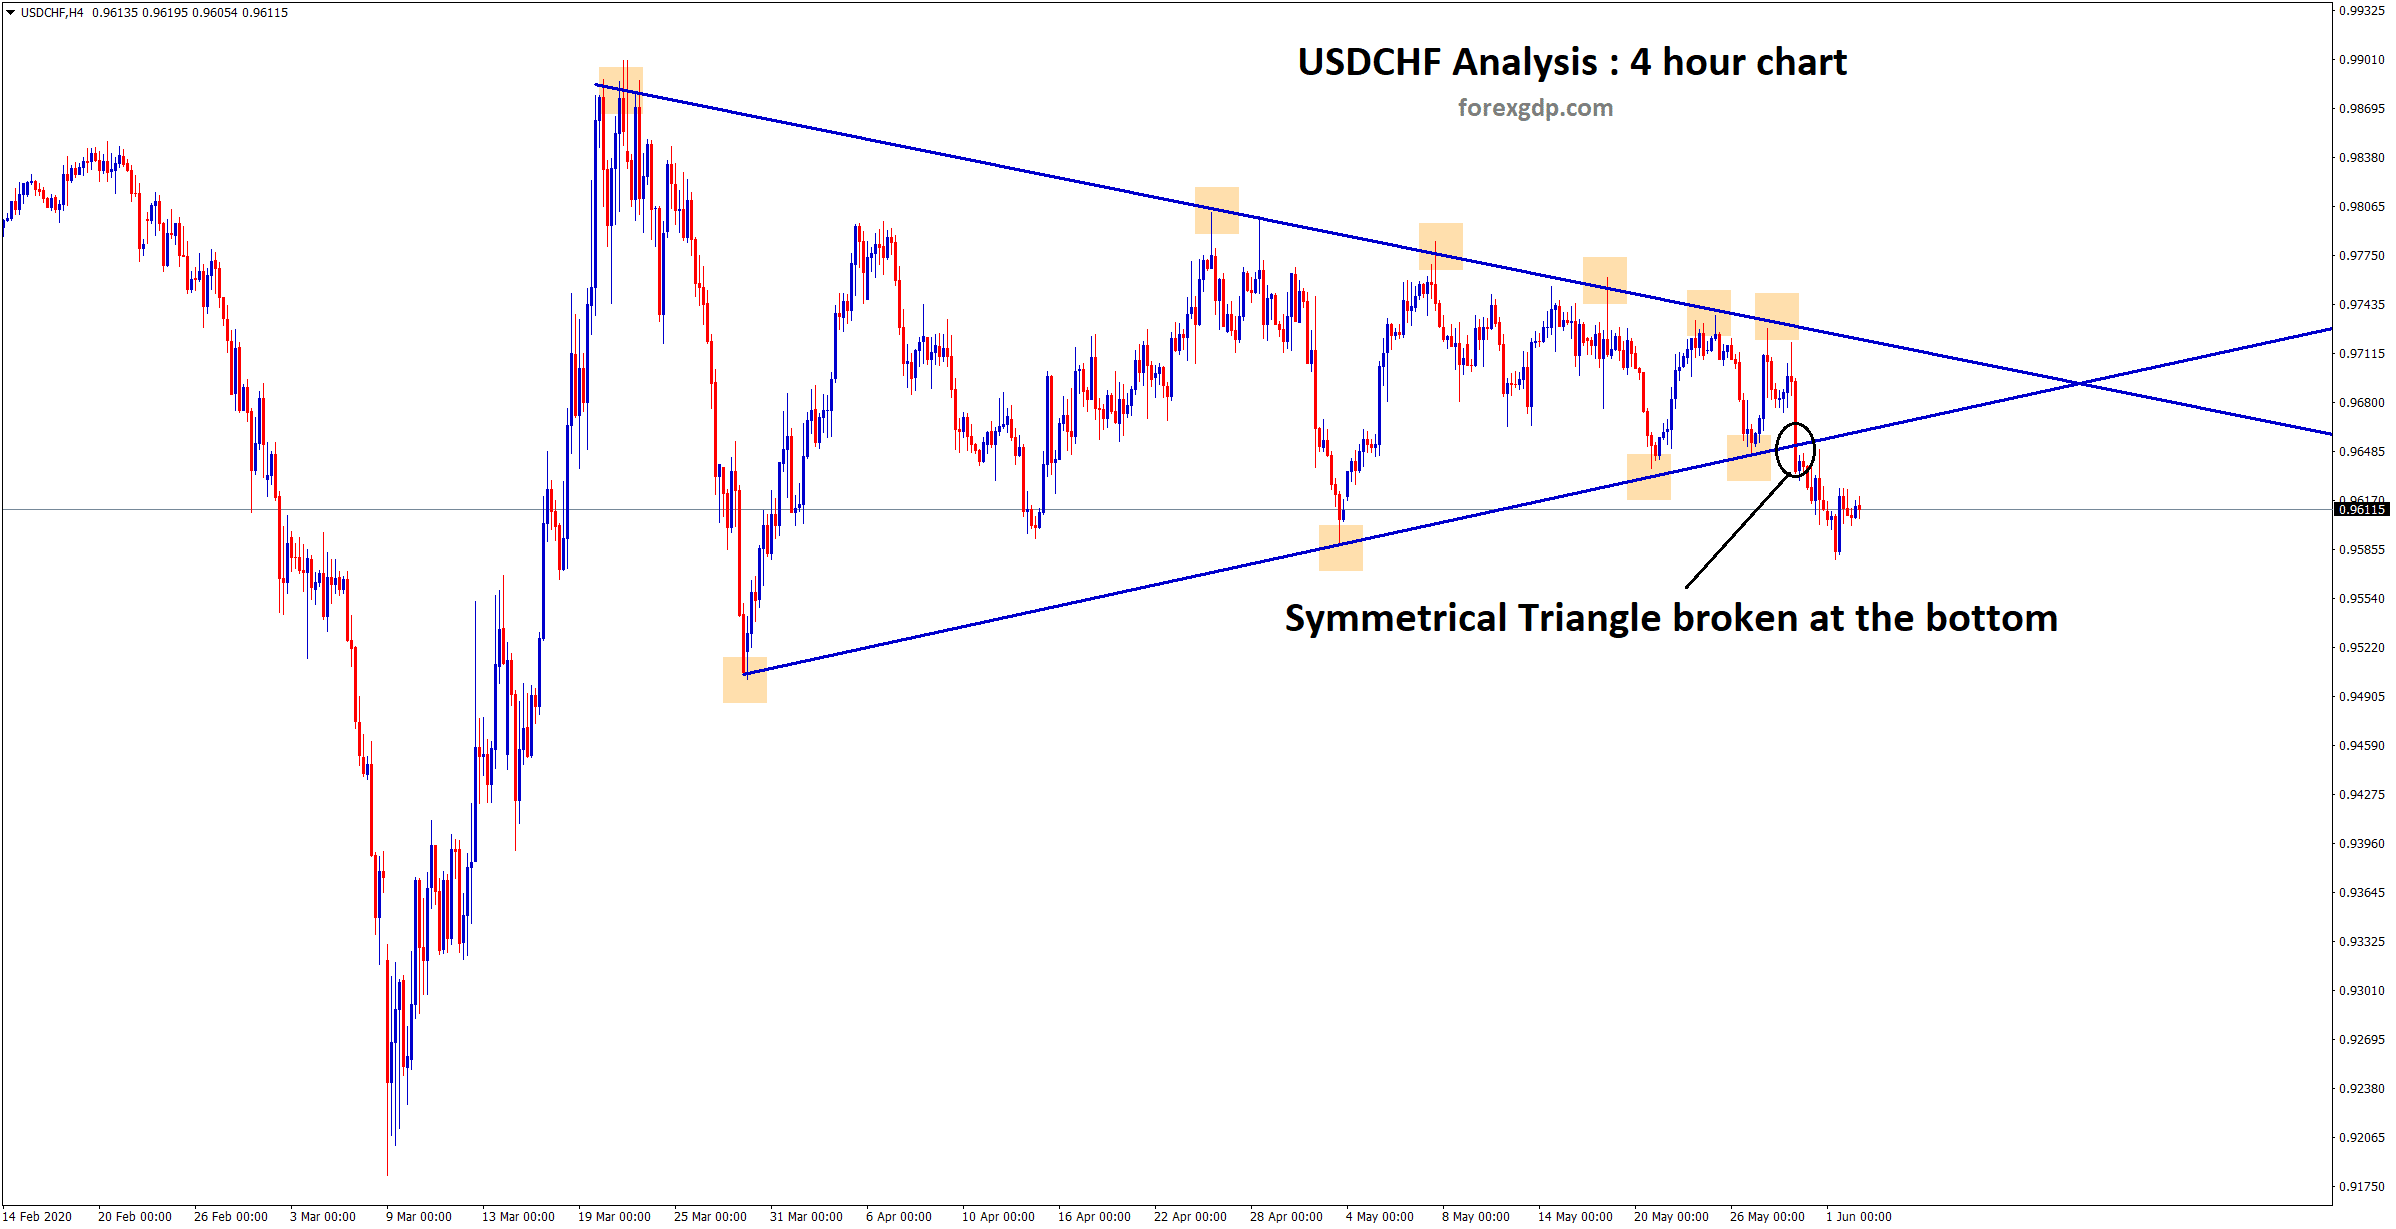
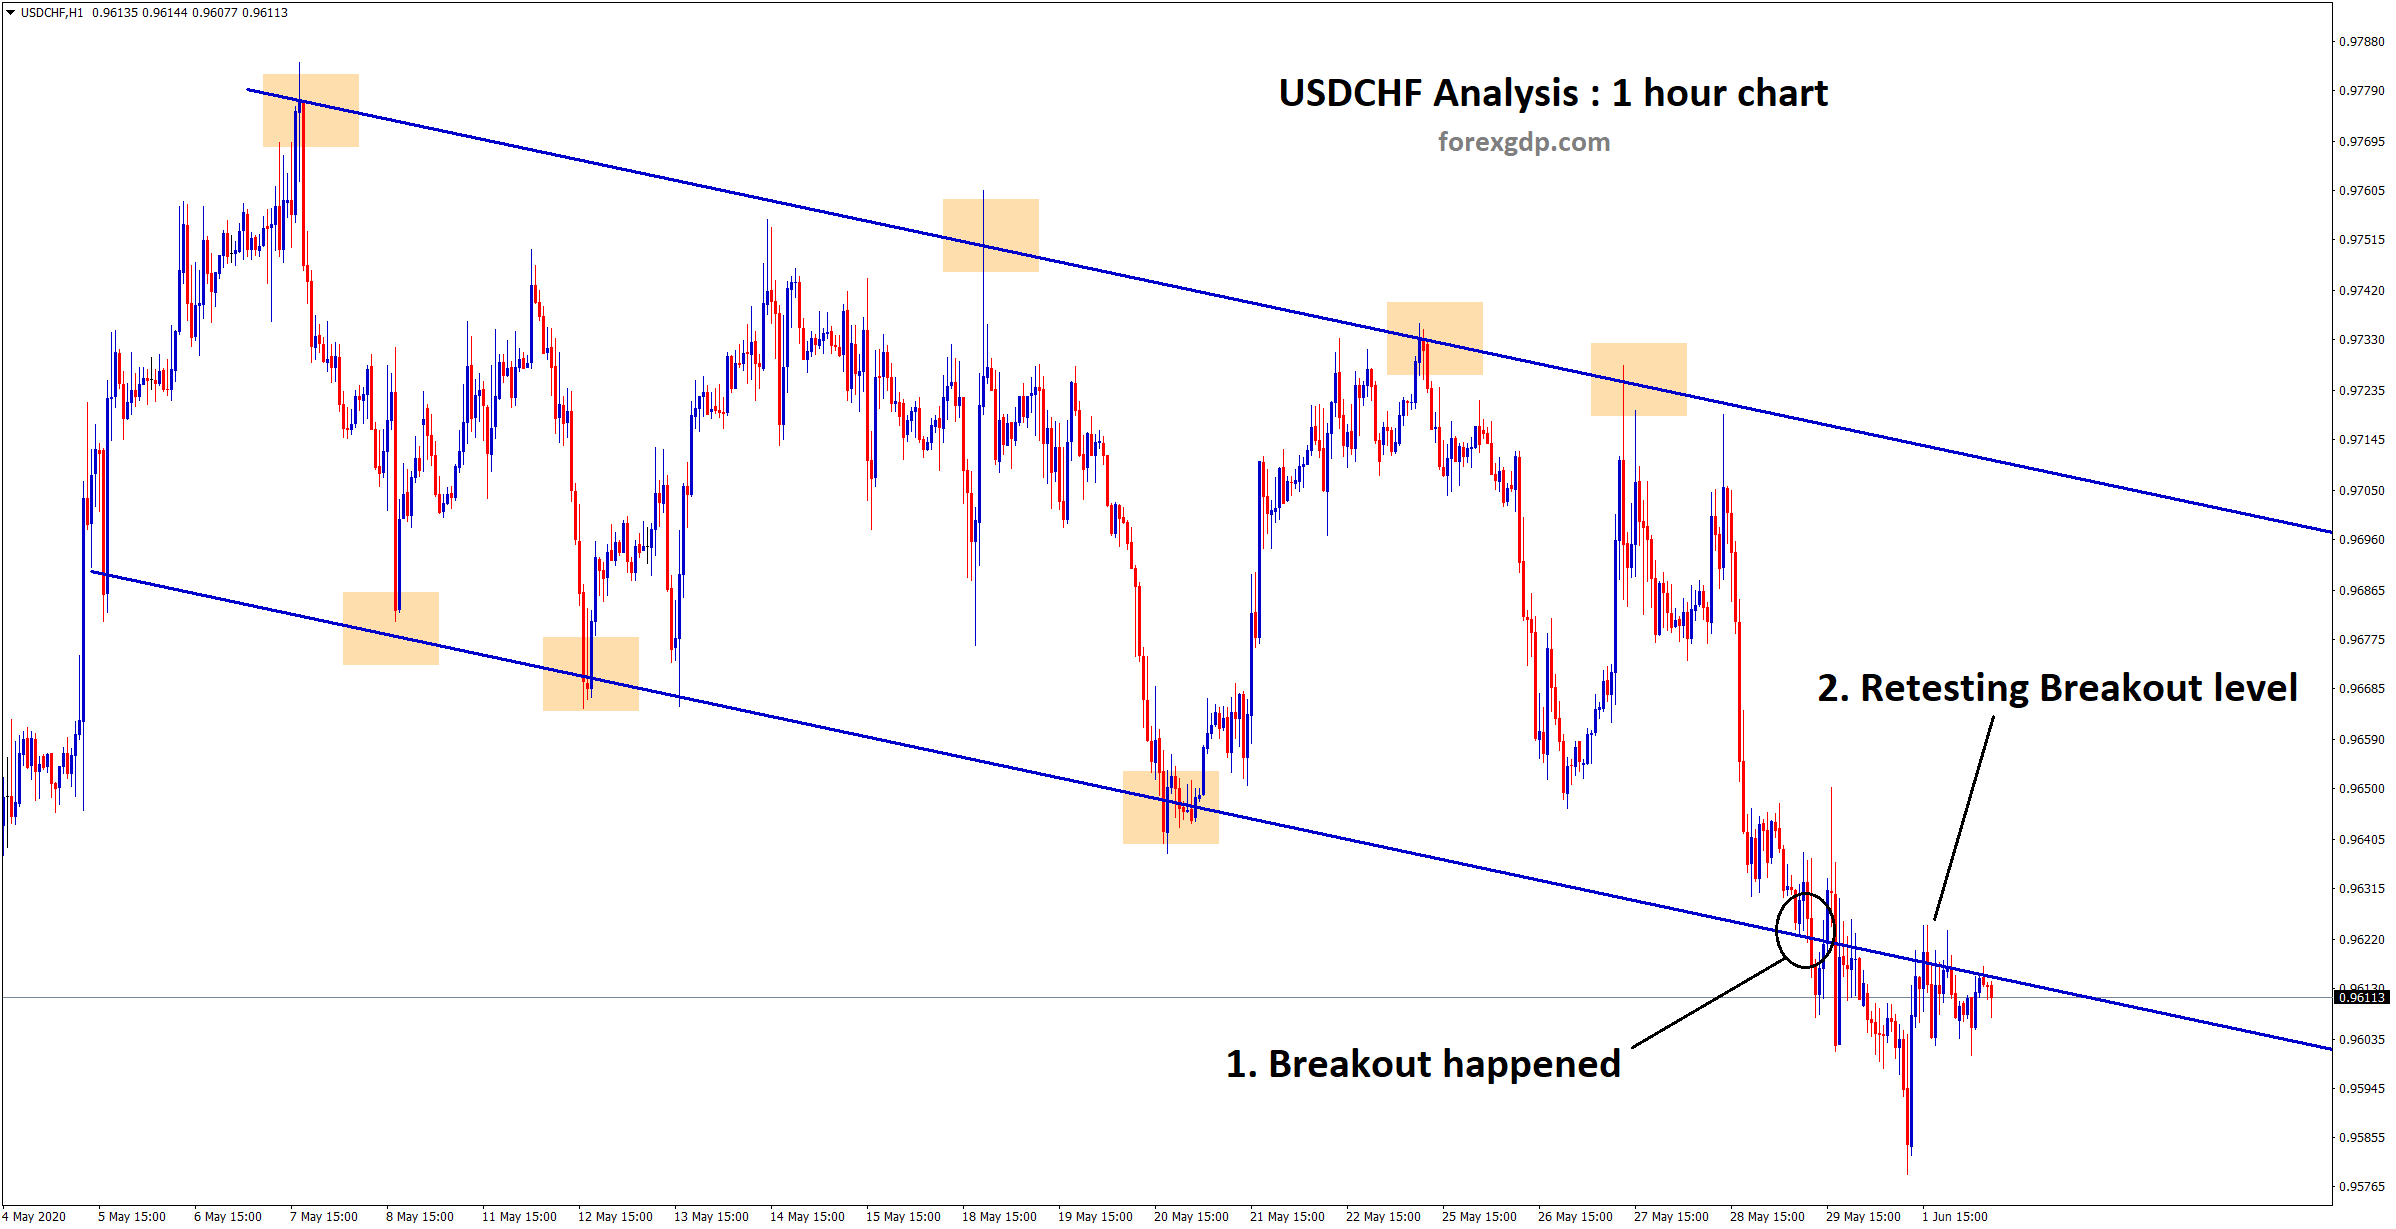
We are waiting for a long time for this symmetrical Triangle breakout (check the previous USDCHF analysis here), USDCHF has broken the bottom level of the triangle recently.
After market falling to the horizontal support zone 0.9590, it bounces back from the support price. however, USDCHF fails to reverse with buyers’ pressure.
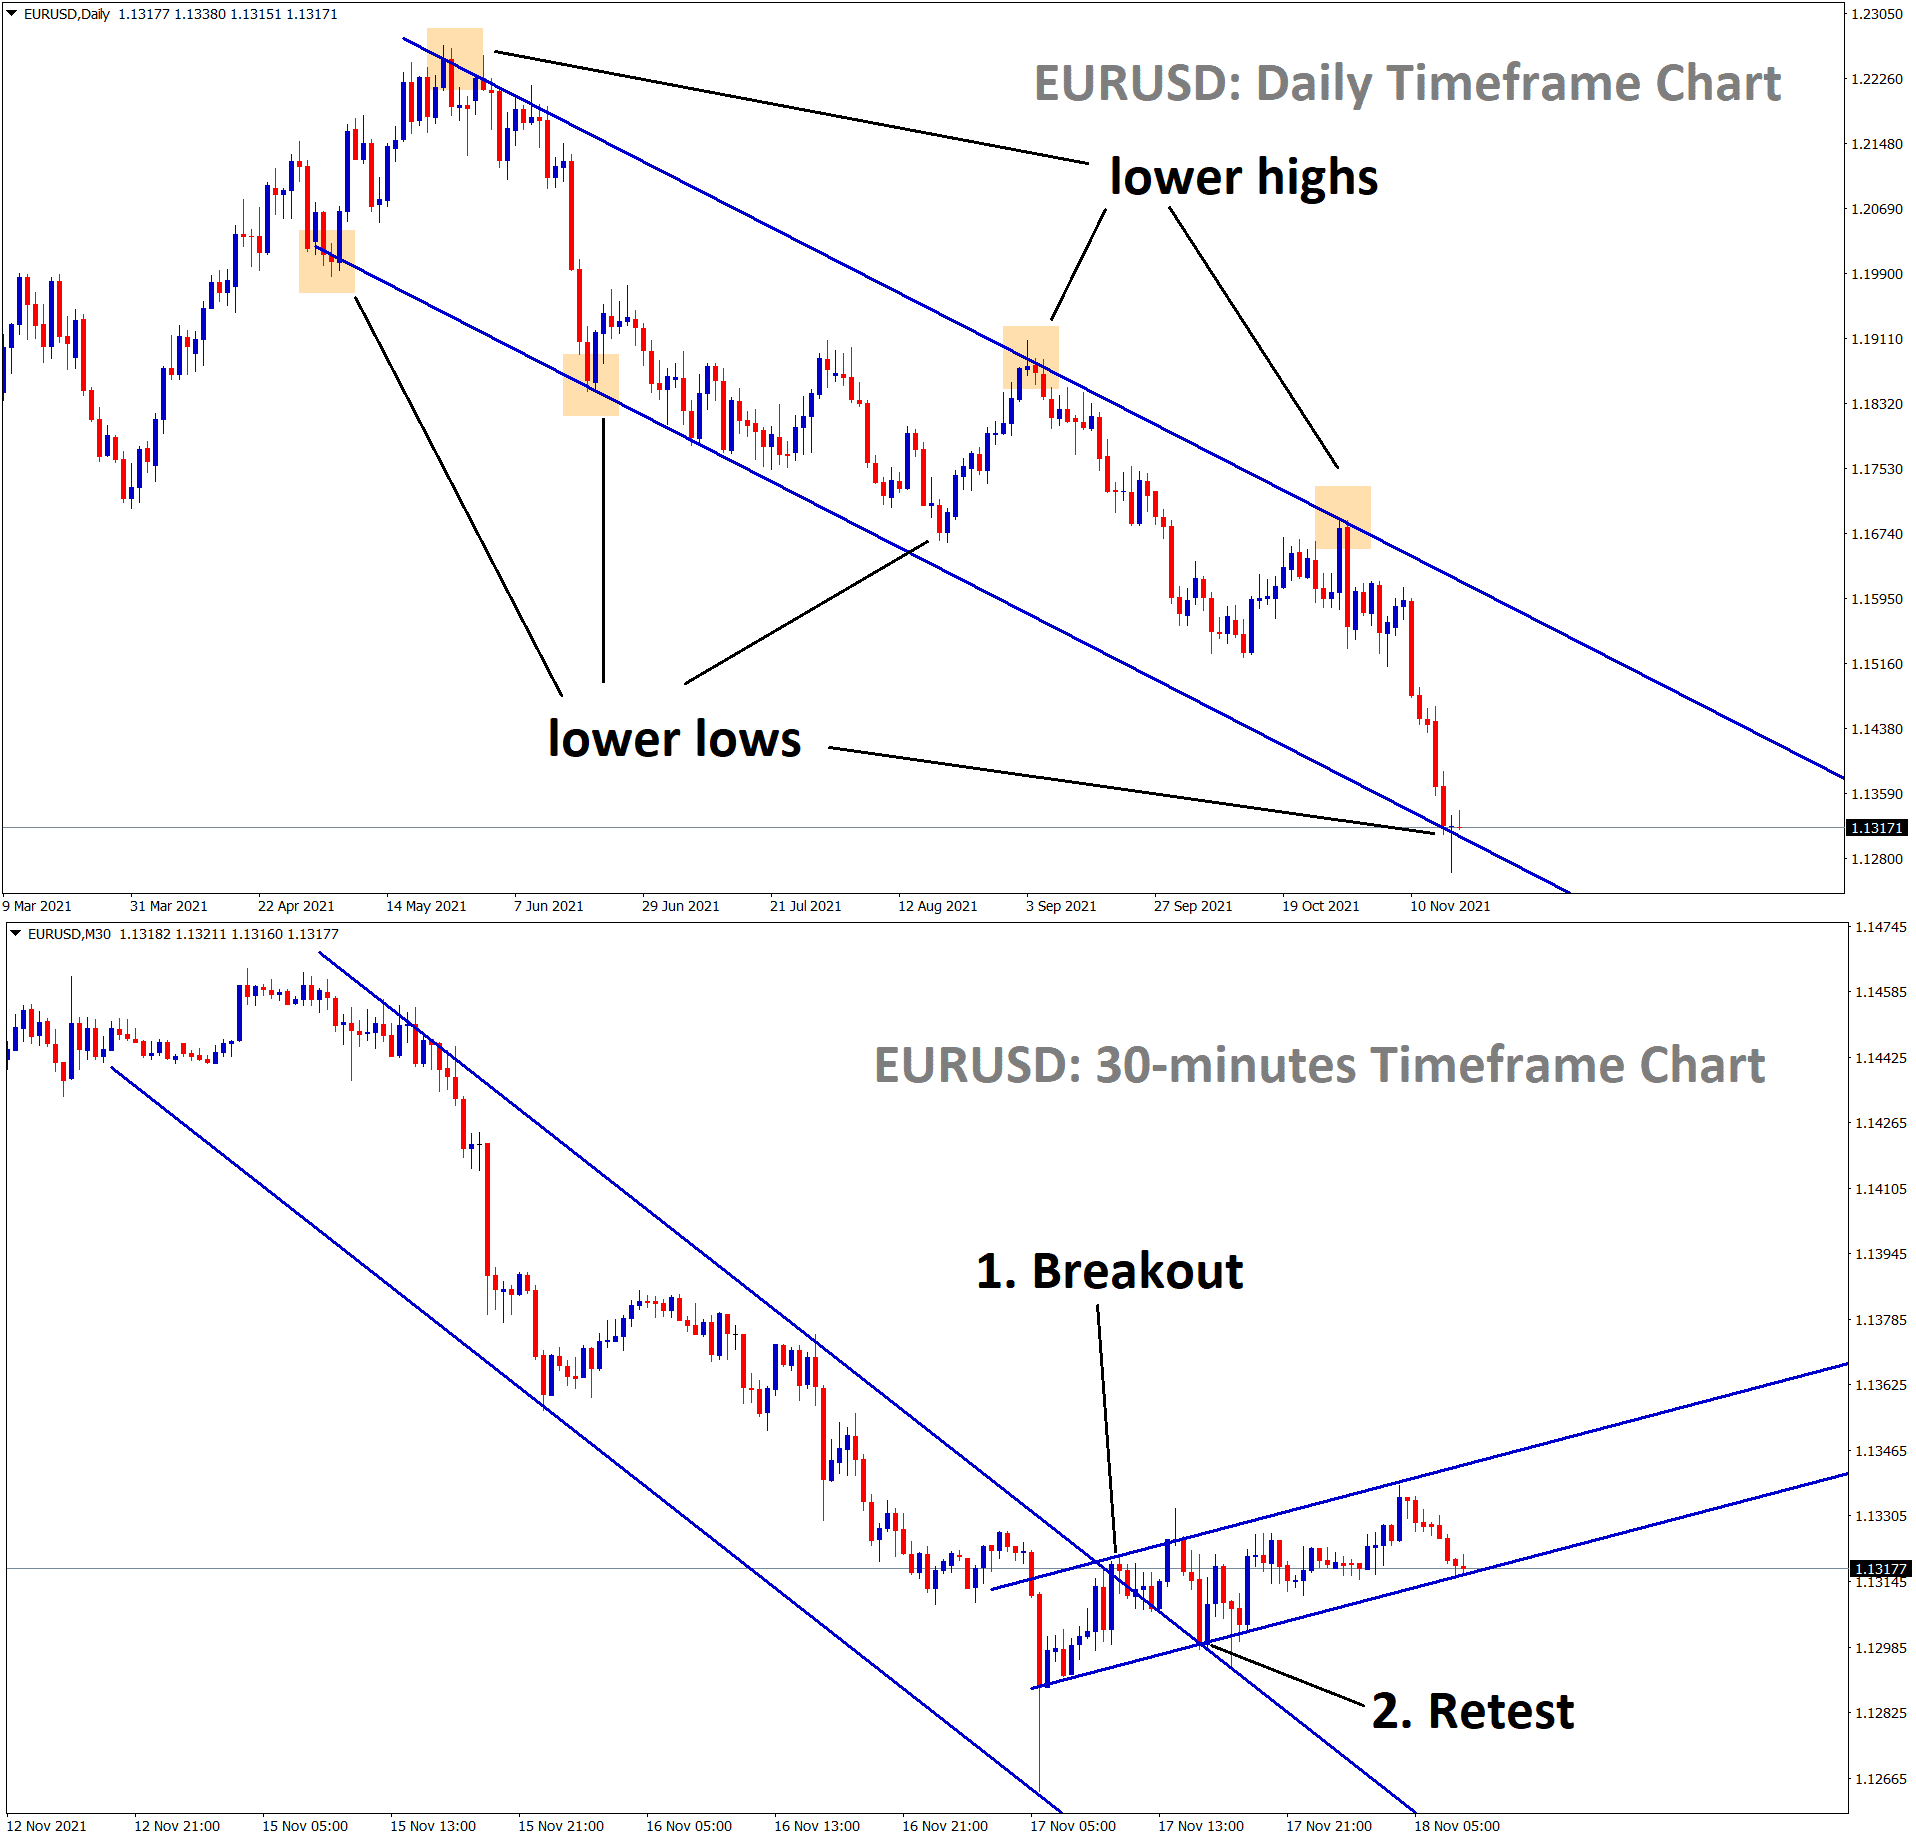
In 1 hour chart, USDCHF has broken the bottom level of the Down Trend line and it’s retesting the breakout level now.
If you like to receive the best forex signals at good trade setup, you can Try free forex signals. (or) if you need additional important trade signals with high accuracy, Join now in Supreme or Premium forex signals plan.
If you want to learn trading from 20+ years expert traders, Join forex trading course online now.
Thank you.

