audusd long term
-
+2950 Points Reached in AUDUSD Buy signal after rebounding from the major historical support area
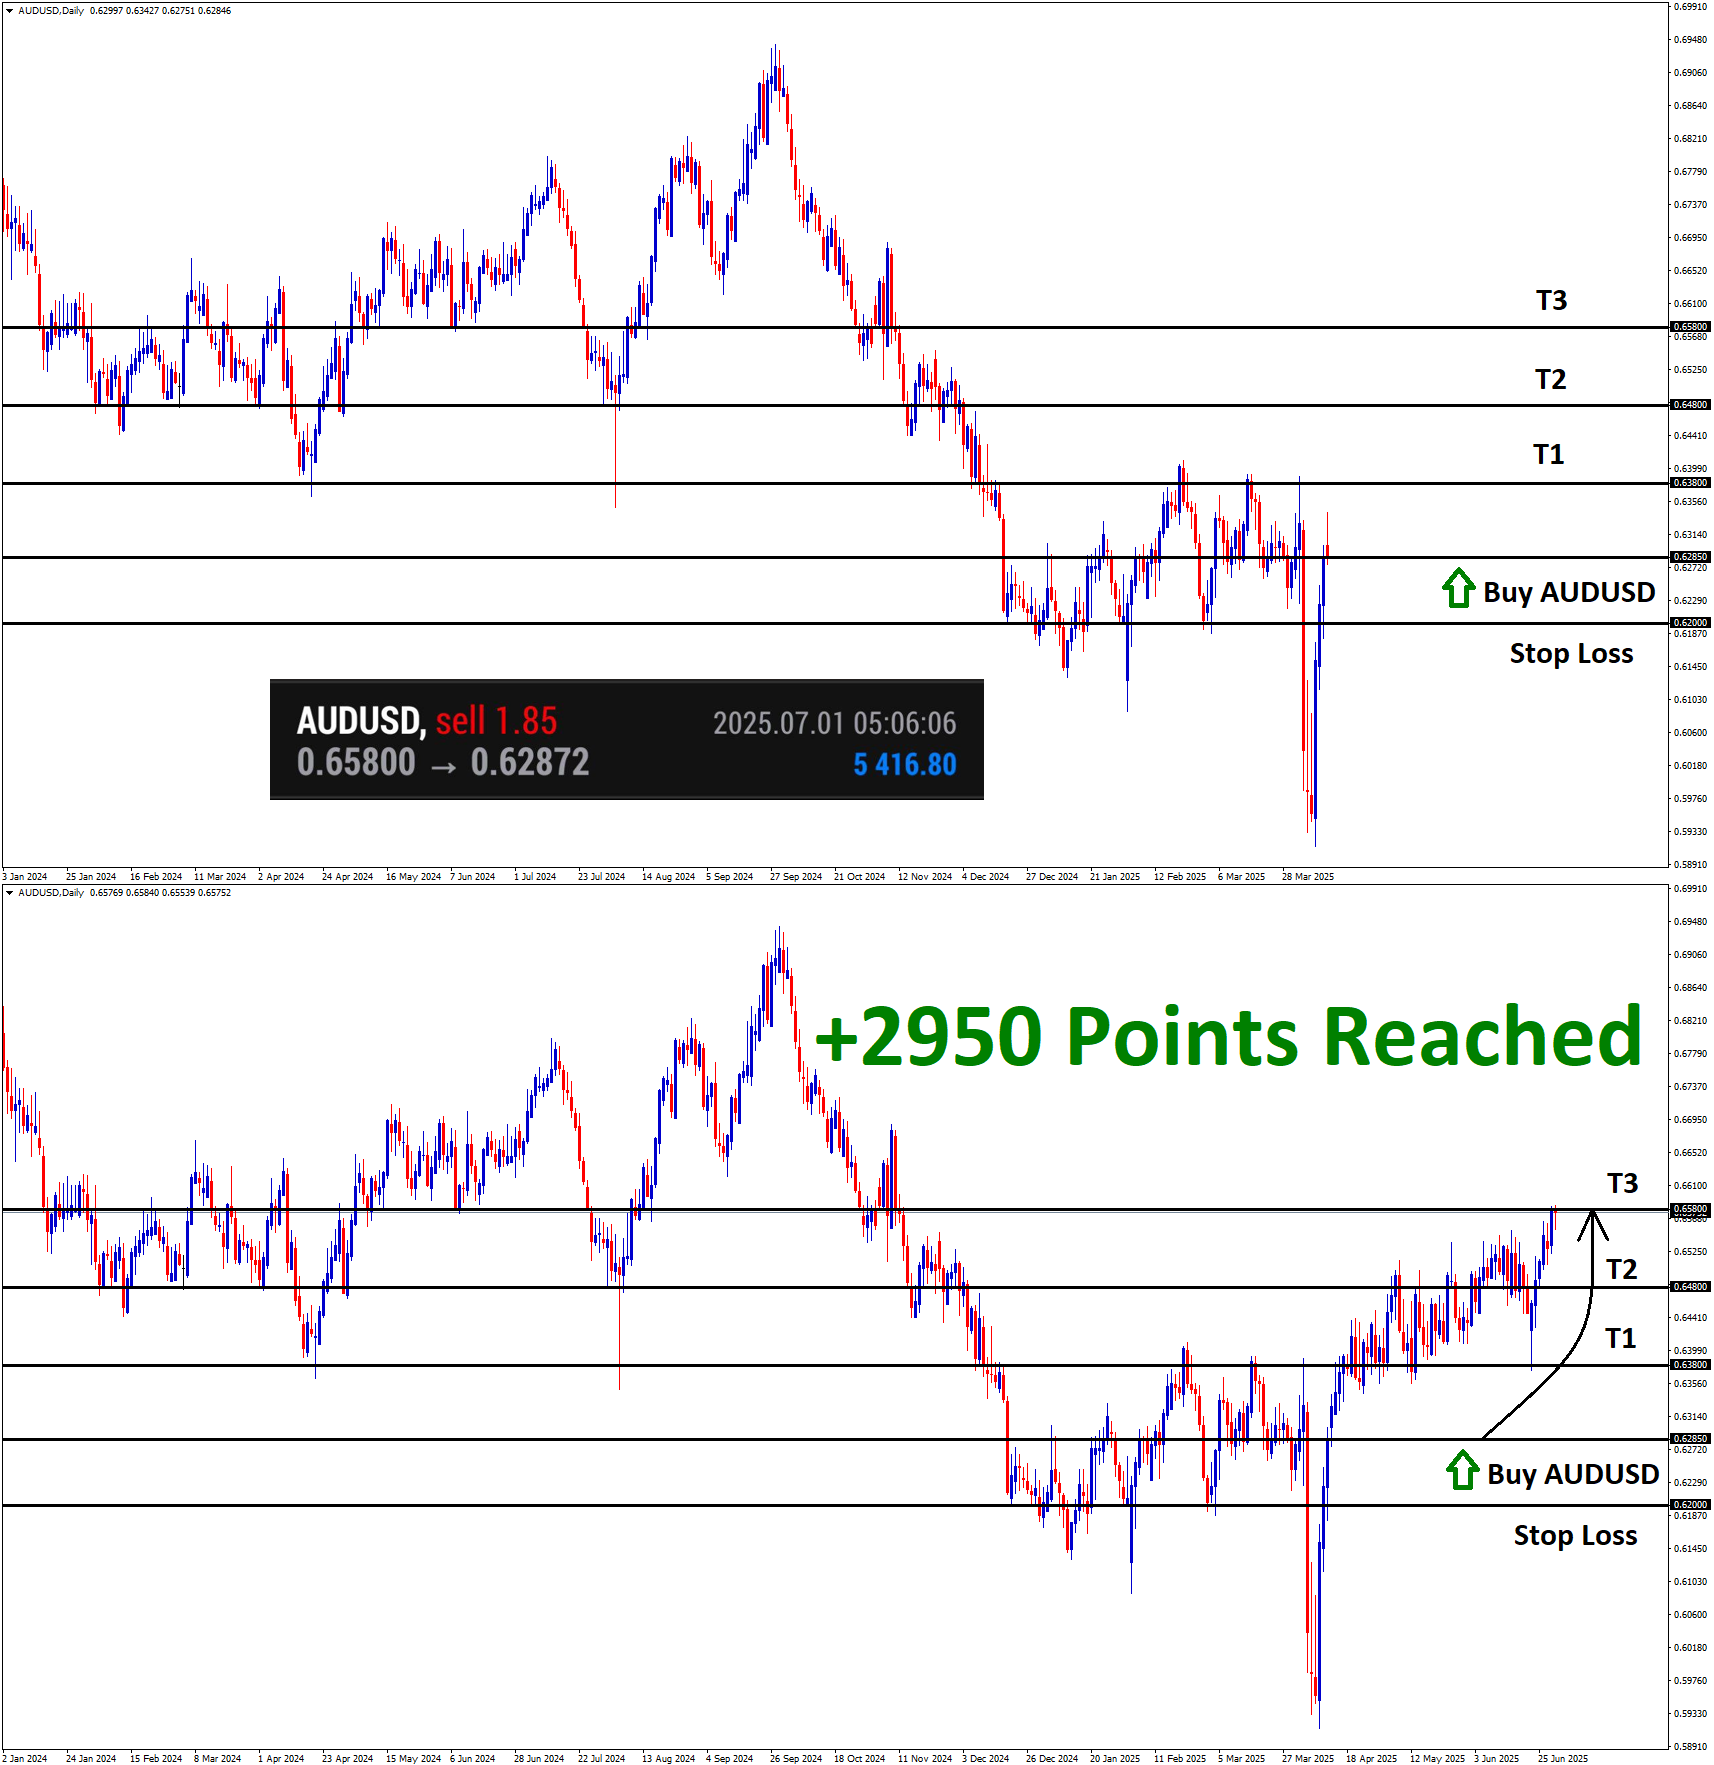
AUDUSD Analysis AUDUSD is rebounding from the major historical support area After the confirmation of the Upward movement, AUDUSD Buy…
-
+1950 Points Reached in AUDUSD Buy signal after rebounding from the major historical support area
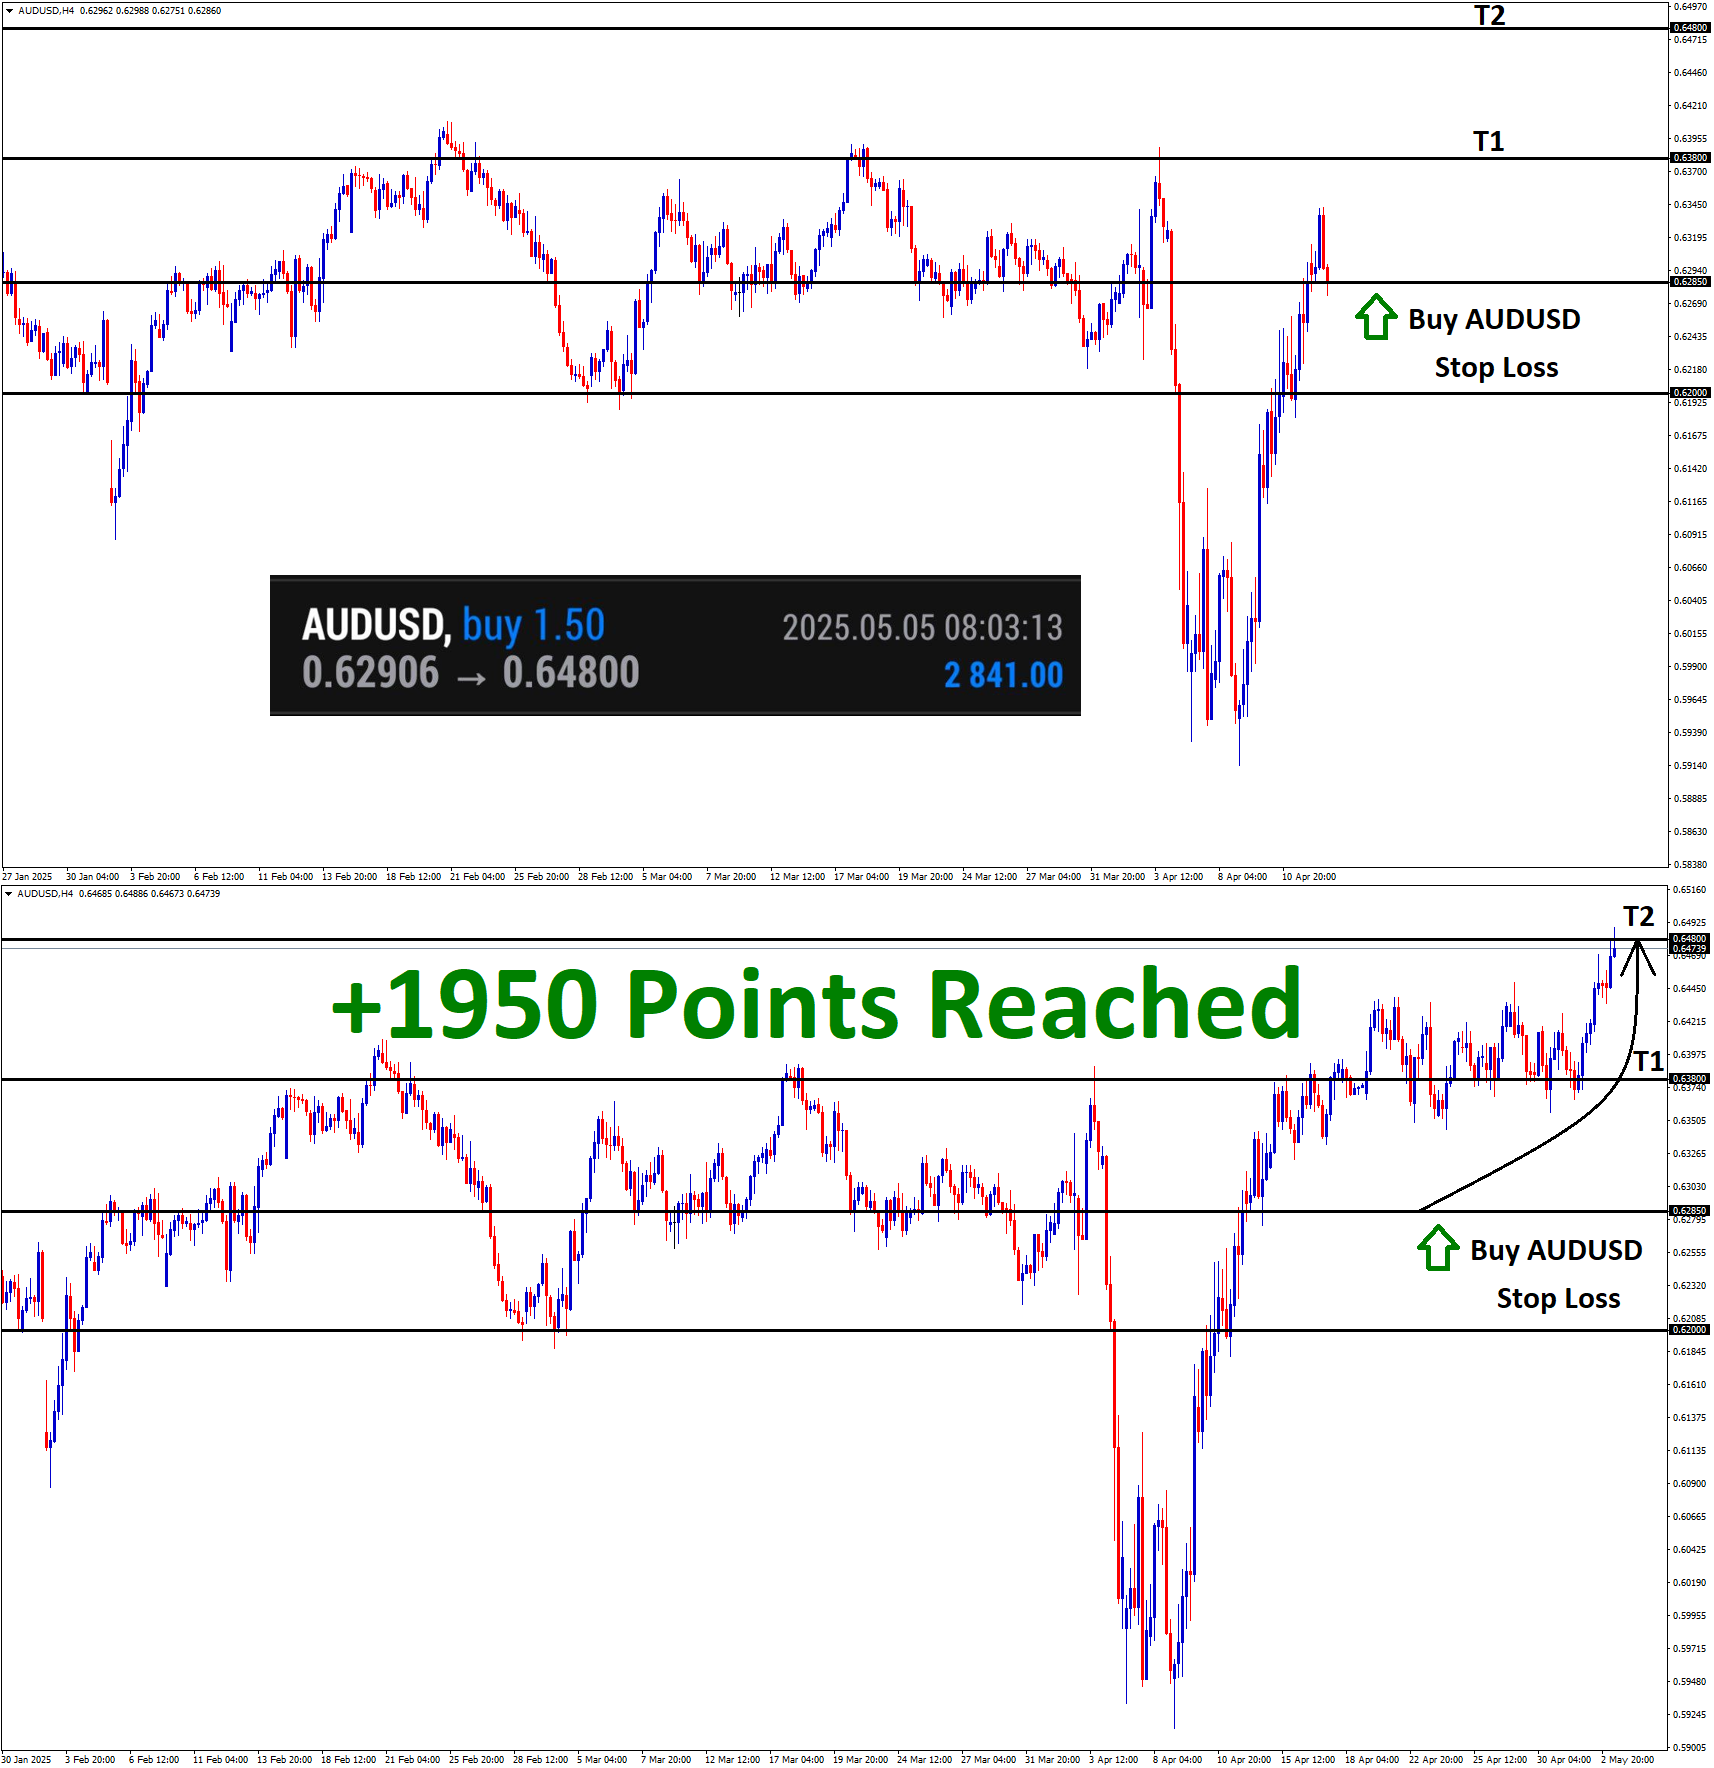
AUDUSD Analysis AUDUSD is rebounding from the major historical support area After the confirmation of the Upward movement, AUDUSD Buy…
-
+2920 Points Reached in AUDUSD Sell Signal after falling from the lower high area
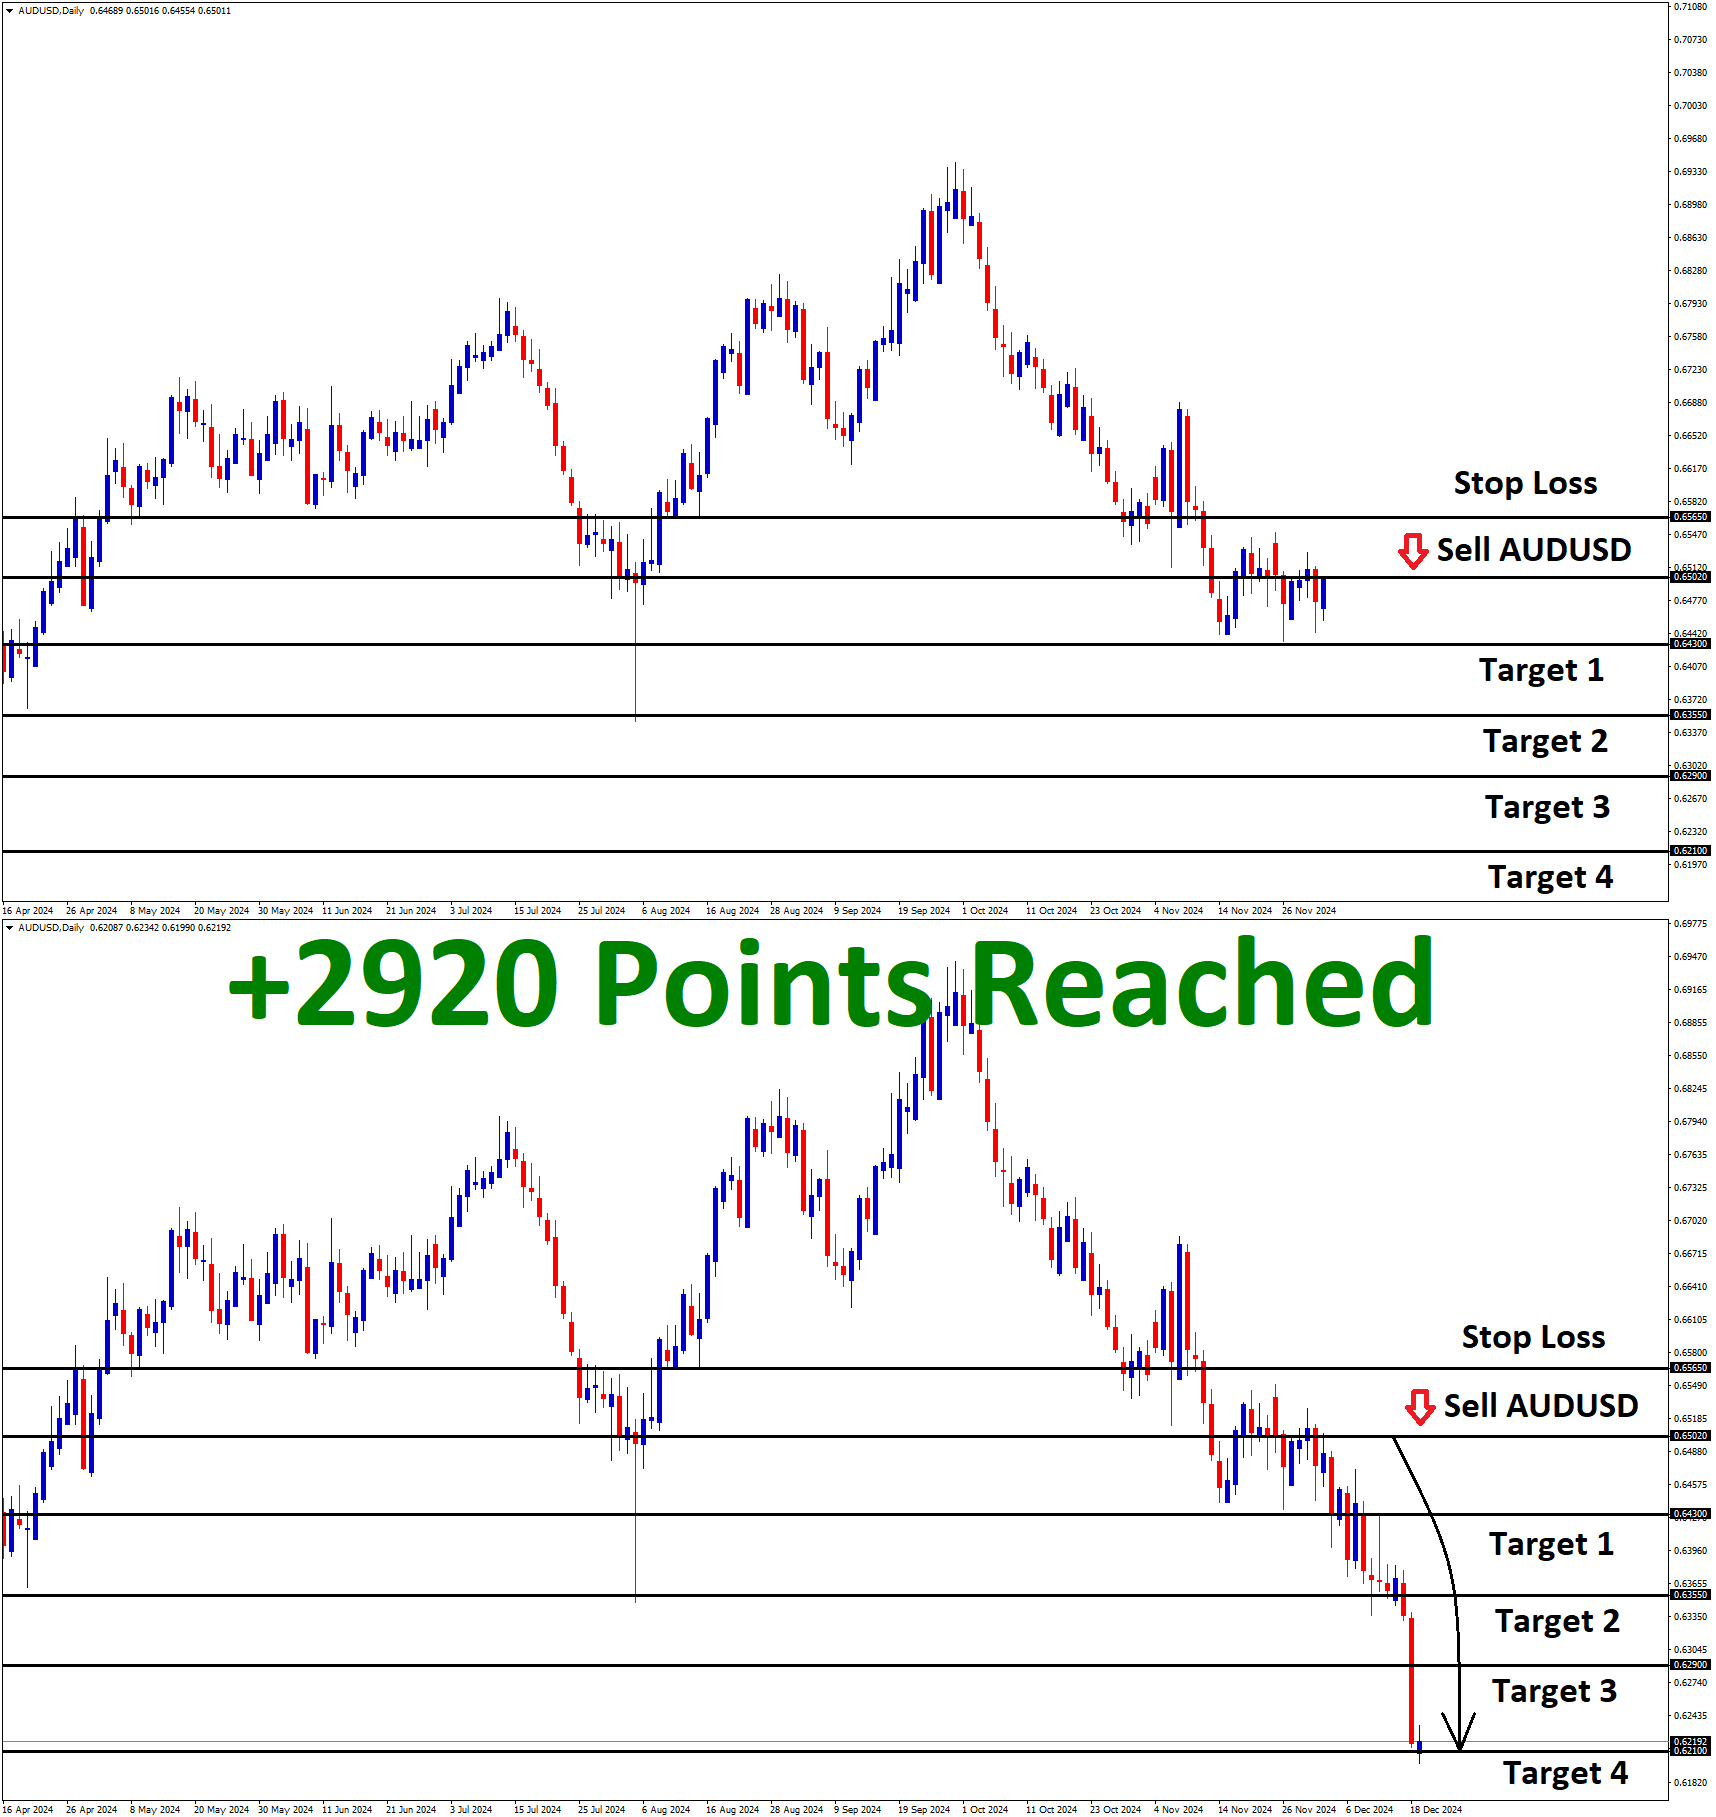
AUDUSD Analysis AUDUSD is falling from the lower high area of the descending channel on the 4-hour timeframe chart and…
-
+2120 Points Reached in AUDUSD Sell Signal after falling from the lower high area
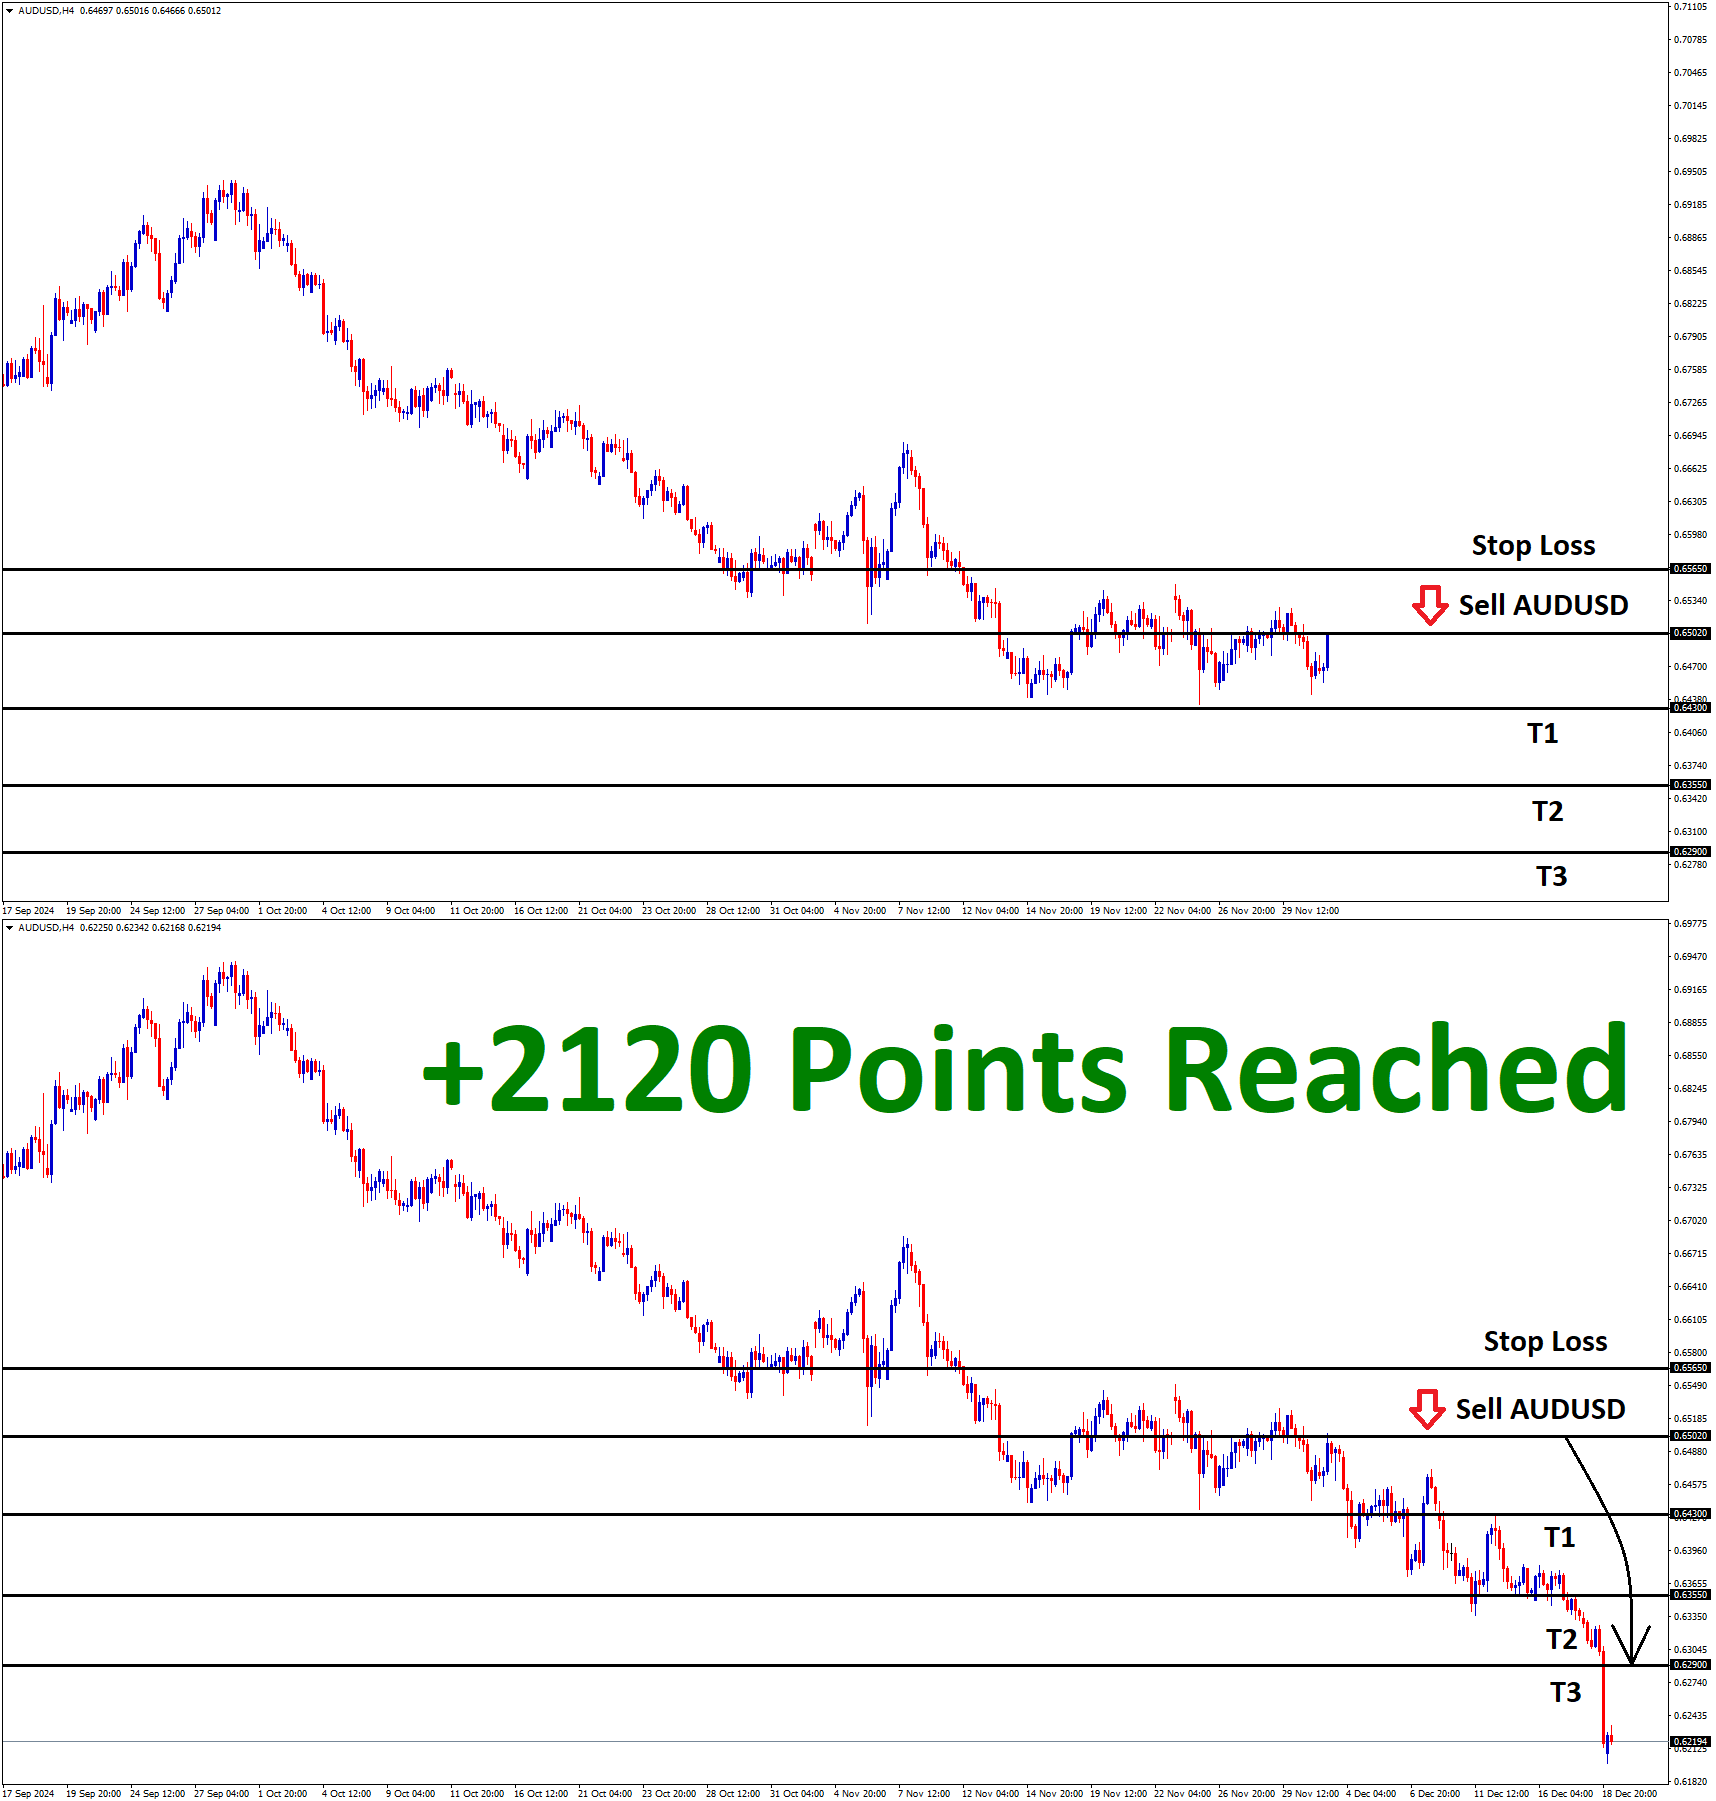
AUDUSD Analysis AUDUSD is falling from the lower high area of the descending channel on the 4-hour timeframe chart and…
-
+1470 Points Reached in AUDUSD Sell Signal after falling from the lower high area

AUDUSD Analysis AUDUSD is falling from the lower high area of the descending channel on the 4-hour timeframe chart and…
-
+530 Points Reached in AUDUSD Sell Signal after falling from the lower high area of the downtrend
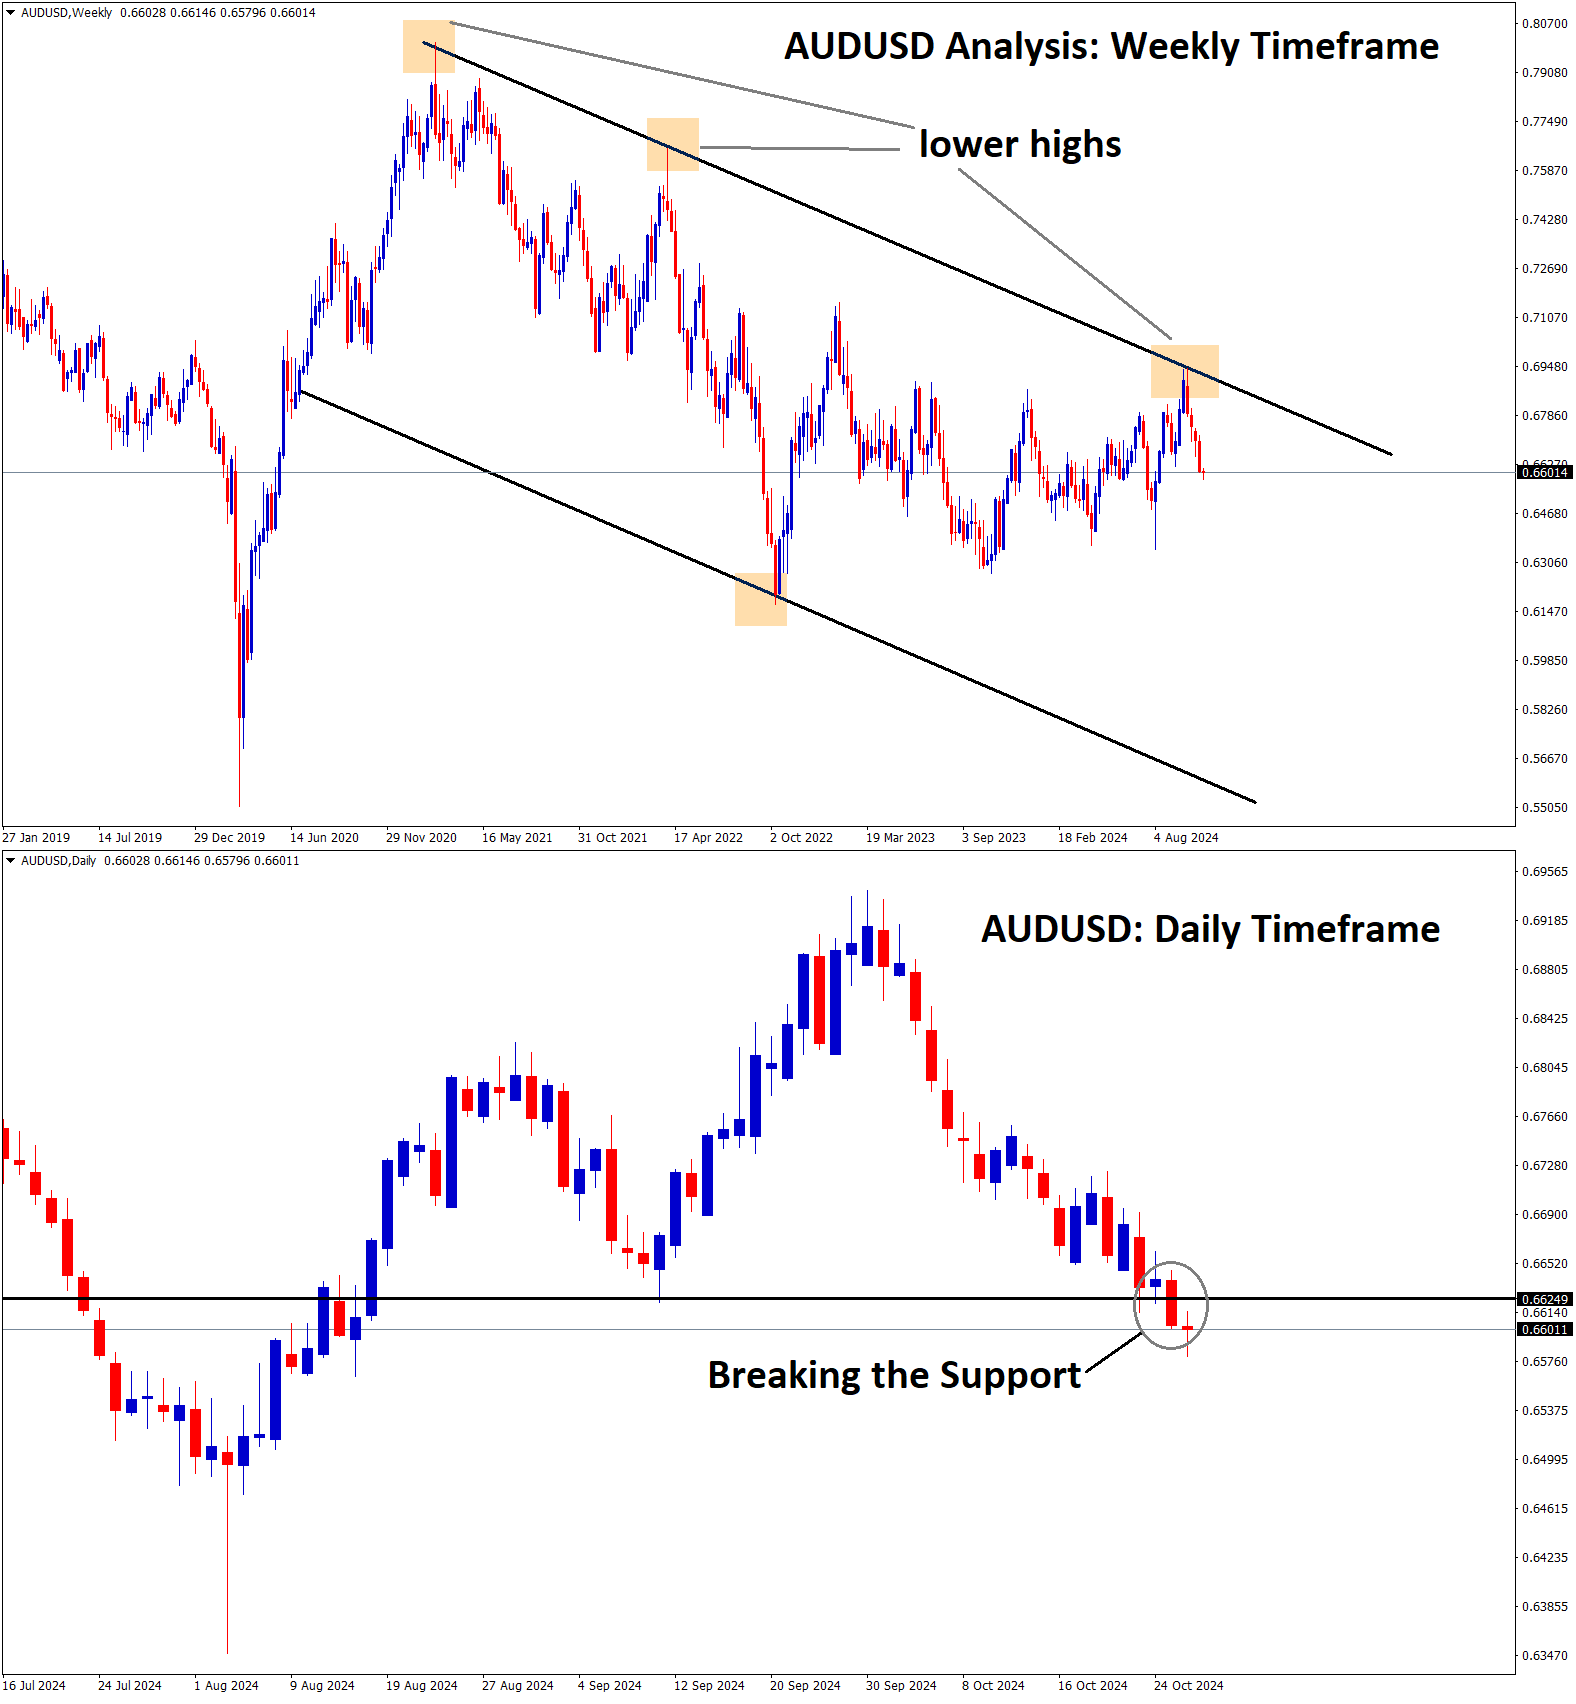
AUDUSD Analysis AUDUSD is falling from the lower high area of the downtrend line in the higher timeframe weekly chart.…
-
+1120 Points Reached in AUDUSD Buy signal after breaking the horizontal resistance area
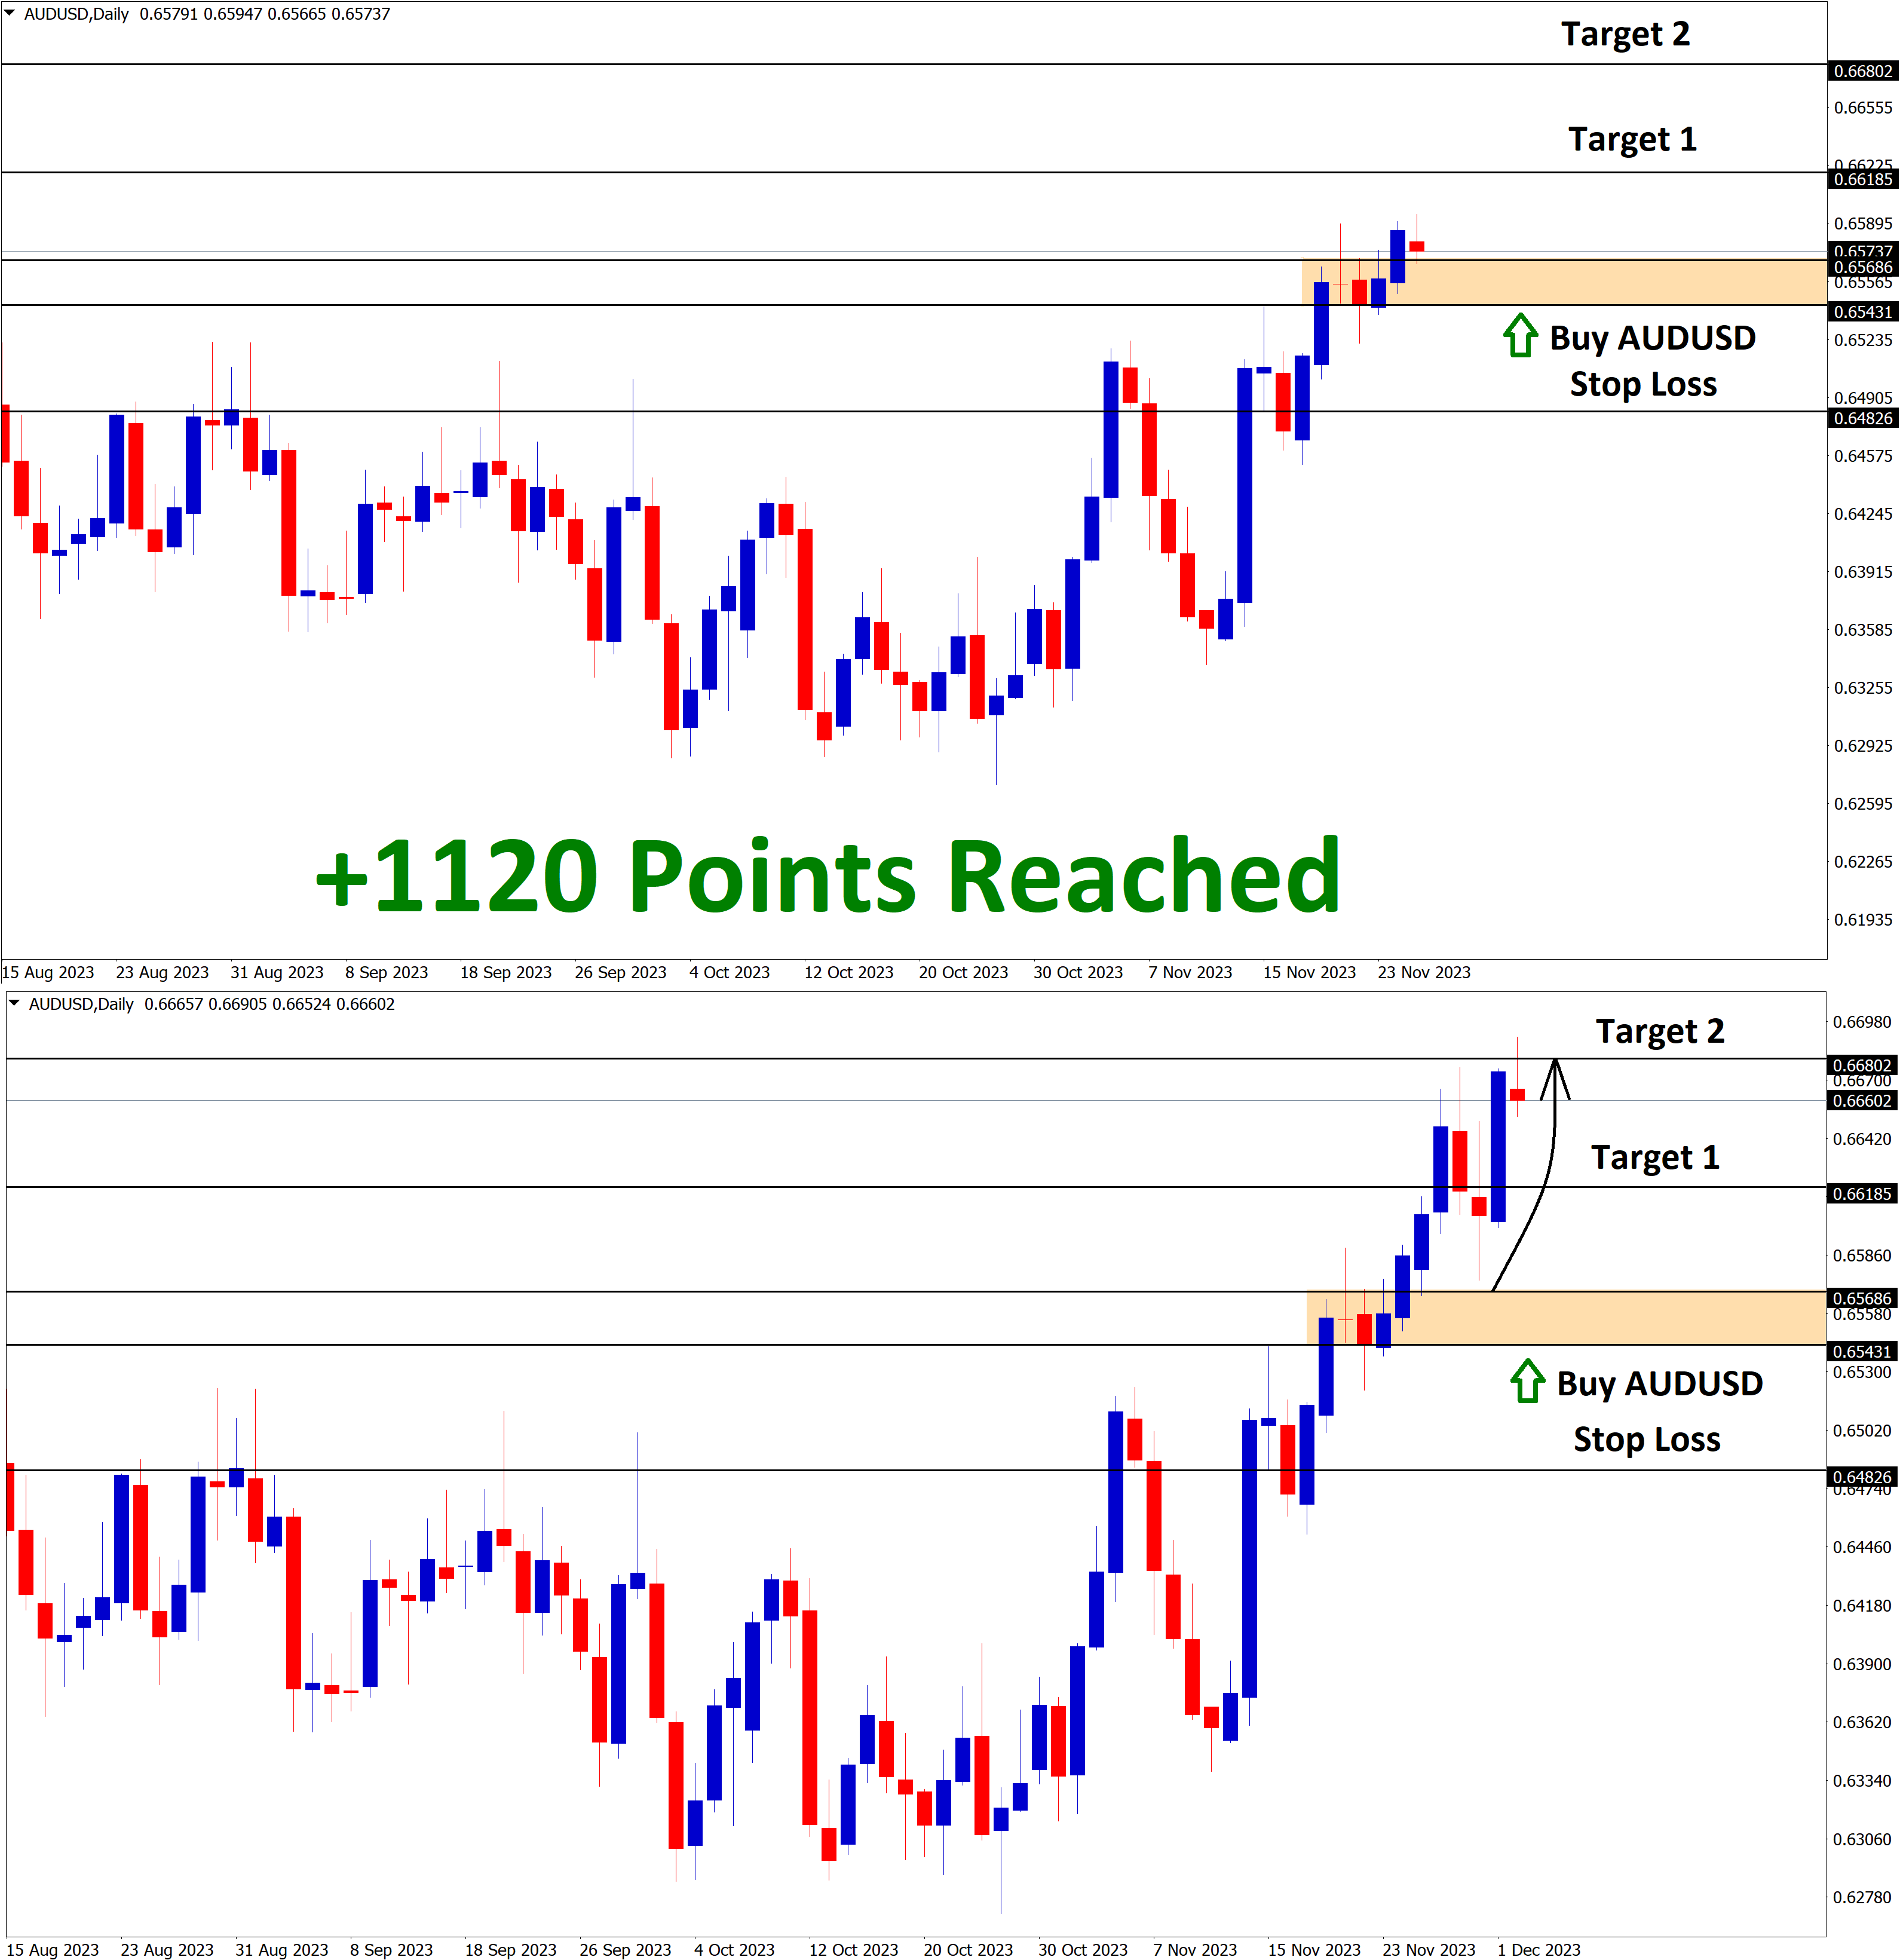
AUDUSD Analysis: [caption id="attachment_473933" align="alignnone" width="3195"] audusd resistane breakout[/caption] AUDUSD has broken the horizontal resistance area in the 4-hour timeframe…
-
+1240 points achieved in AUDUSD signal after breaking the horizontal support and starts to move in a descending channel
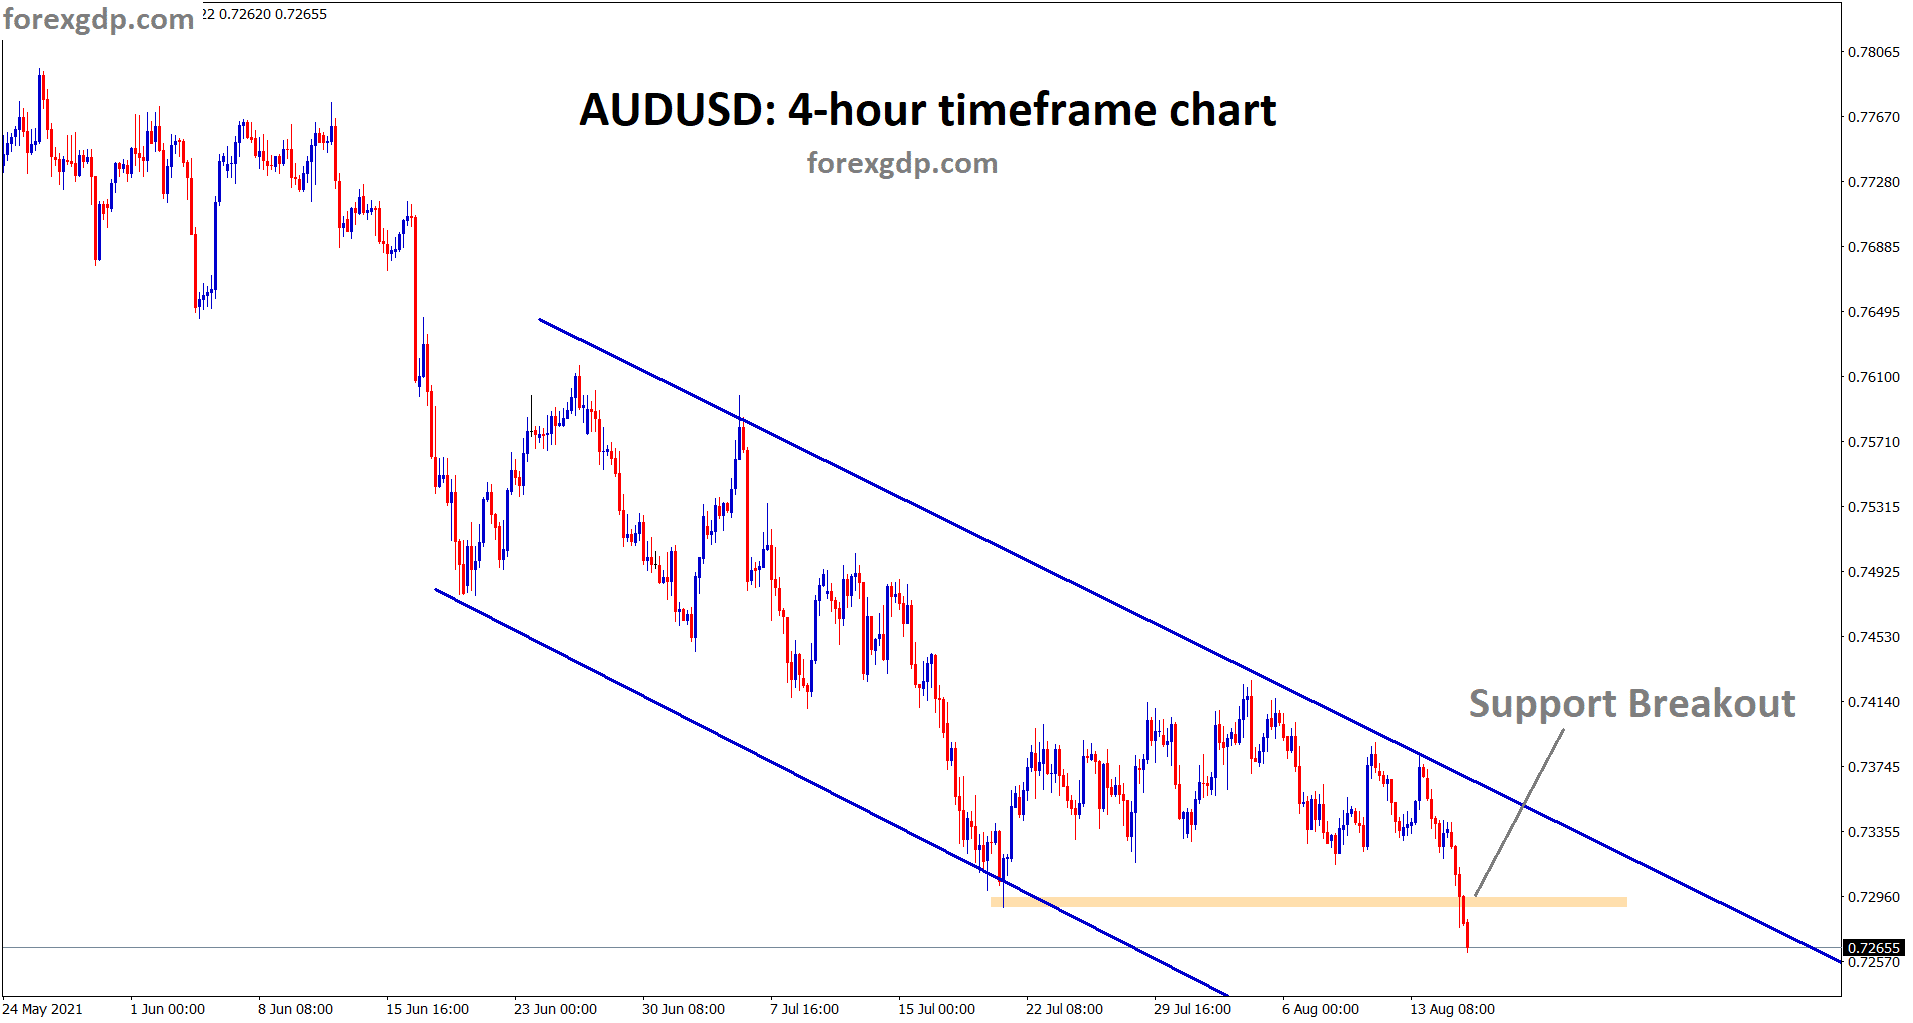
AUDUSD Analysis AUDUSD has broken the horizontal support and starts to move in a descending channel in the 4-hour timeframe…
-
Head and Shoulder Pattern has formed on AUDUSD
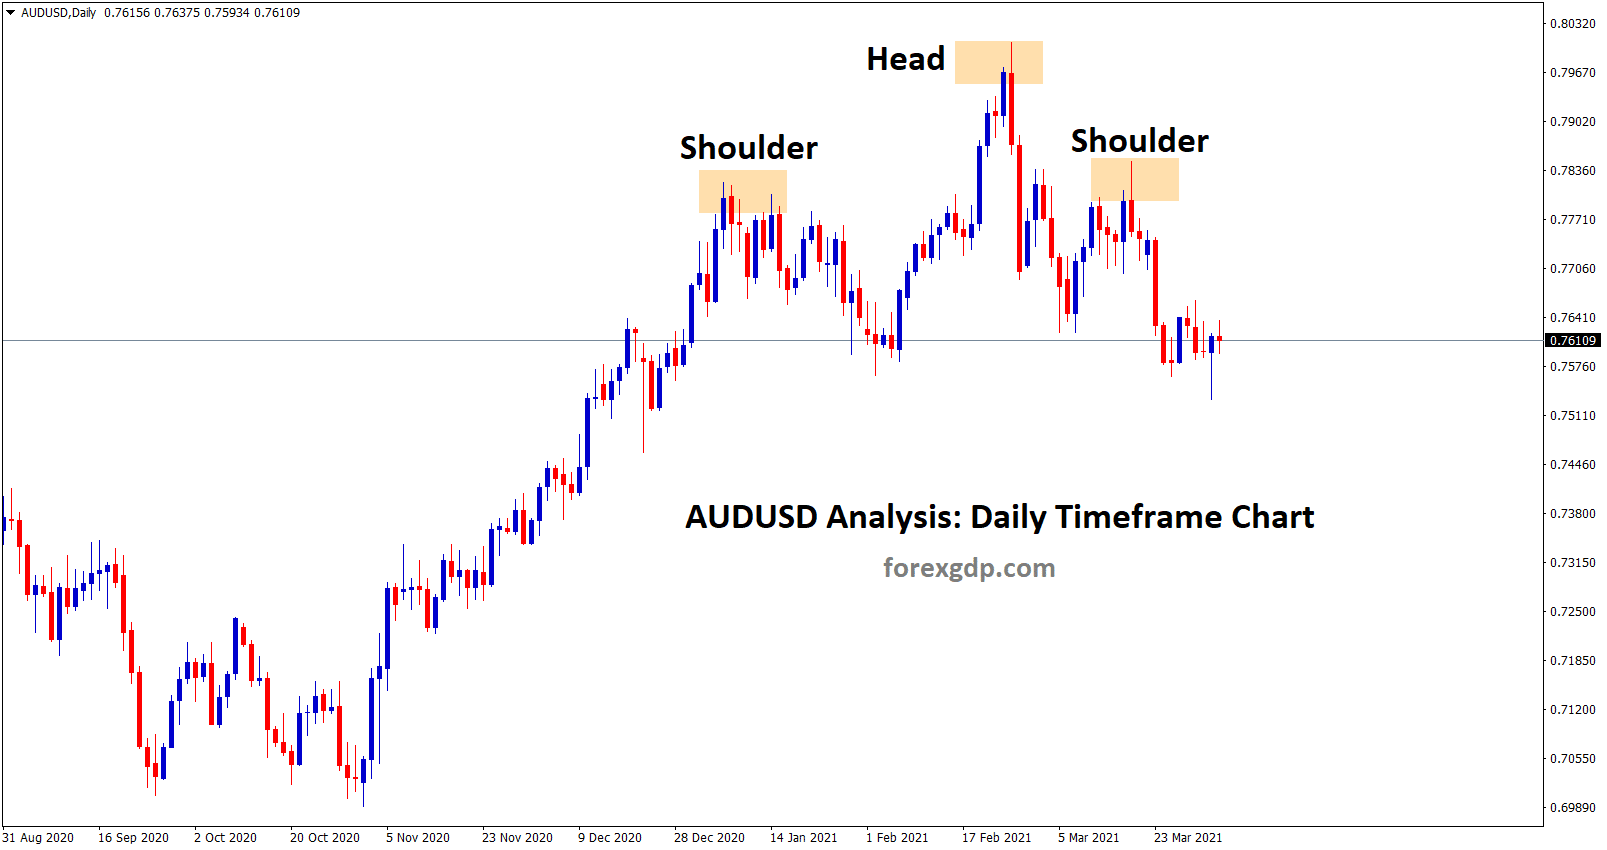
AUDUSD Analysis AUDUSD starts to fall by forming head and shoulder pattern in the daily timeframe chart. In another view,…
-
AUDUSD trying to fall? Is the AUD is weak?
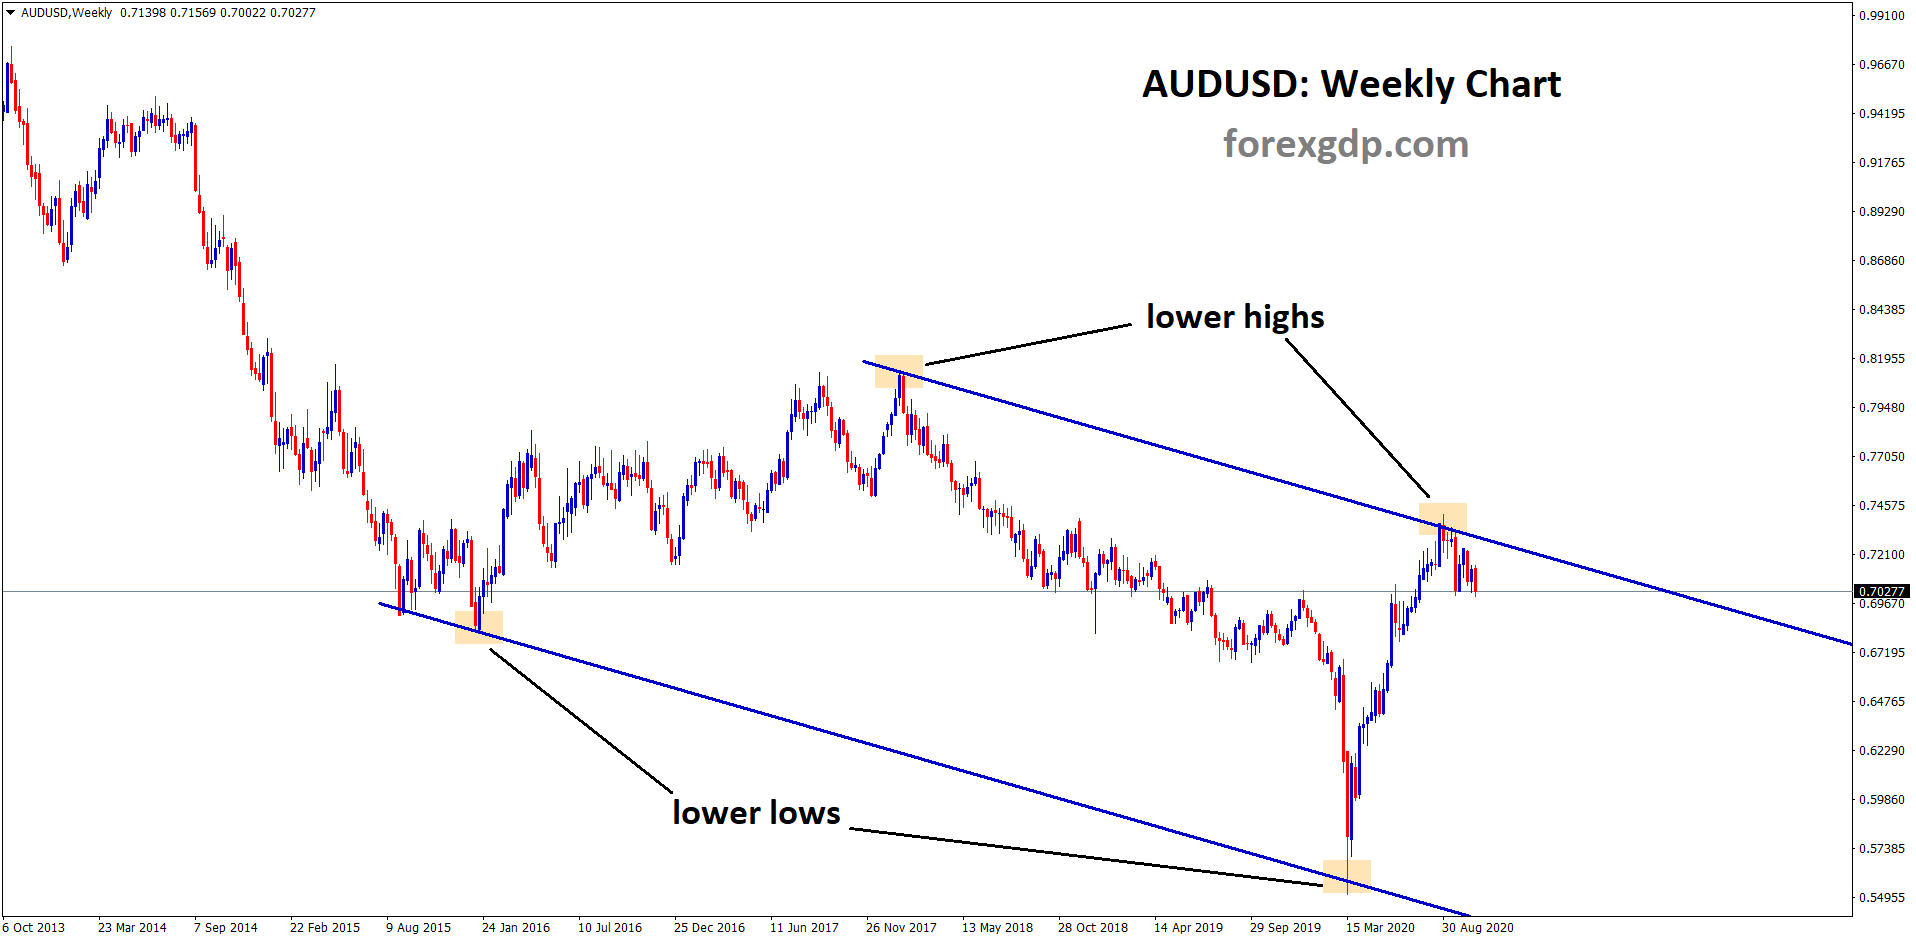
AUDUSD is trying to fall from the top zone of the downtrend line in the weekly timeframe chart. The Reserve…
-
+1100 Points Reached in the AUDUSD Sell Signal
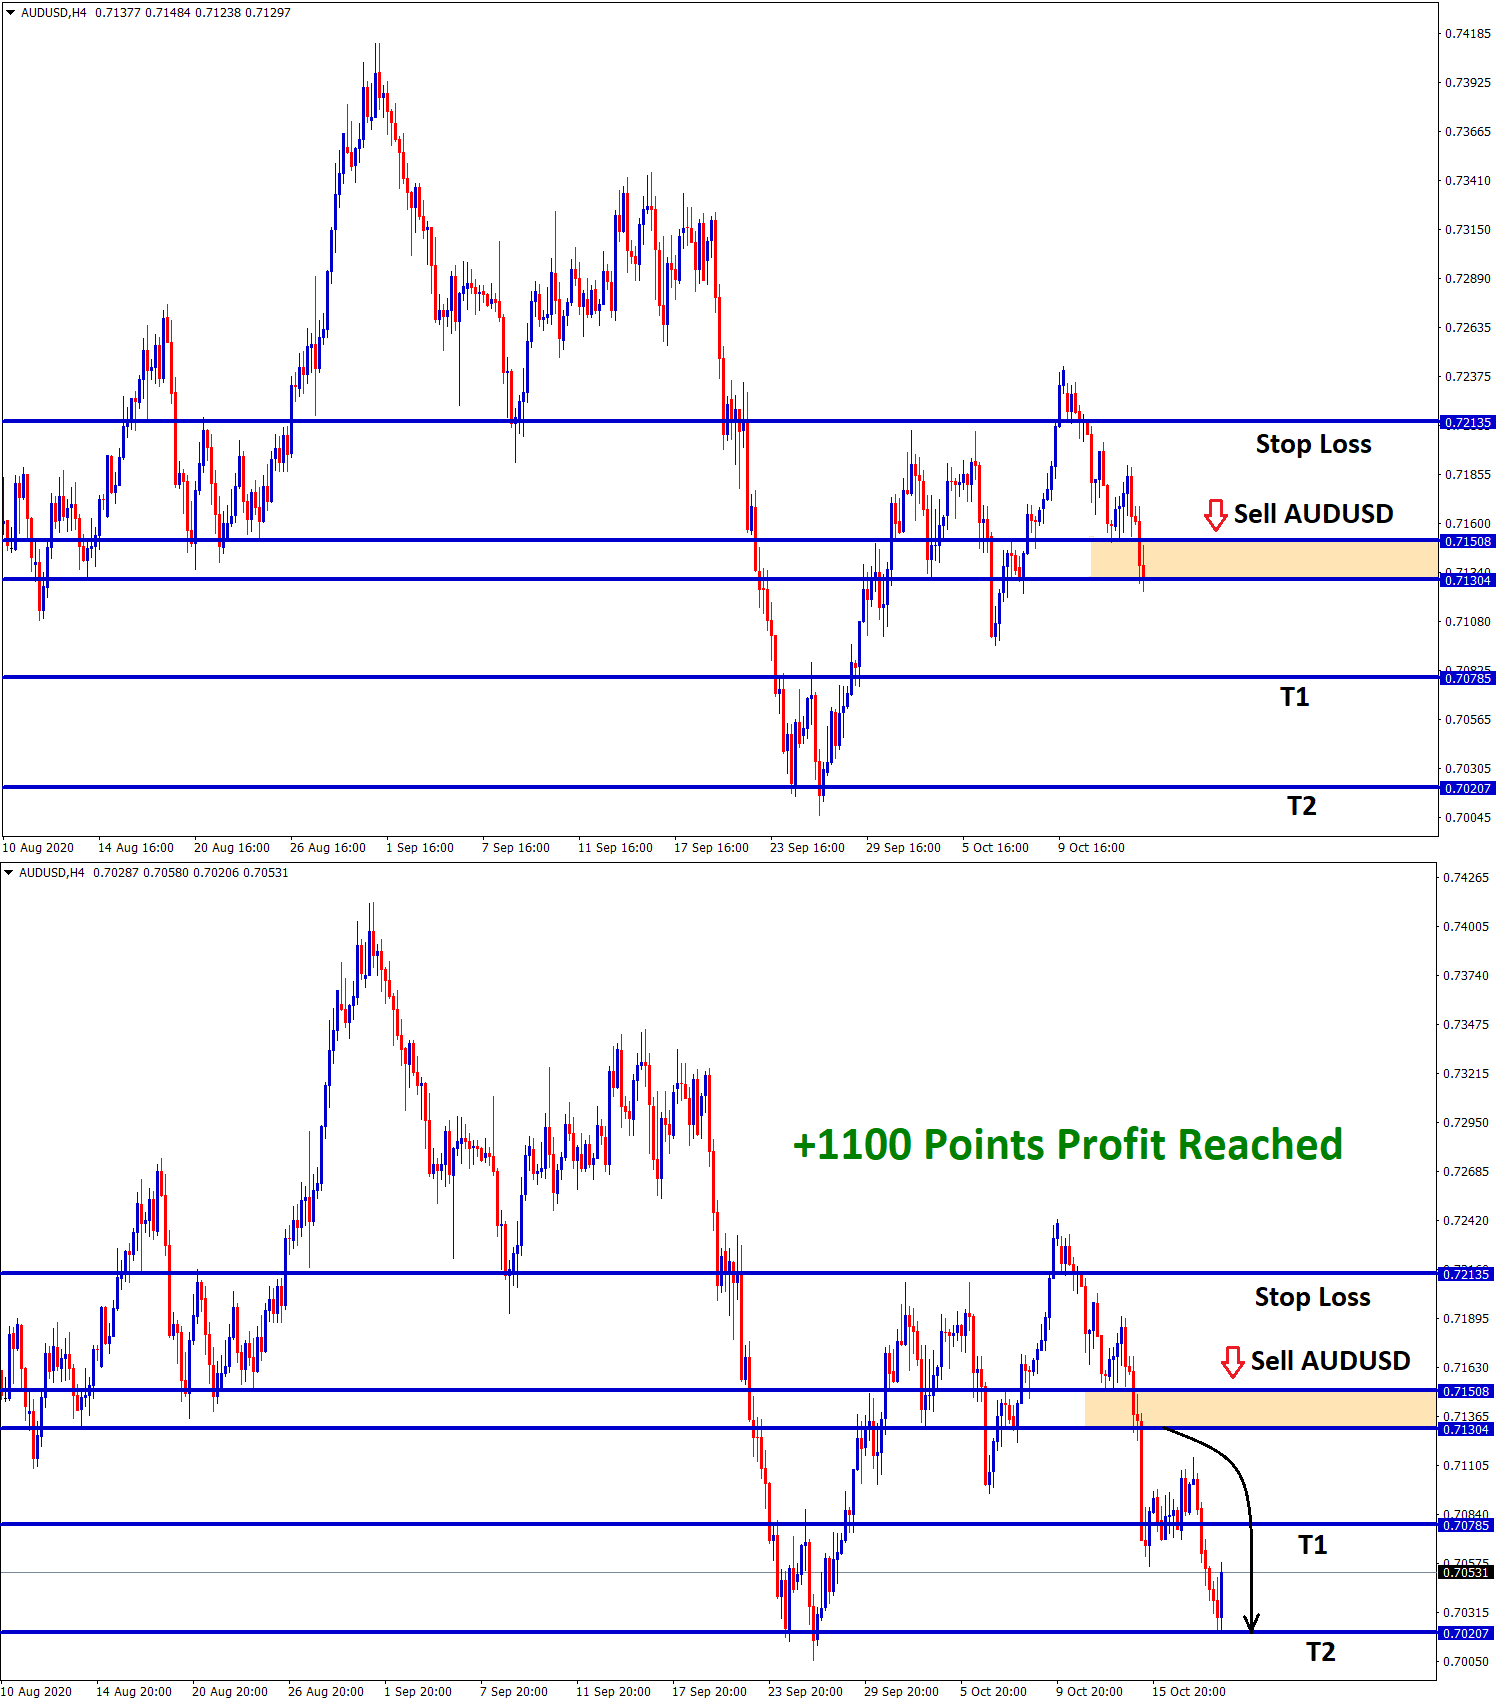
AUDUSD Technical Analysis AUDUSD is falling from the top zone of the downtrend line. The breakout happened at the bottom…
-
AUDUSD has broken the bottom of the Uptrend Line
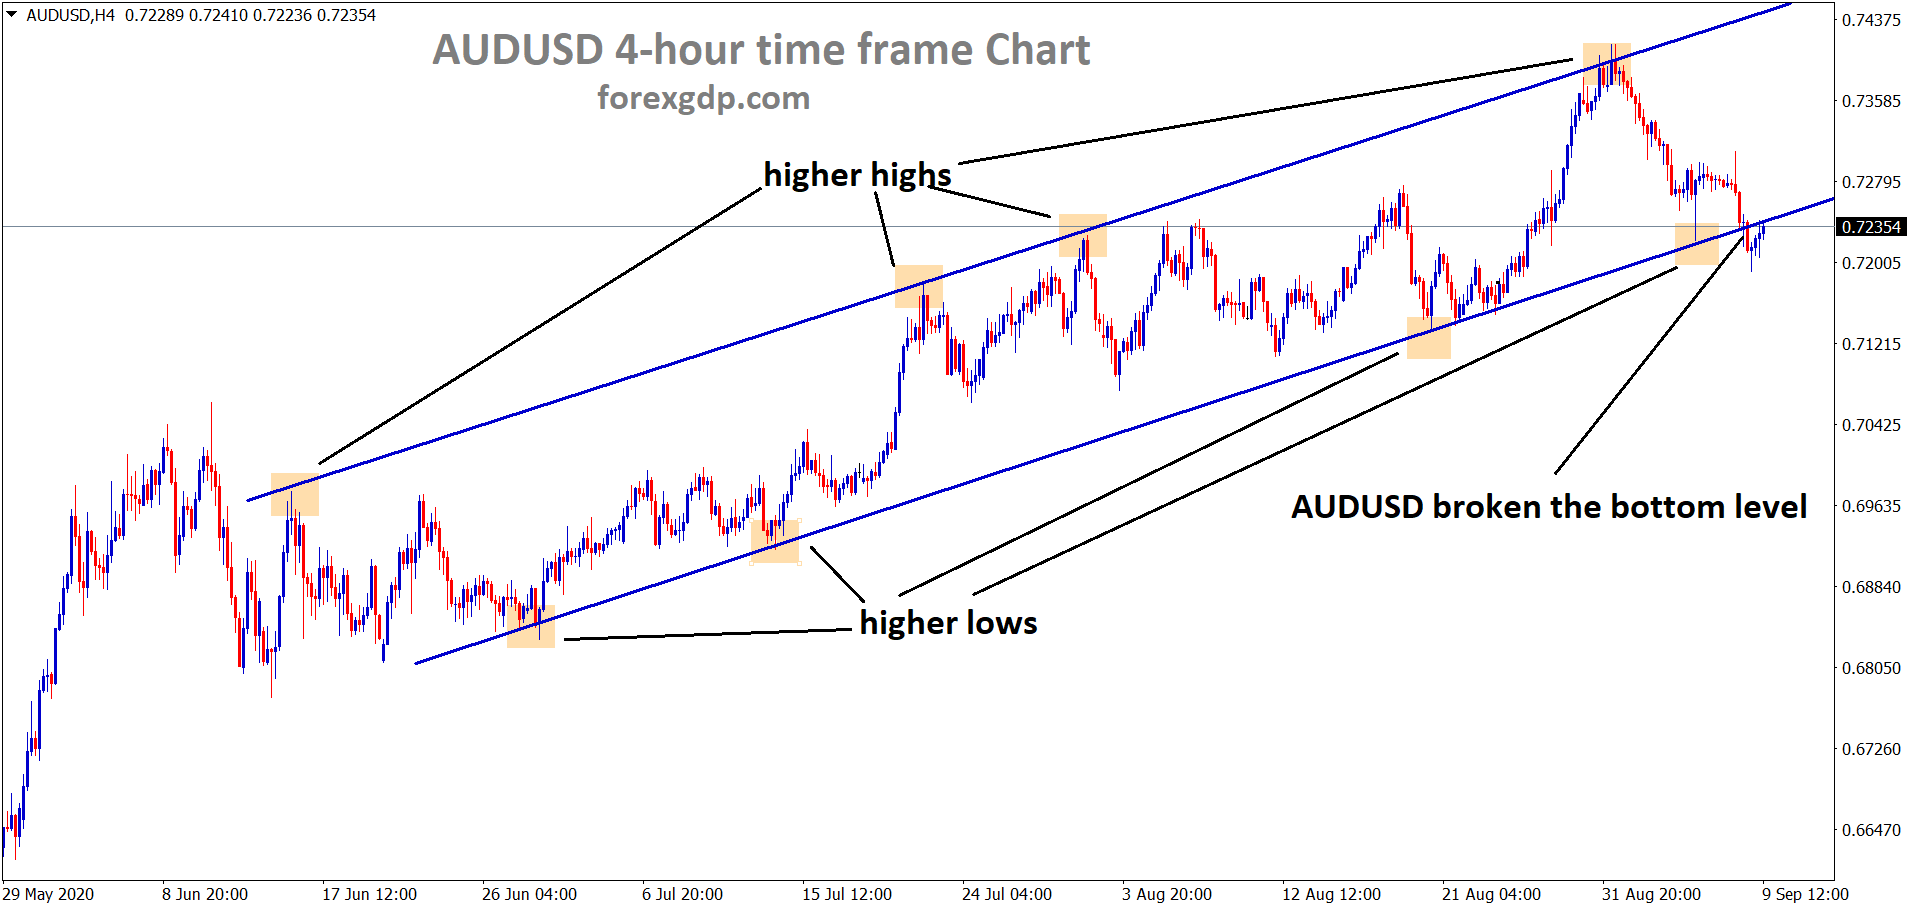
AUDUSD breakout Analysis In the 4-hour chart, AUDUSD has moved in an Uptrend by forming higher highs, higher lows. Now,…