gbpcad long term
-
+3600 Points Reached in GBPCAD Sell Signal after breaking the higher low area of the minor Ascending channel
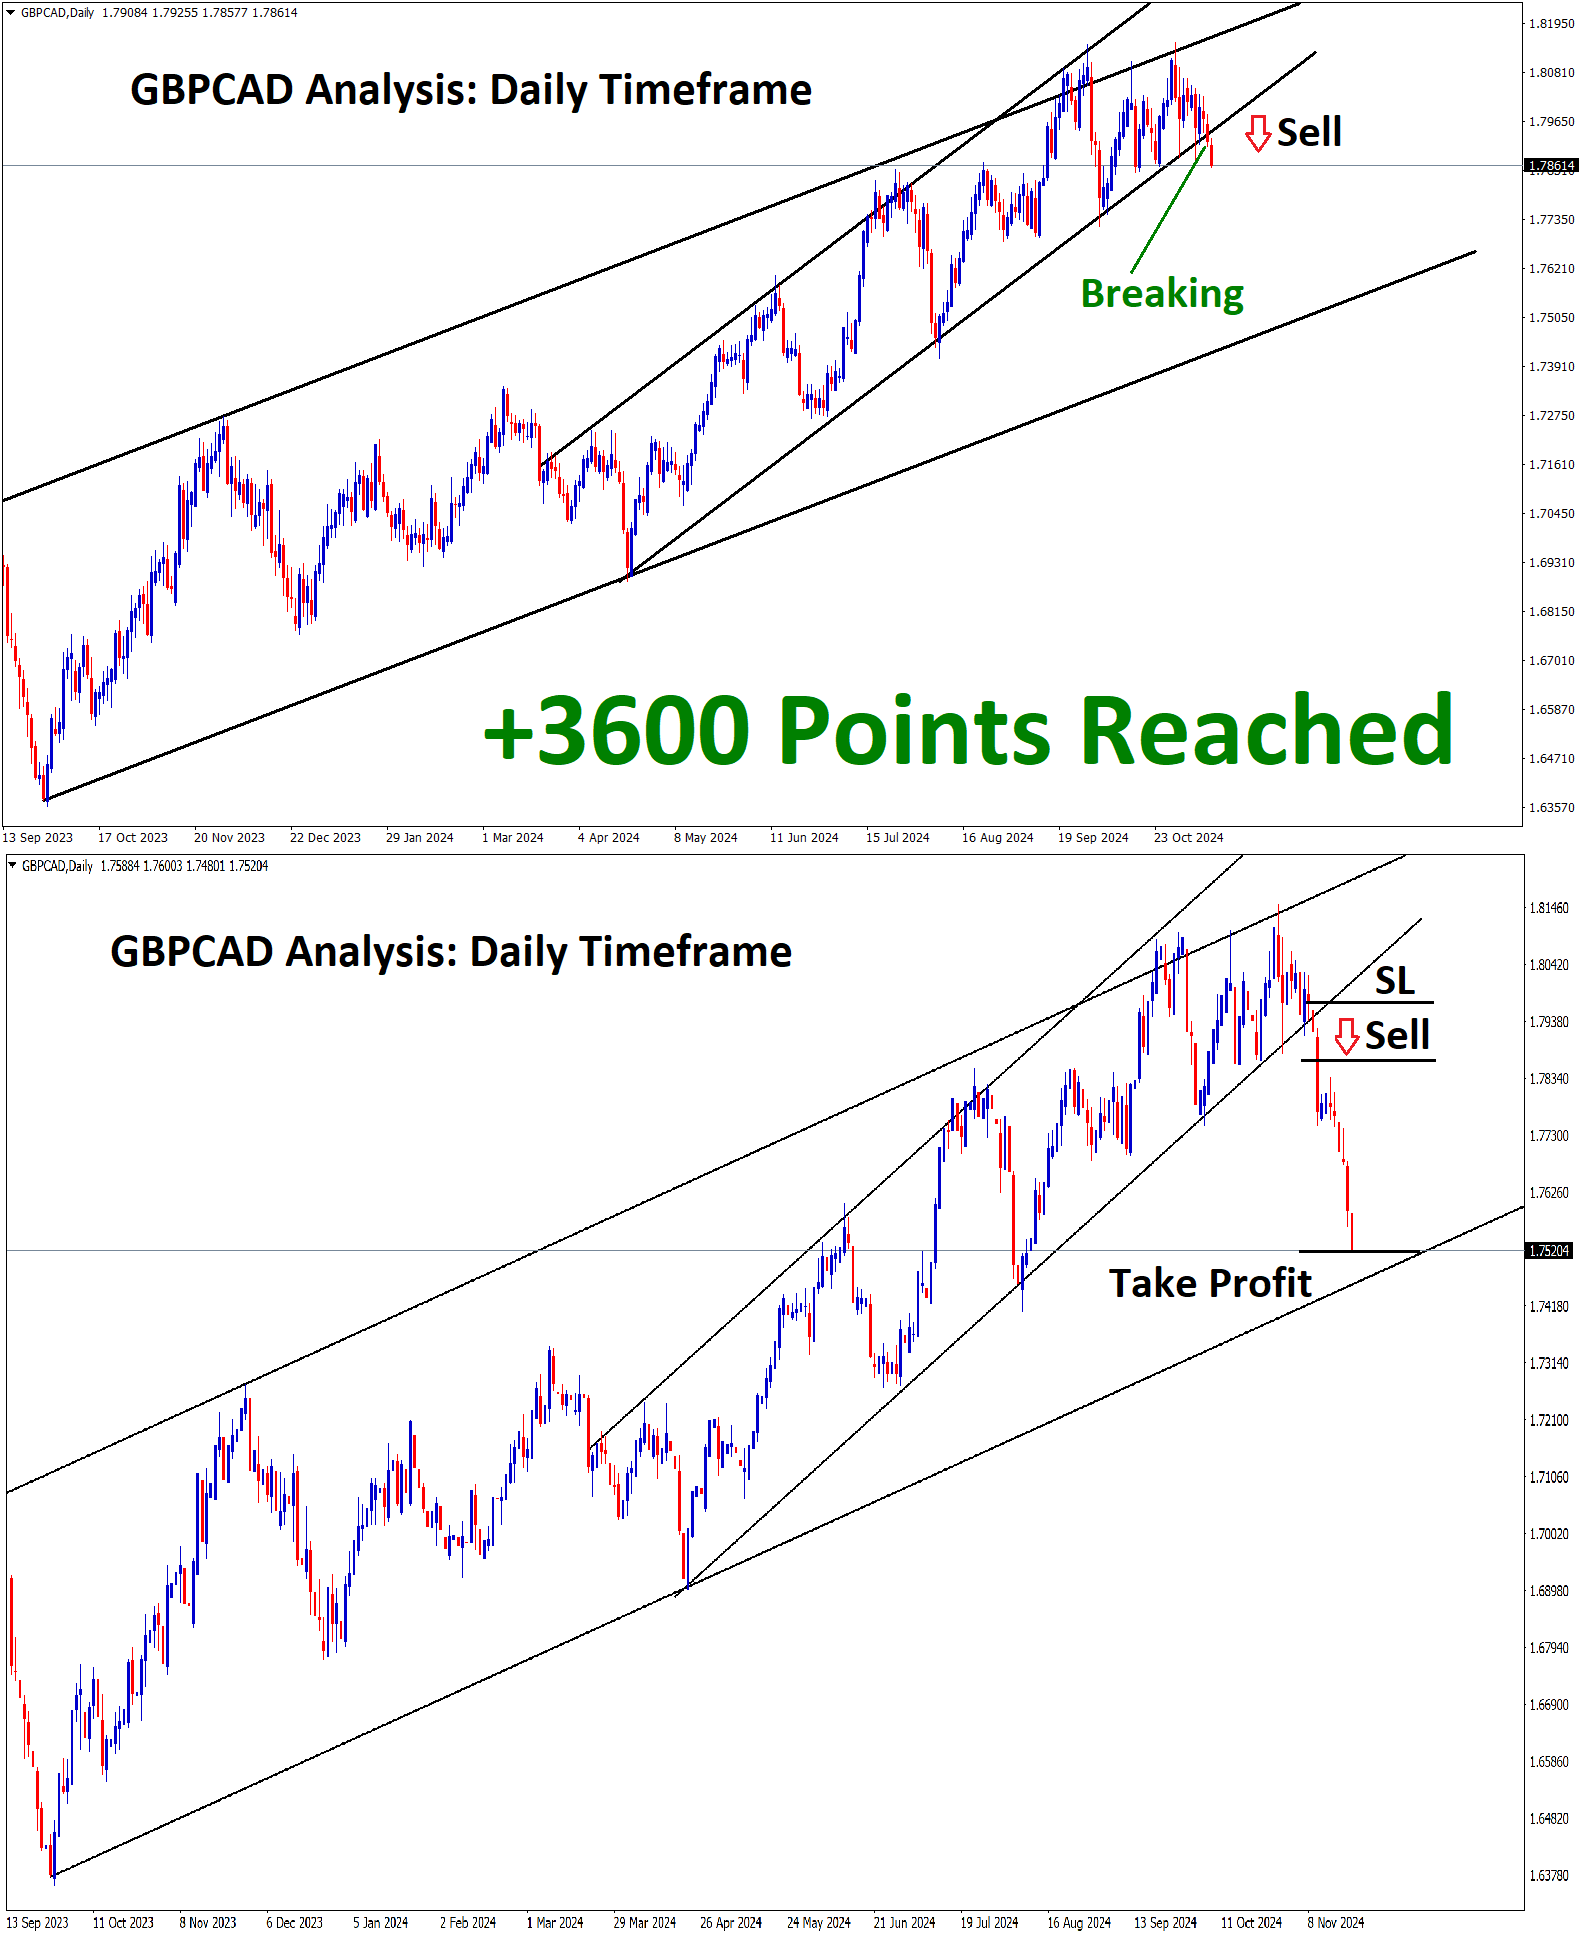
GBPCAD Analysis GBPCAD is breaking the higher low area of the minor Ascending channel after a long time After the…
-
+2600 Points Reached in GBPCAD Sell Signal after breaking the higher low area of the minor Ascending channel
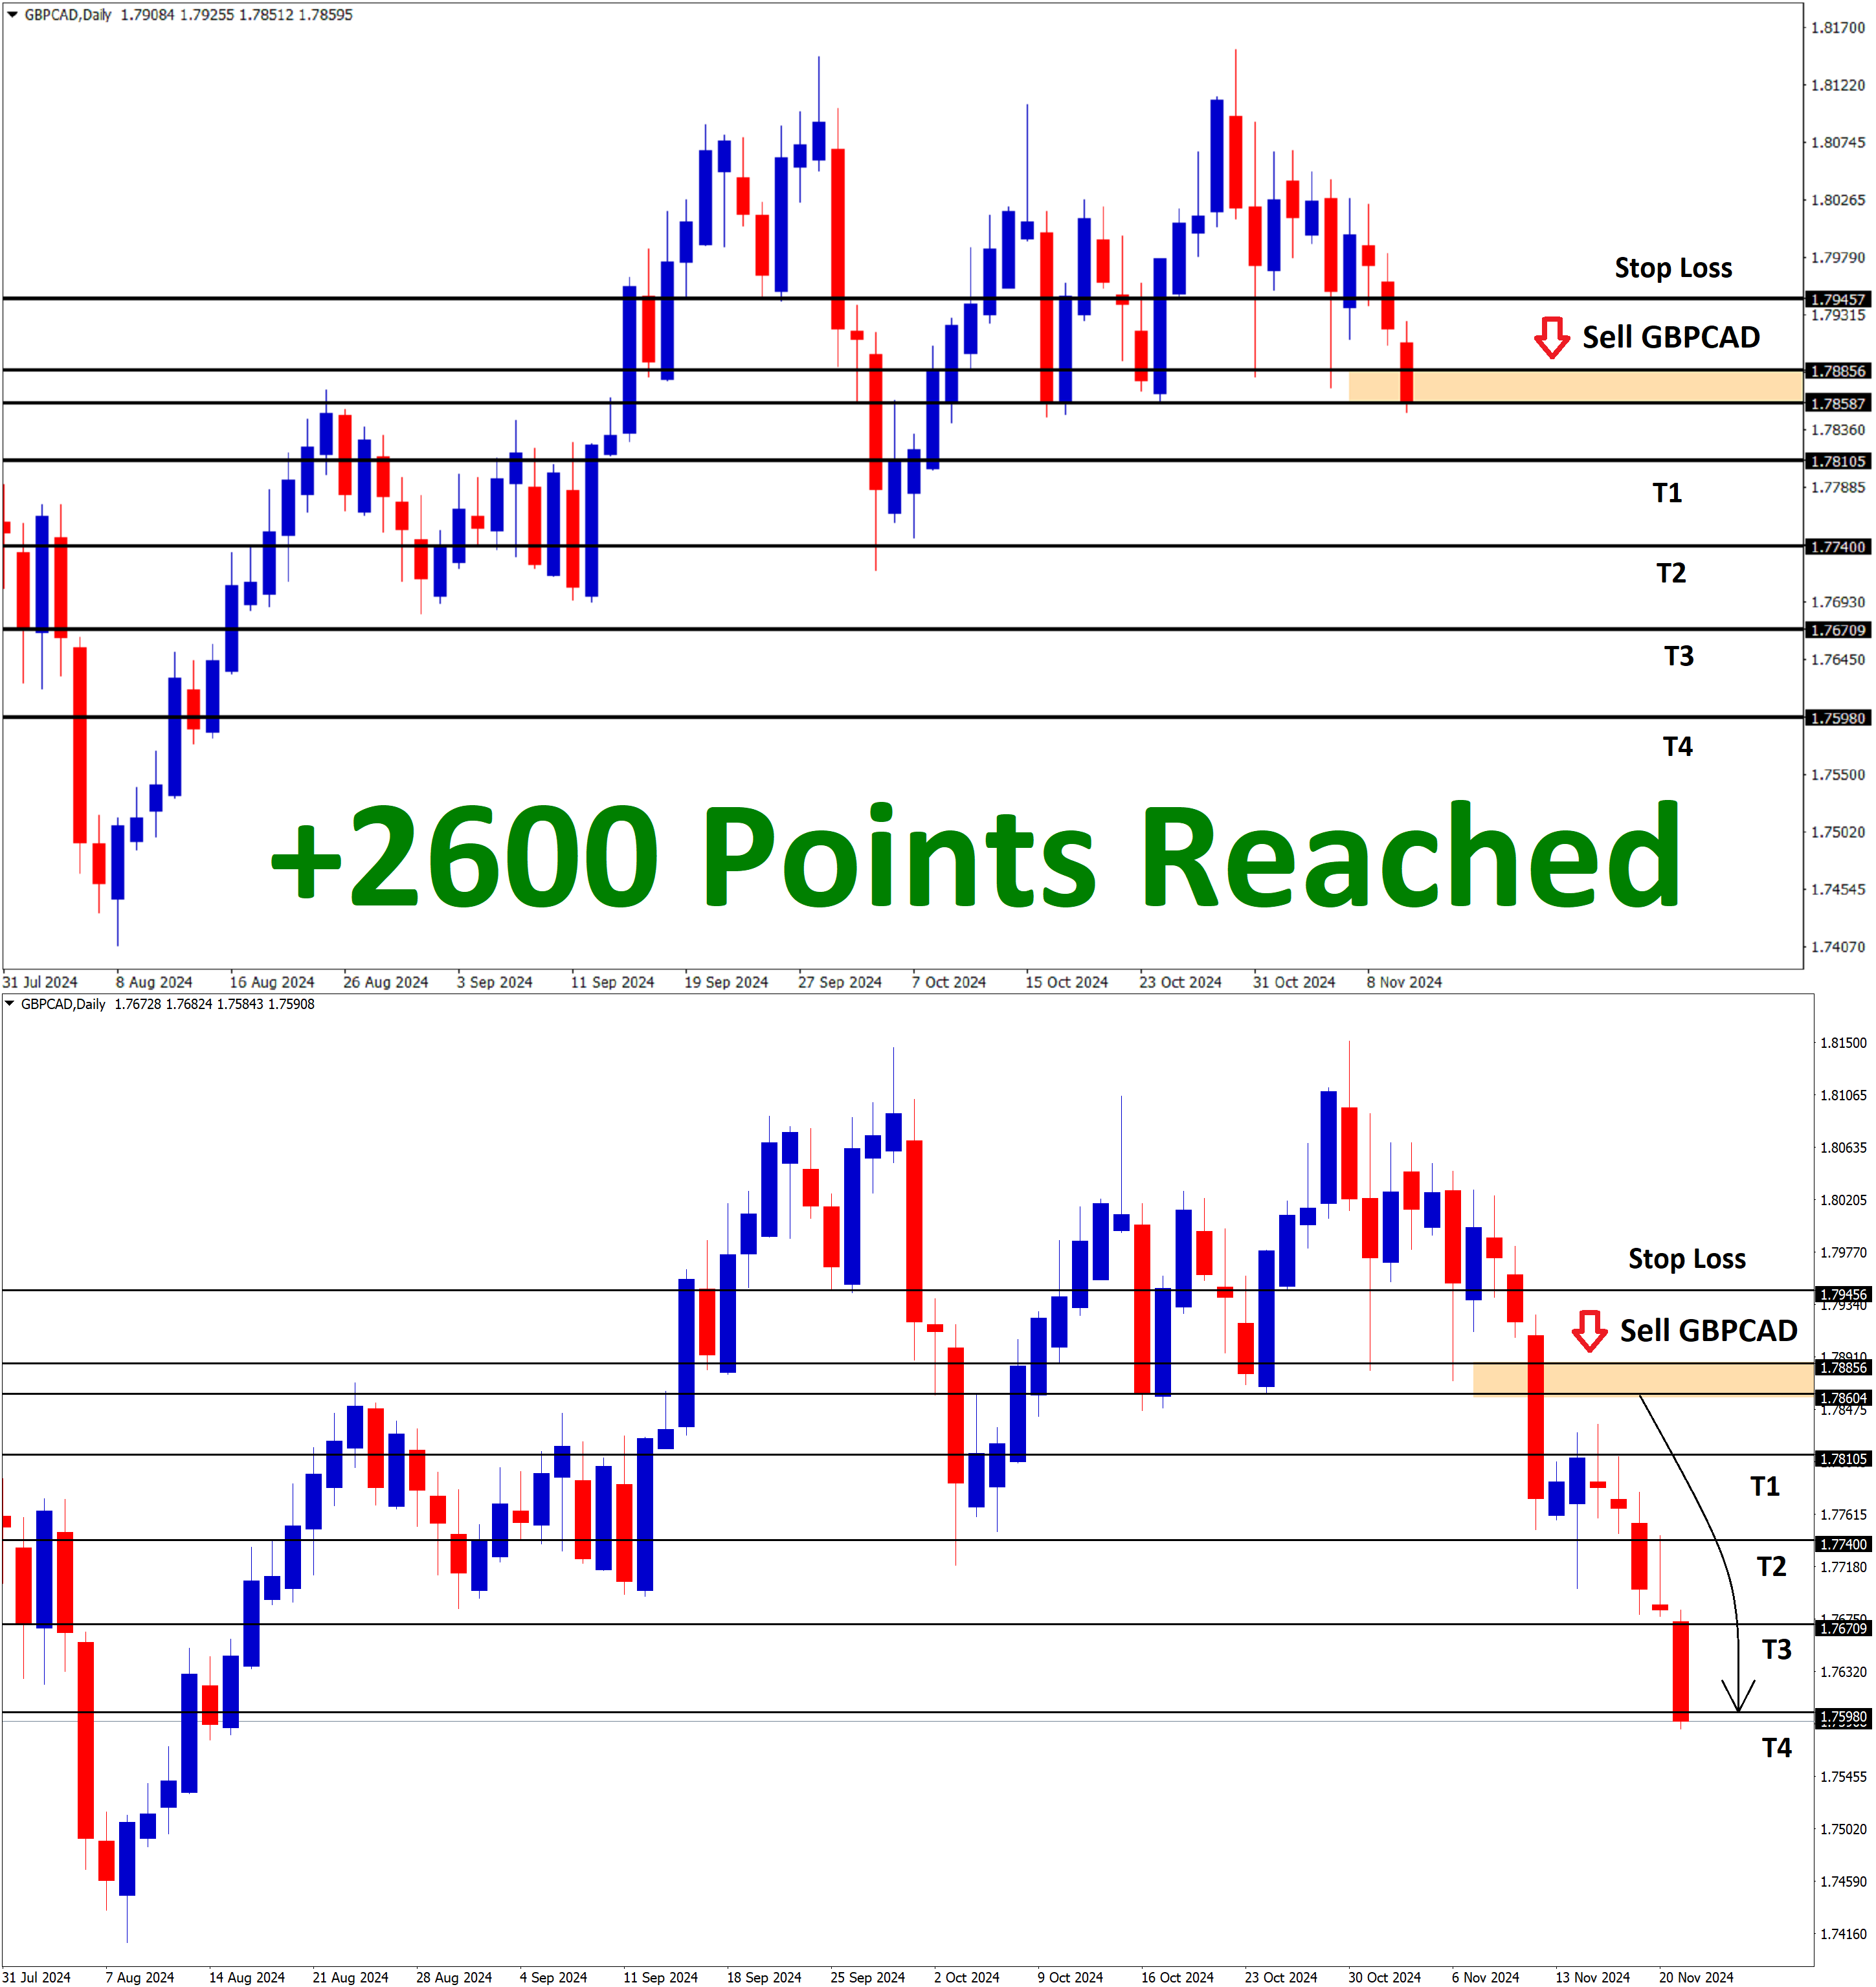
GBPCAD Analysis GBPCAD is breaking the higher low area of the minor Ascending channel after a long time After the…
-
+1900 Points Reached in GBPCAD Sell Signal after breaking the higher low area of the minor Ascending channel

GBPCAD Analysis GBPCAD is breaking the higher low area of the minor Ascending channel after a long time After the…
-
+1880 Points Reached in GBPCAD Sell signal after falling from the major resistance area in the higher timeframe
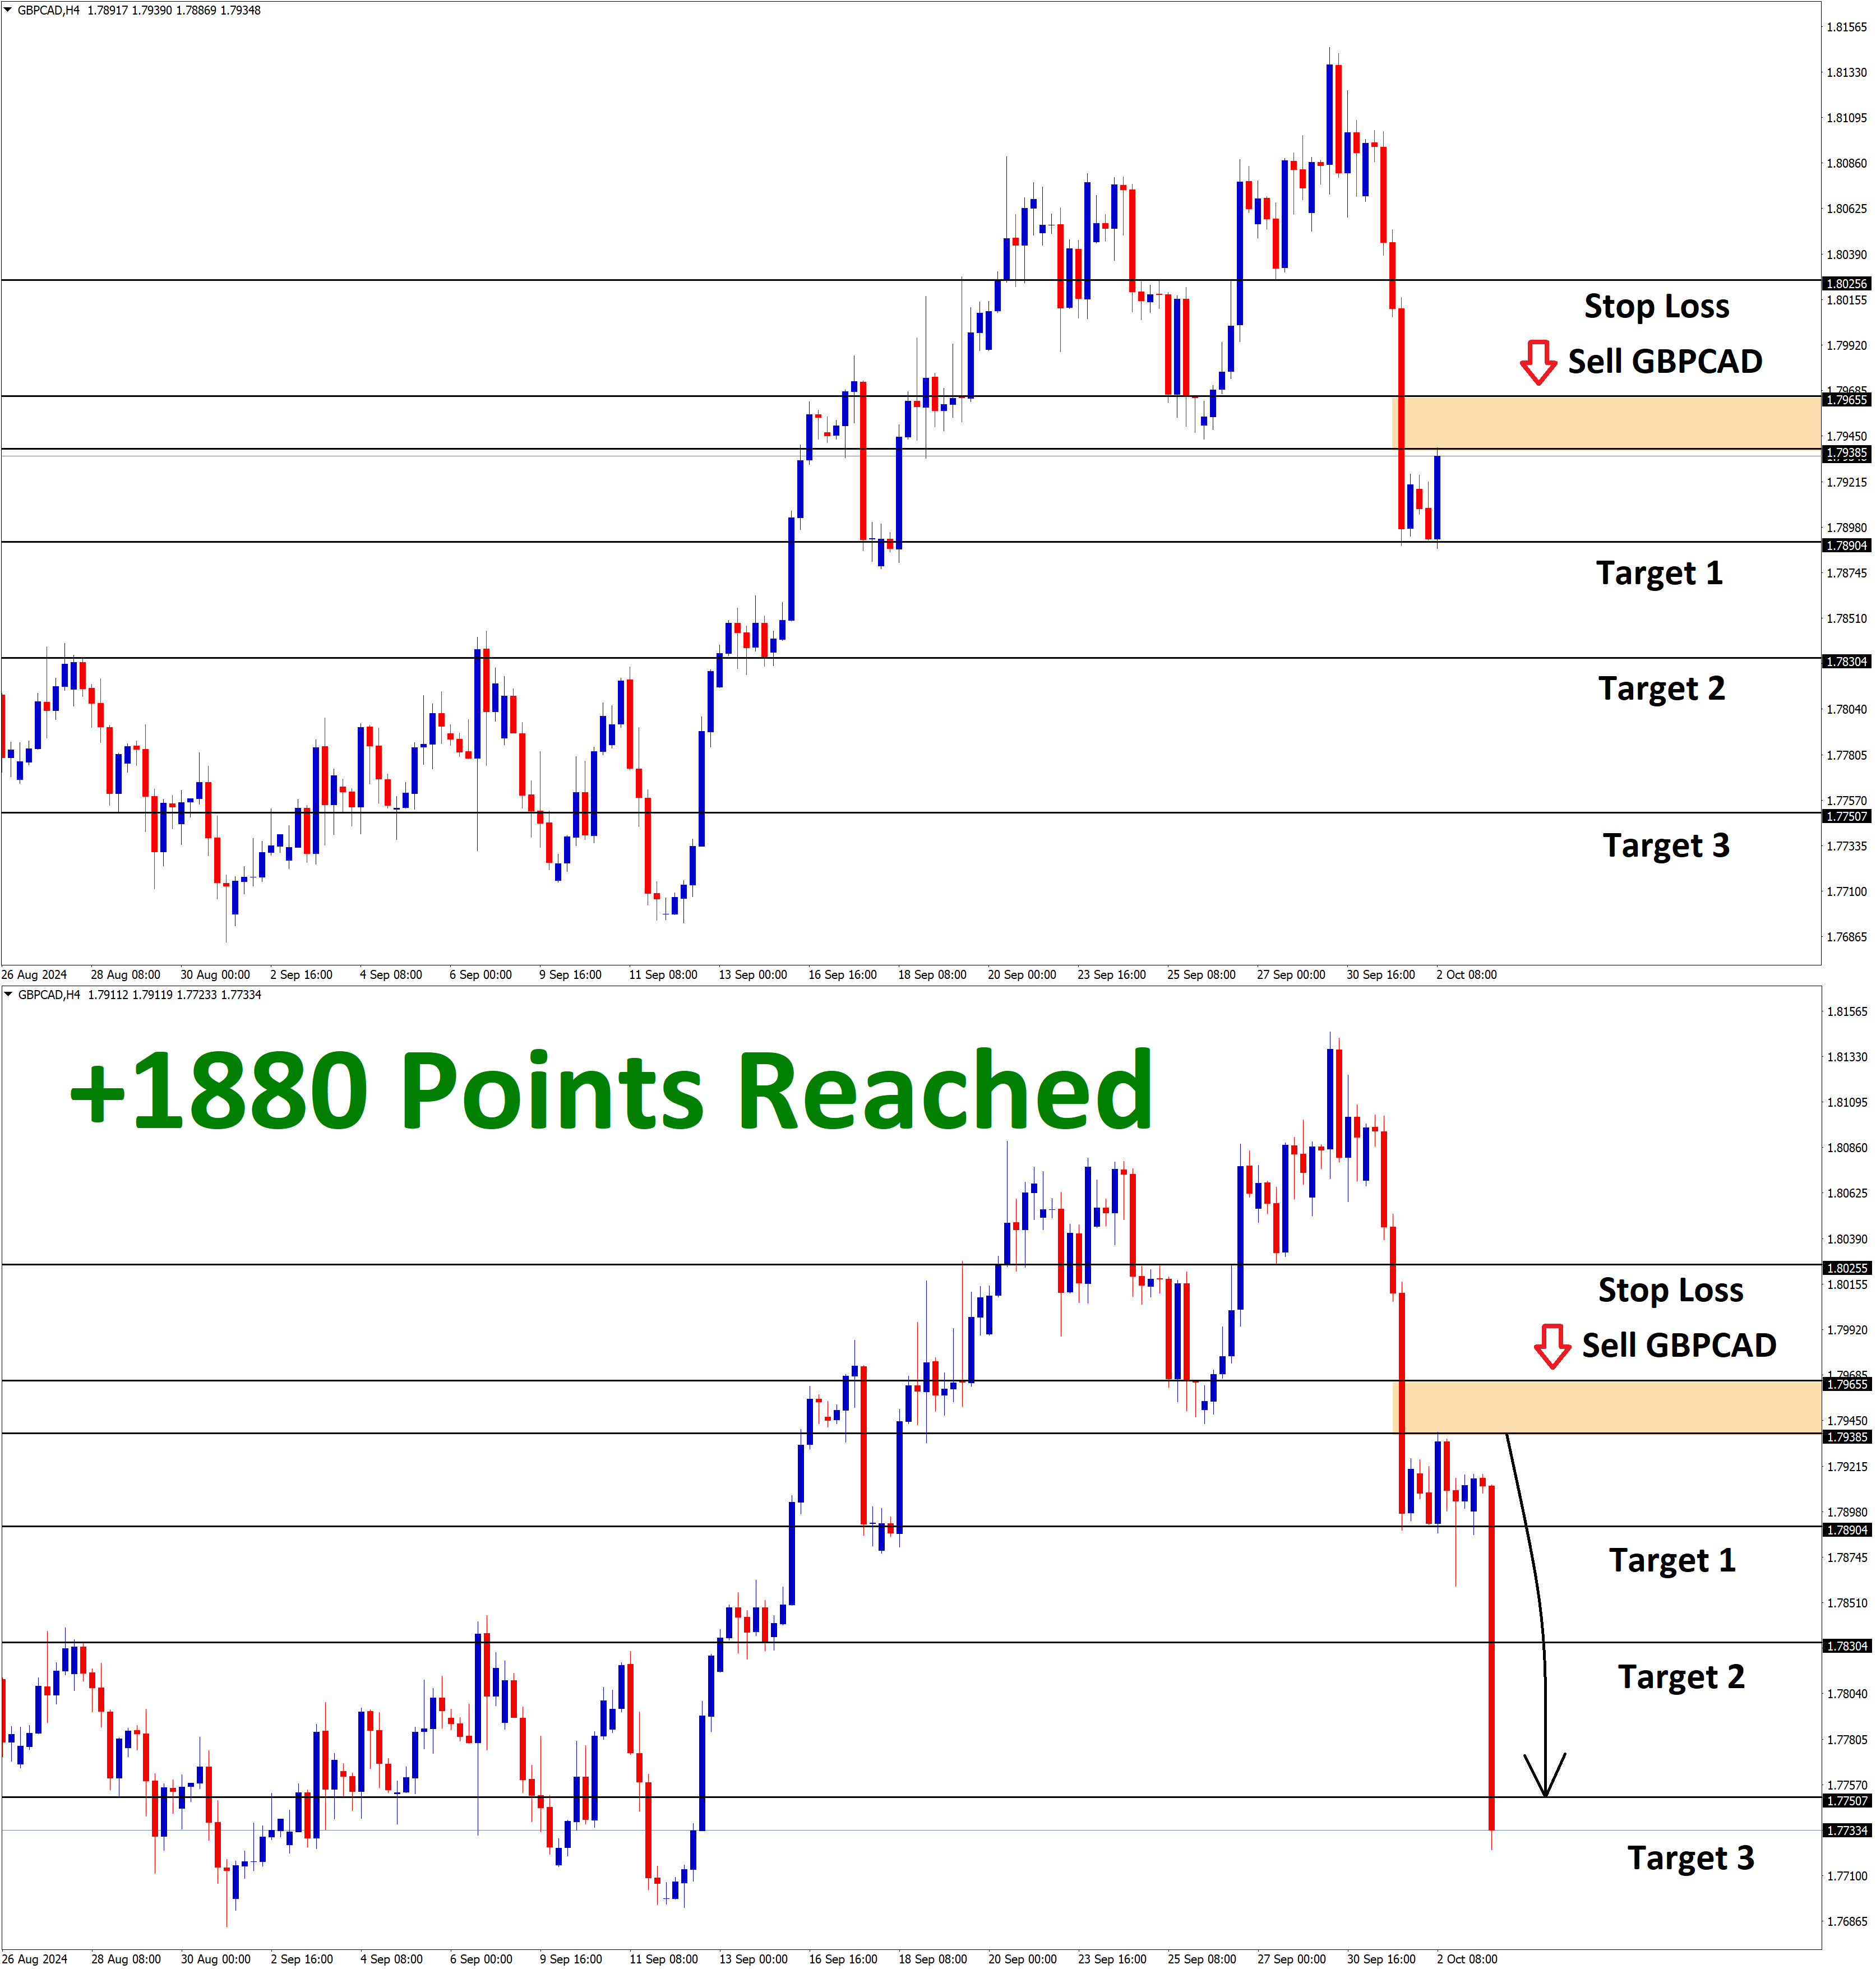
GBPCAD Analysis GBPCAD falling from the major resistance area in the higher timeframe weekly chart. In the daily timeframe, GBPCAD…
-
+1080 Points Reached in GBPCAD Sell signal after falling from the major resistance area in the higher timeframe
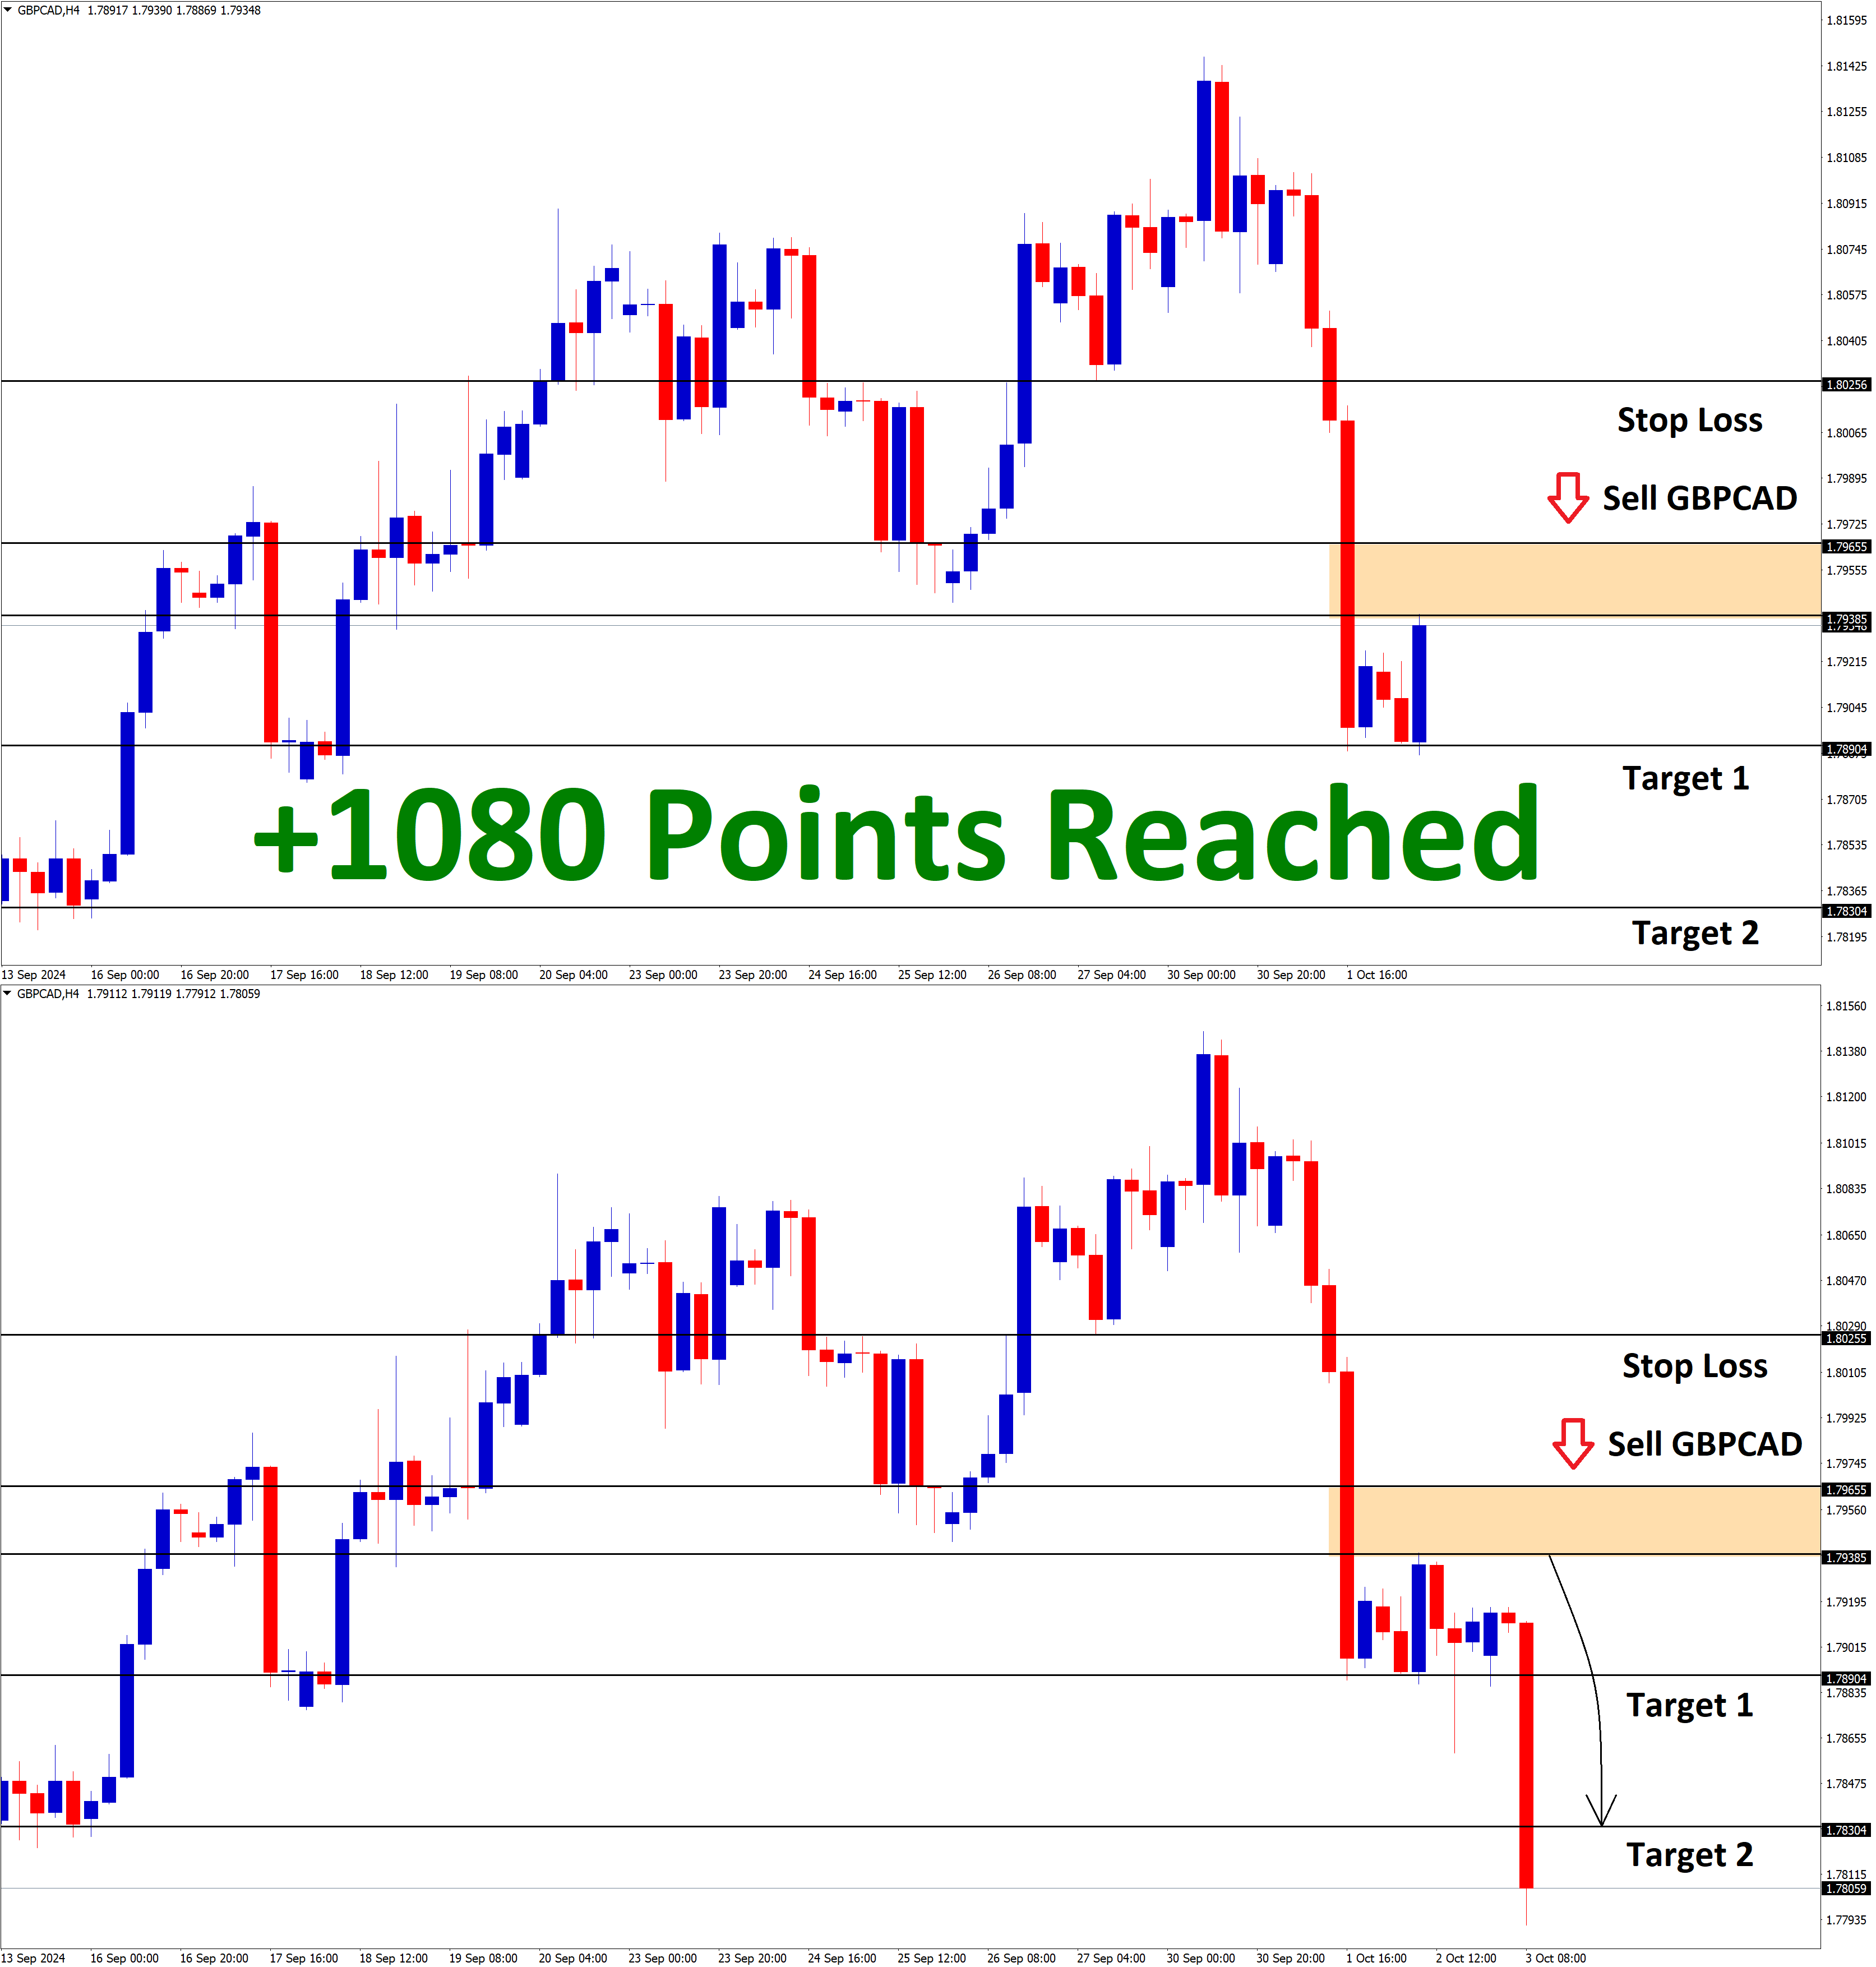
GBPCAD Analysis GBPCAD falling from the major resistance area in the higher timeframe weekly chart. In the daily timeframe, GBPCAD…
-
+2054 Points Reached in GBPCAD Sell signal after breaking the bottom area of the ascending channel
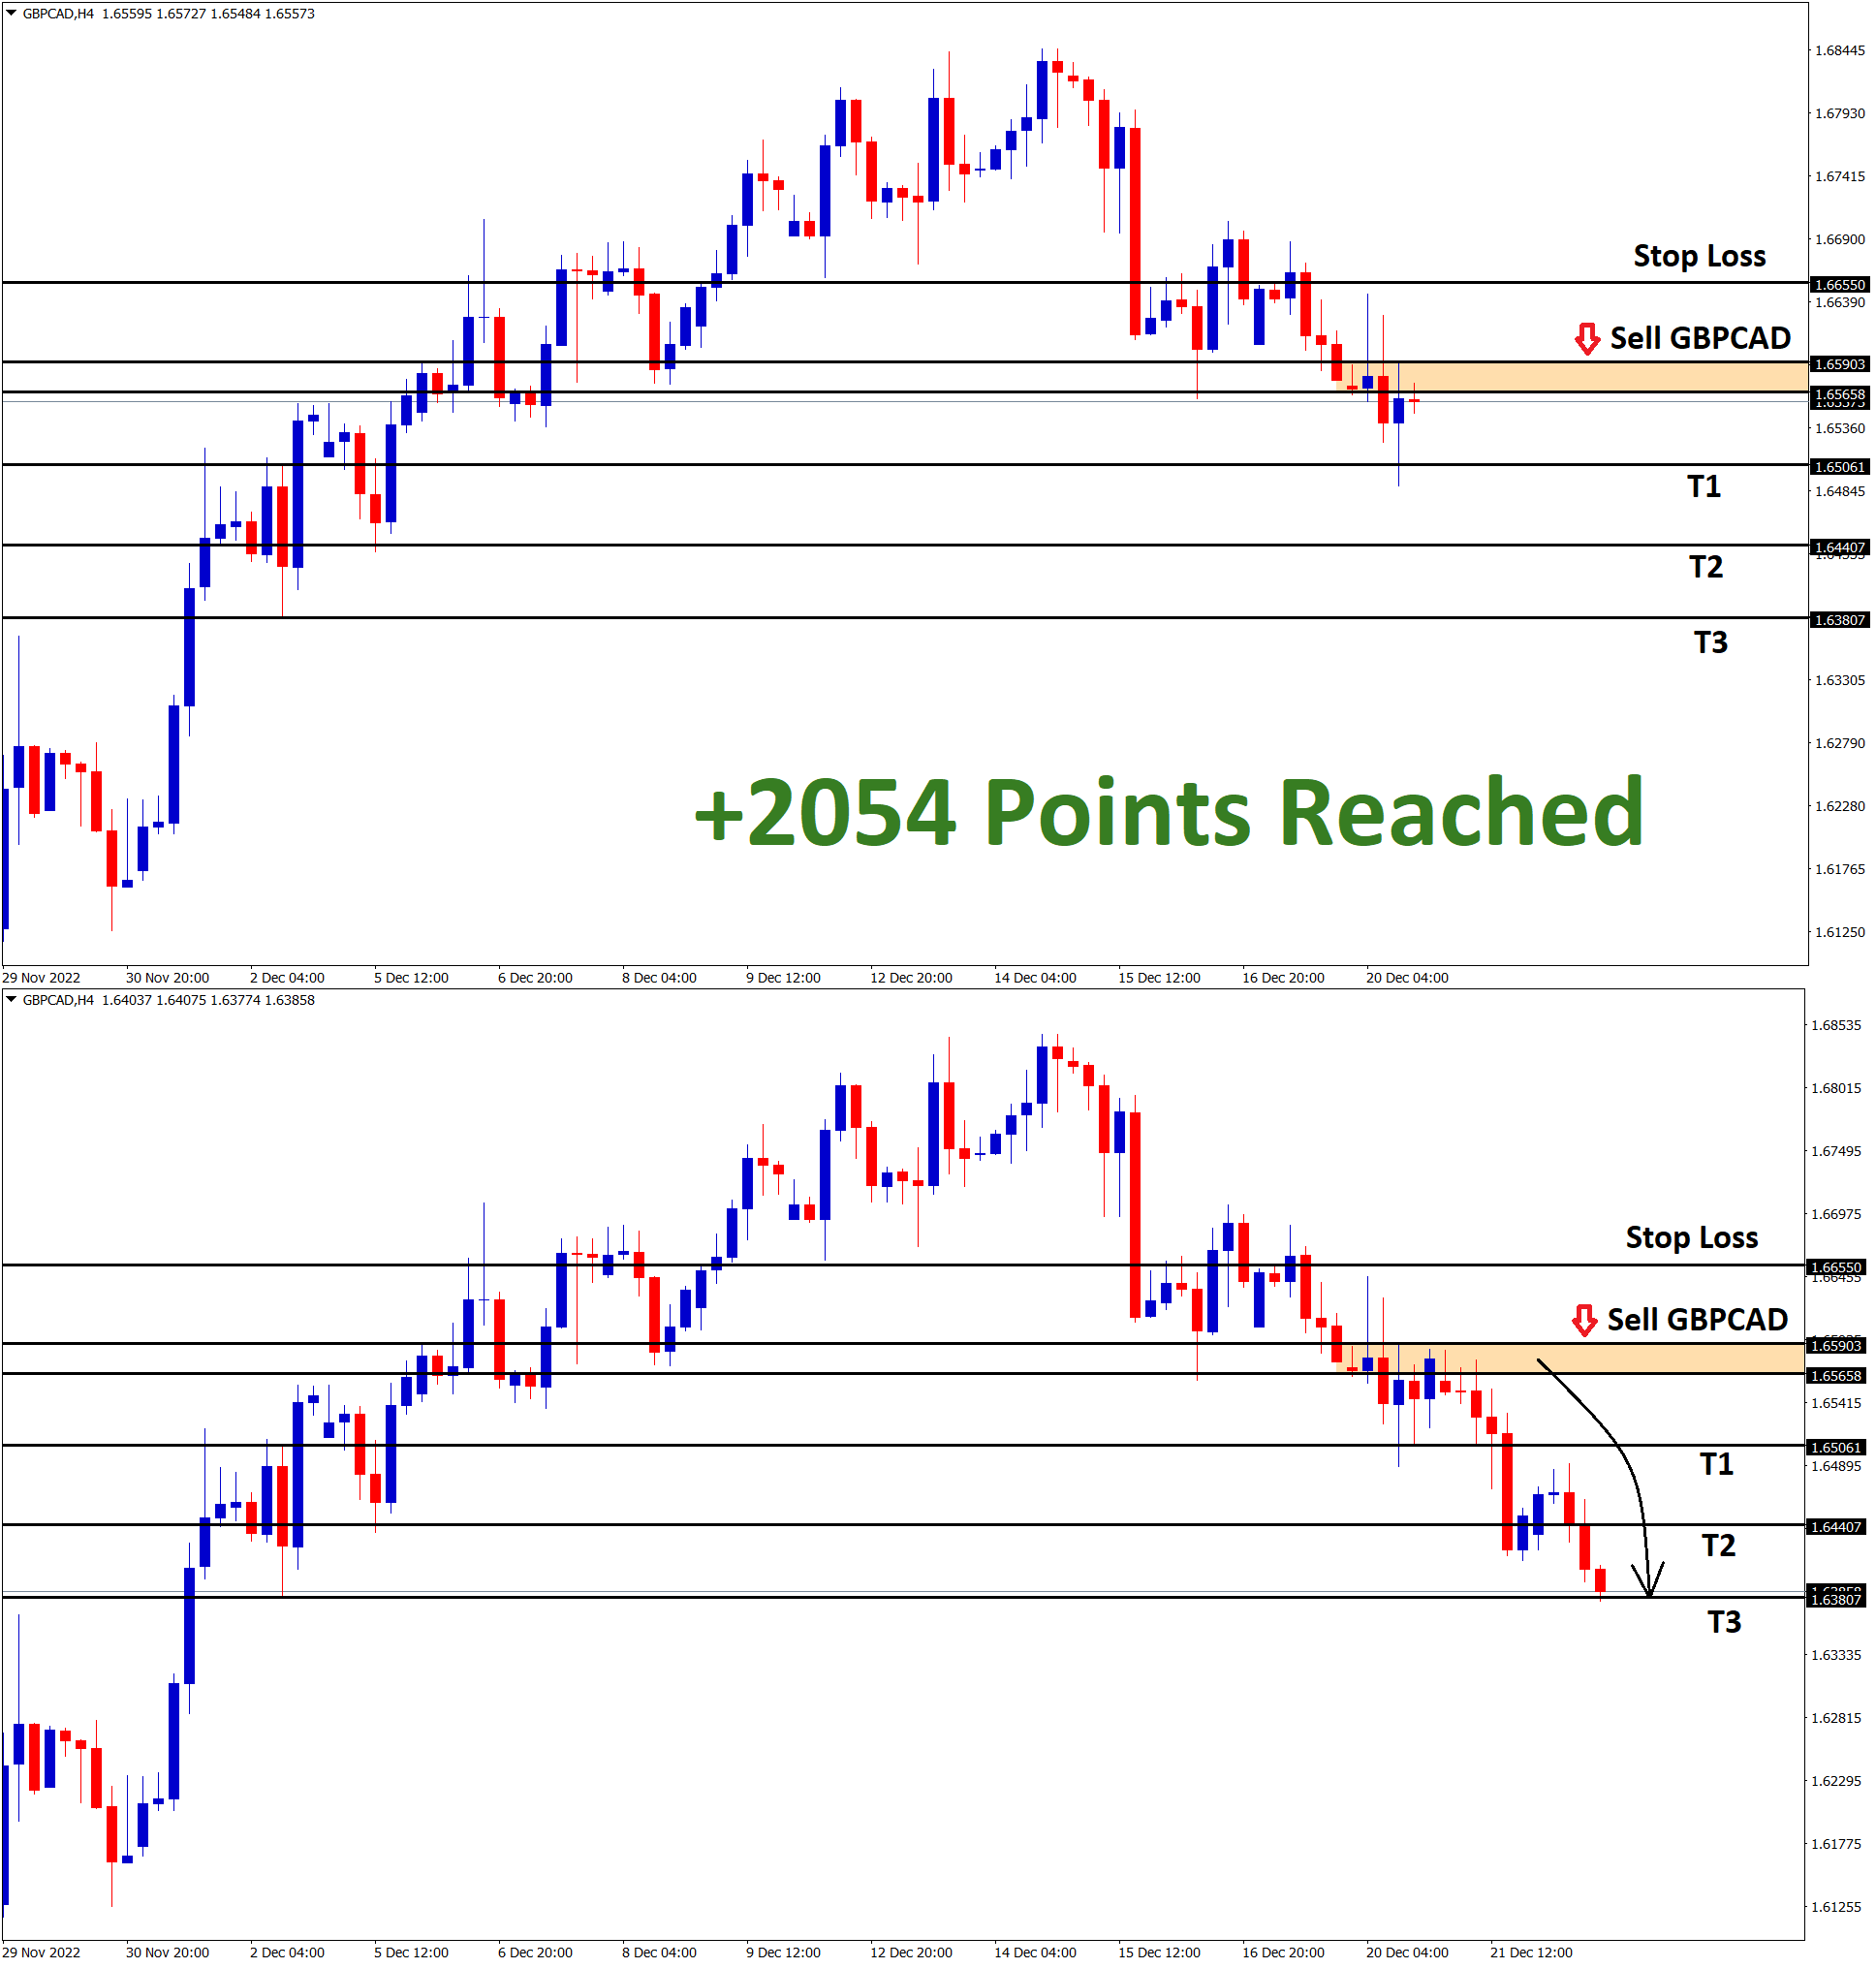
GBPCAD Analysis: GBPCAD has broken the bottom area of the ascending channel and moving in a minor descending channel now…
-
+1454 Points Reached in GBPCAD Sell signal after breaking the bottom area of the ascending channel
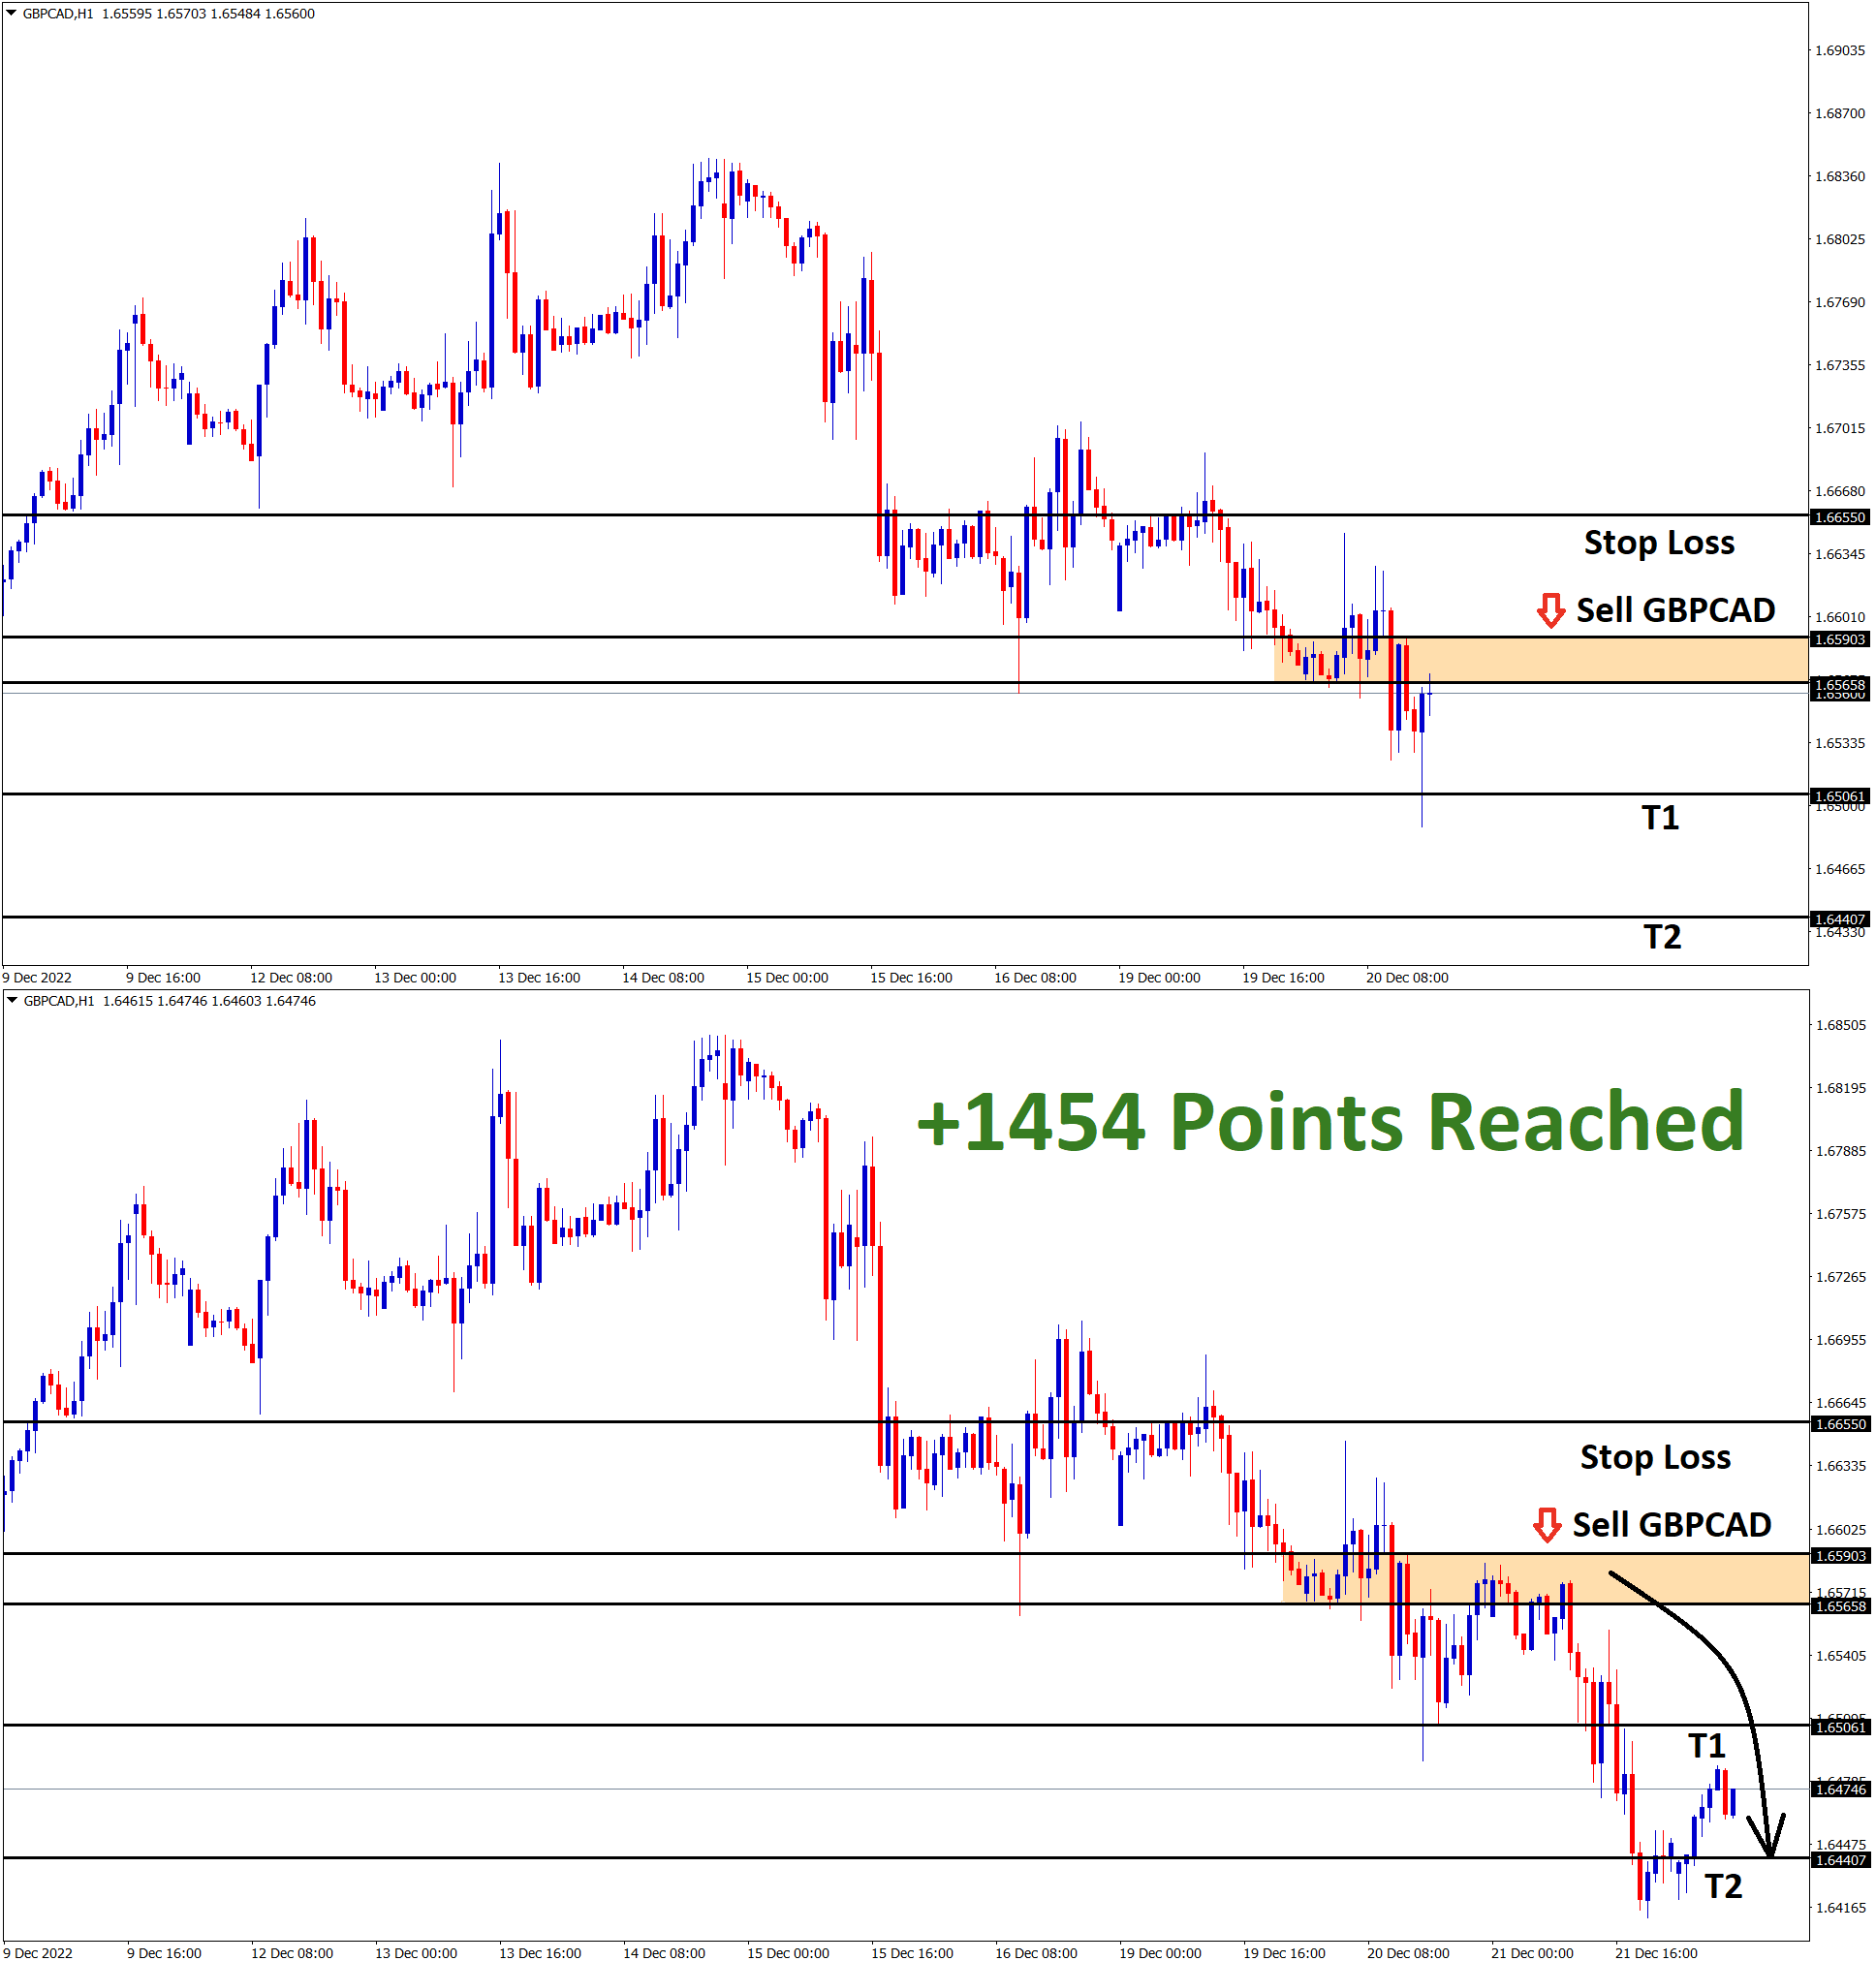
GBPCAD Analysis: GBPCAD has broken the bottom area of the ascending channel and moving in a minor descending channel now…
-
+2000 Points reached in GBPCAD sell signal after hitting lower high area of the descending channel
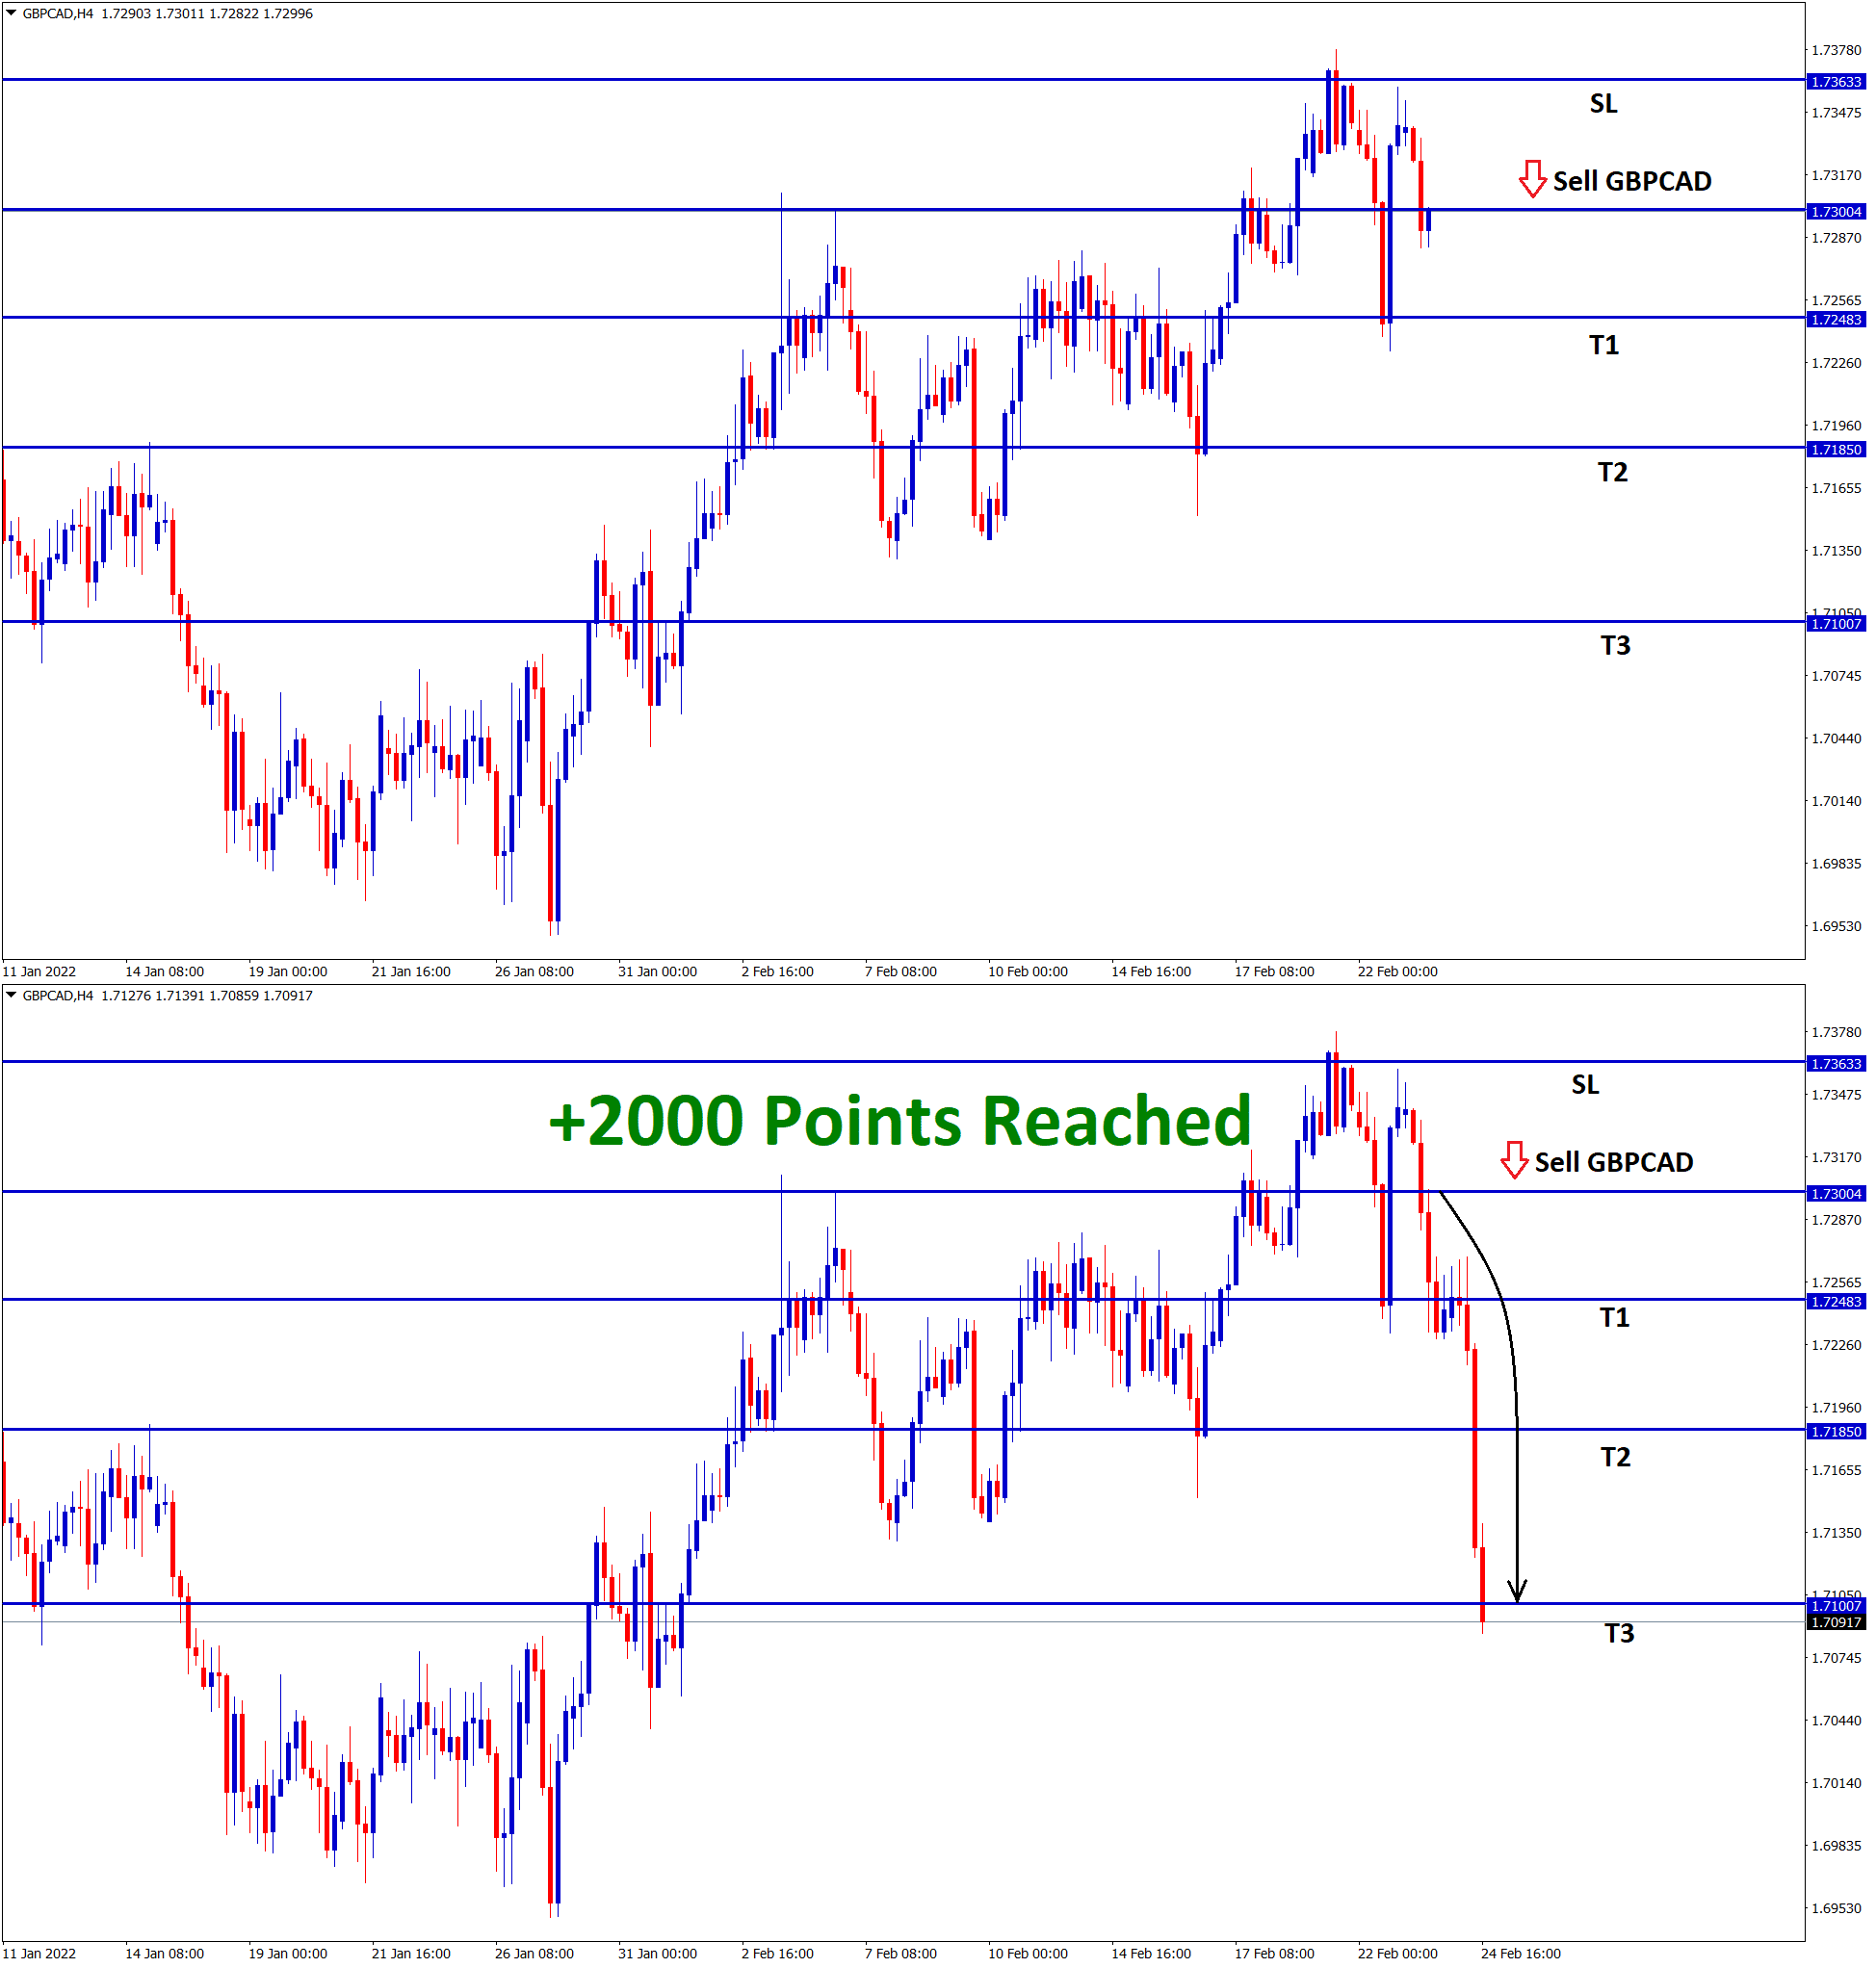
GBPCAD Analysis: GBPCAD hits the lower high area of the descending channel line in the daily timeframe chart. In the…
-
+1150 Points reached in GBPCAD sell signal after hitting lower high area of the descending channel
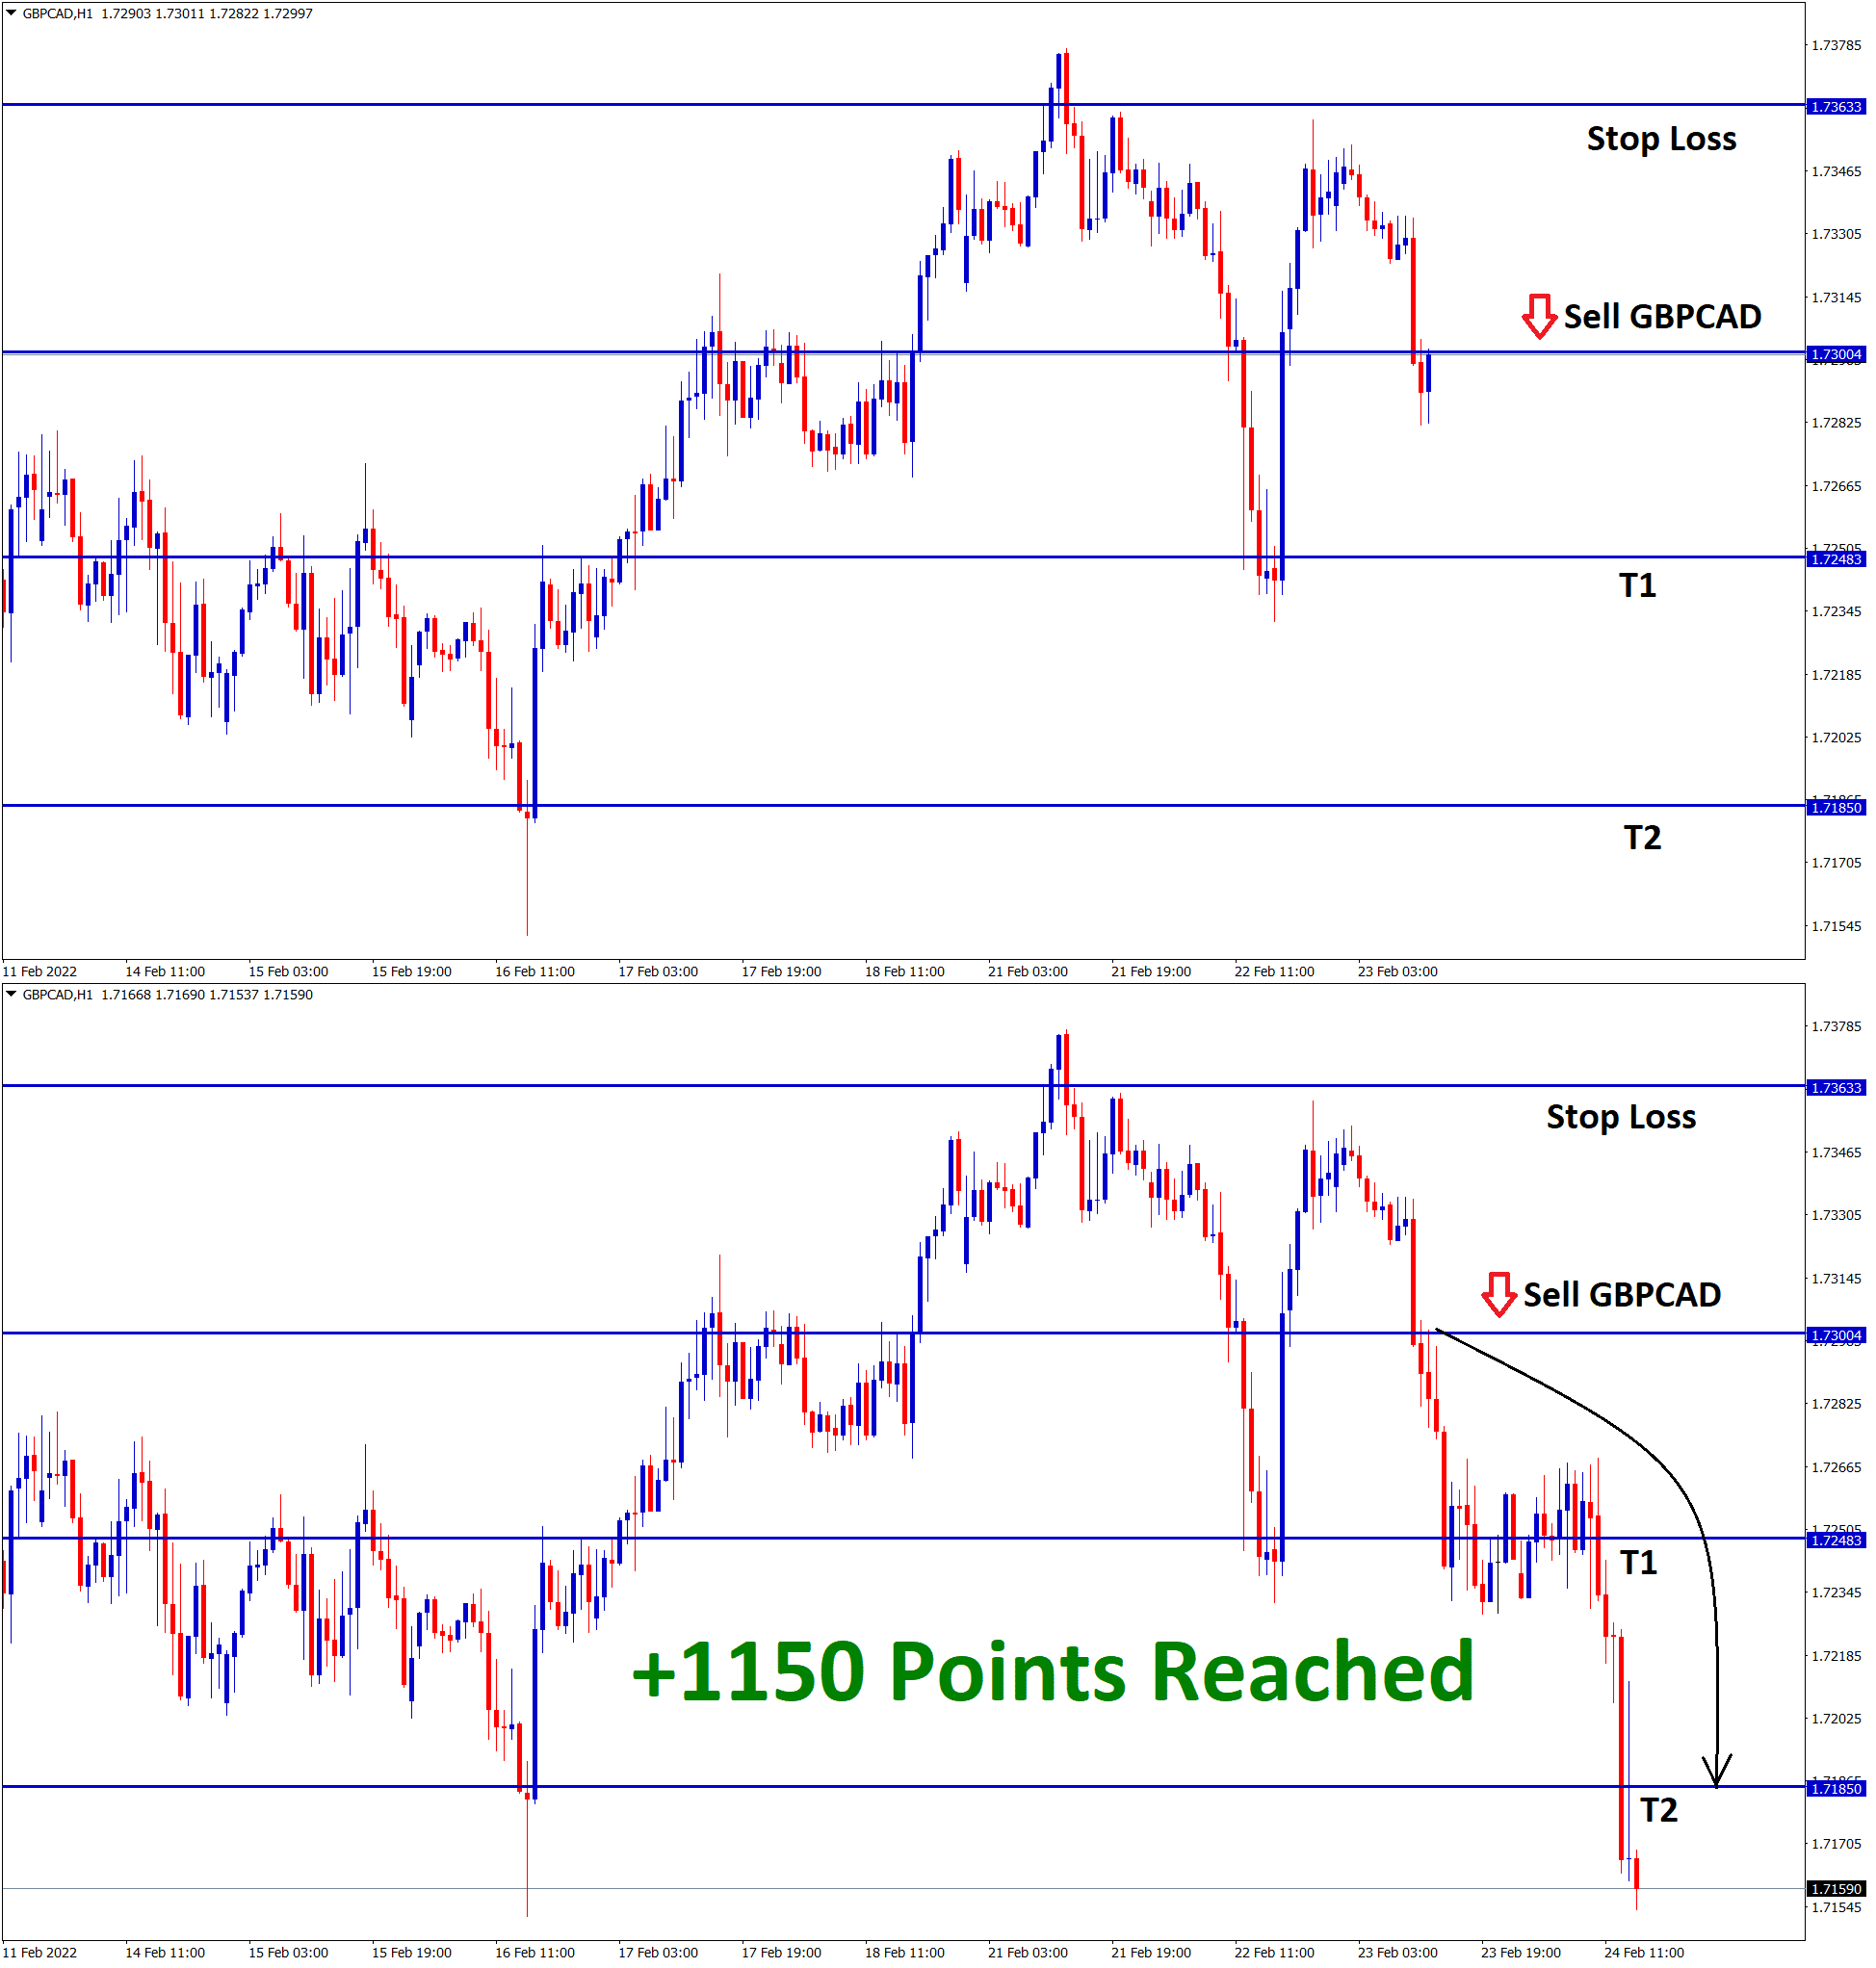
GBPCAD Analysis: GBPCAD hits the lower high area of the descending channel line in the daily timeframe chart. In the…
-
GBPCAD is standing at the top of the symmetrical Triangle
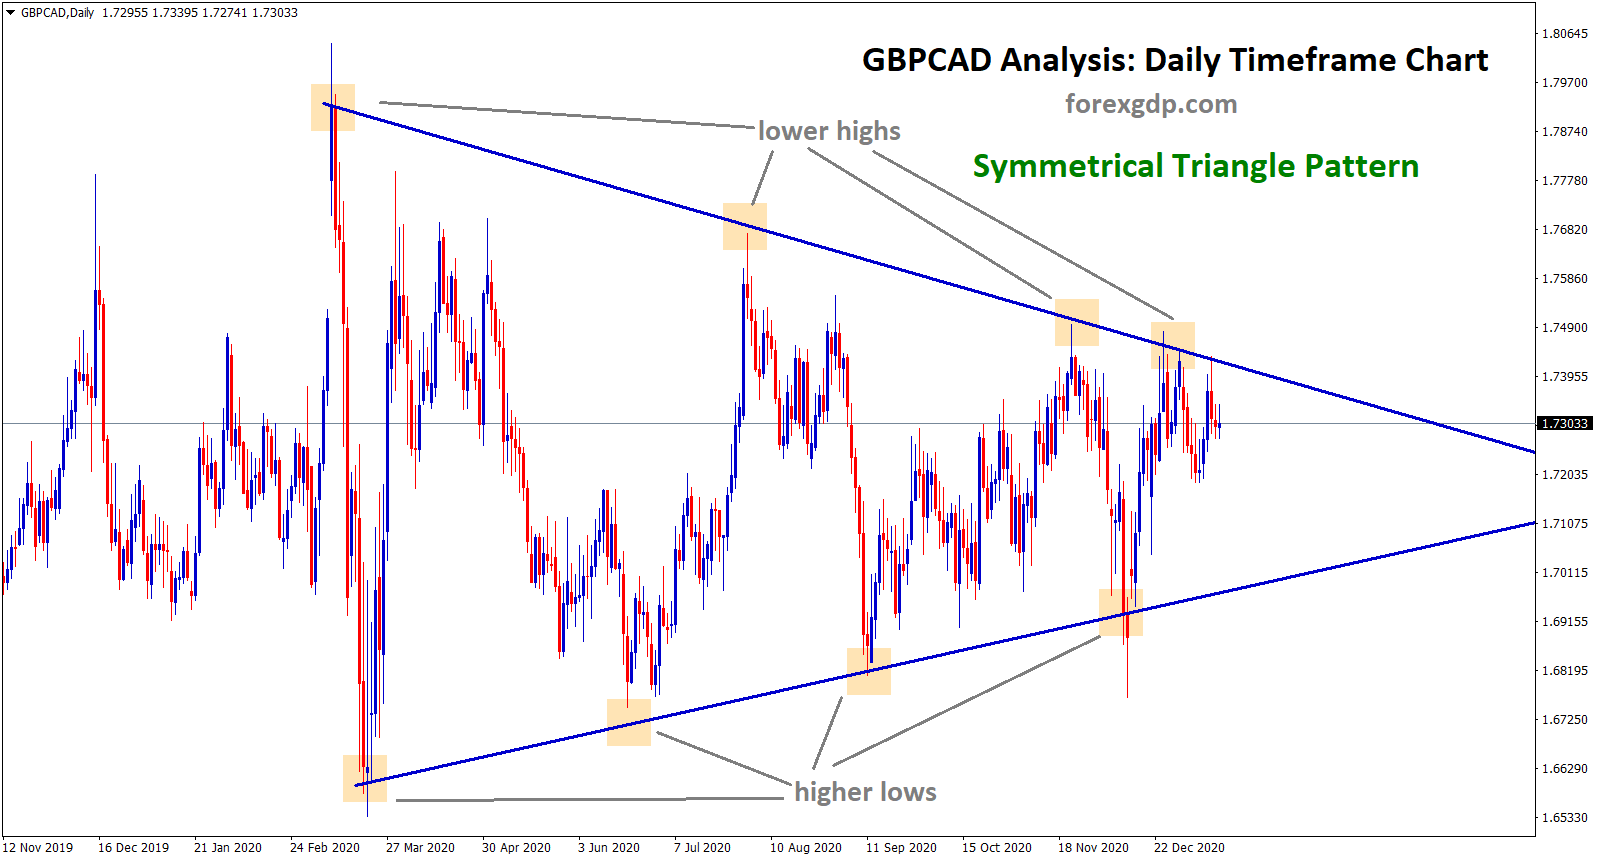
GBPCAD Analysis GBPCAD is at the top zone of the symmetrical triangle pattern in the daily timeframe chart. Symmetrical Triangle…
-
GBPCAD is standing at the high of the Uptrend range
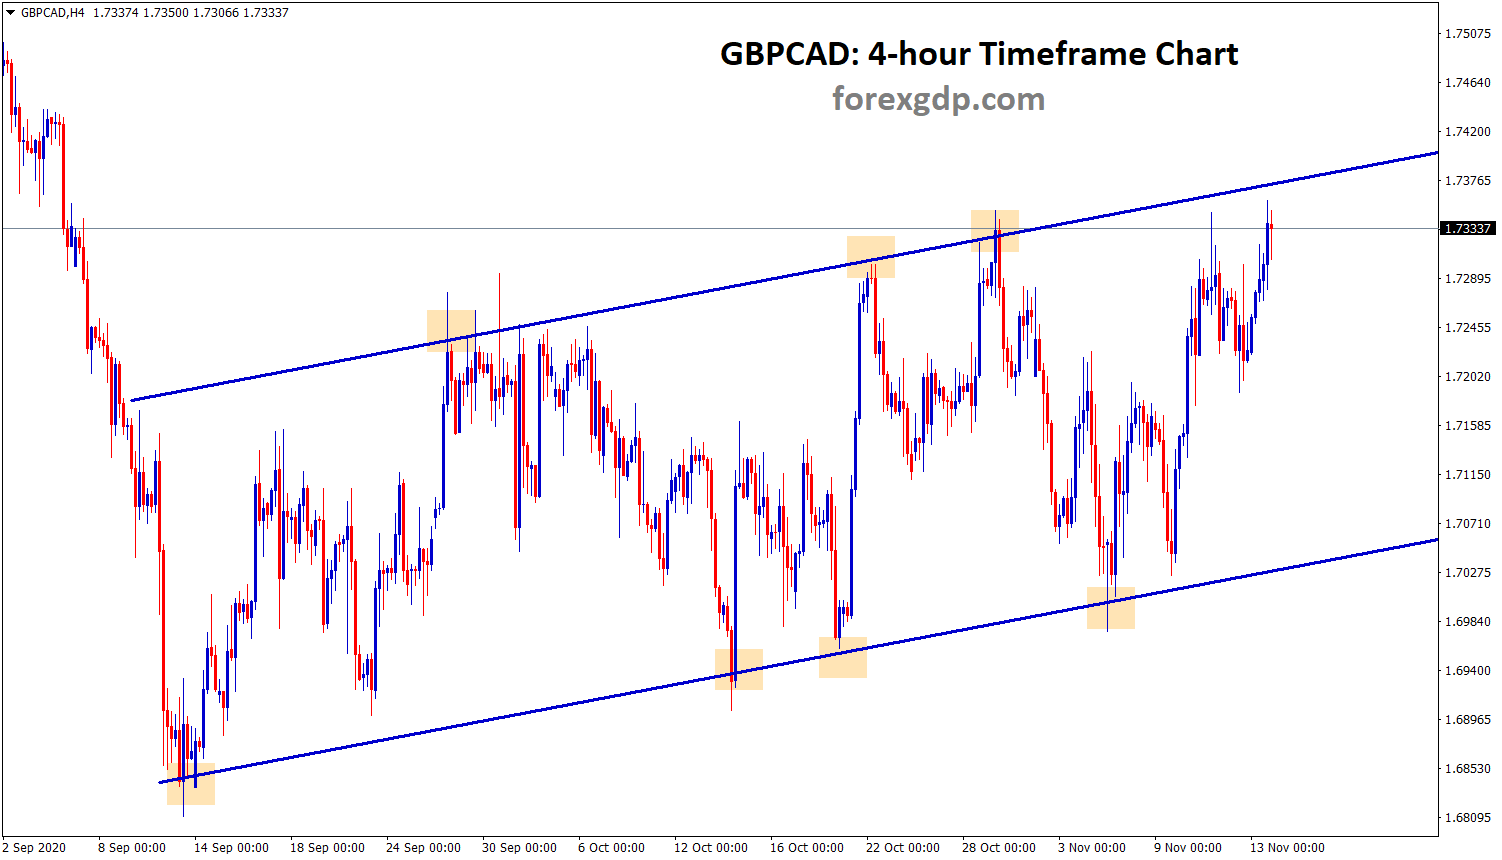
GBPCAD Analysis GBPCAD is moving up and down between the resistance and support trend line ranges. Now, GBPCAD is standing…
-
GBP Currency pairs at the key price levels

GBPJPY Uptrend Analysis GBPJPY is moving in an Uptrend by forming higher highs, higher lows in 4-hour time frame chart.…
