
gbpcad short term
-
+480 Points Reached in GBPCAD Sell signal after falling from the major resistance area in the higher timeframe
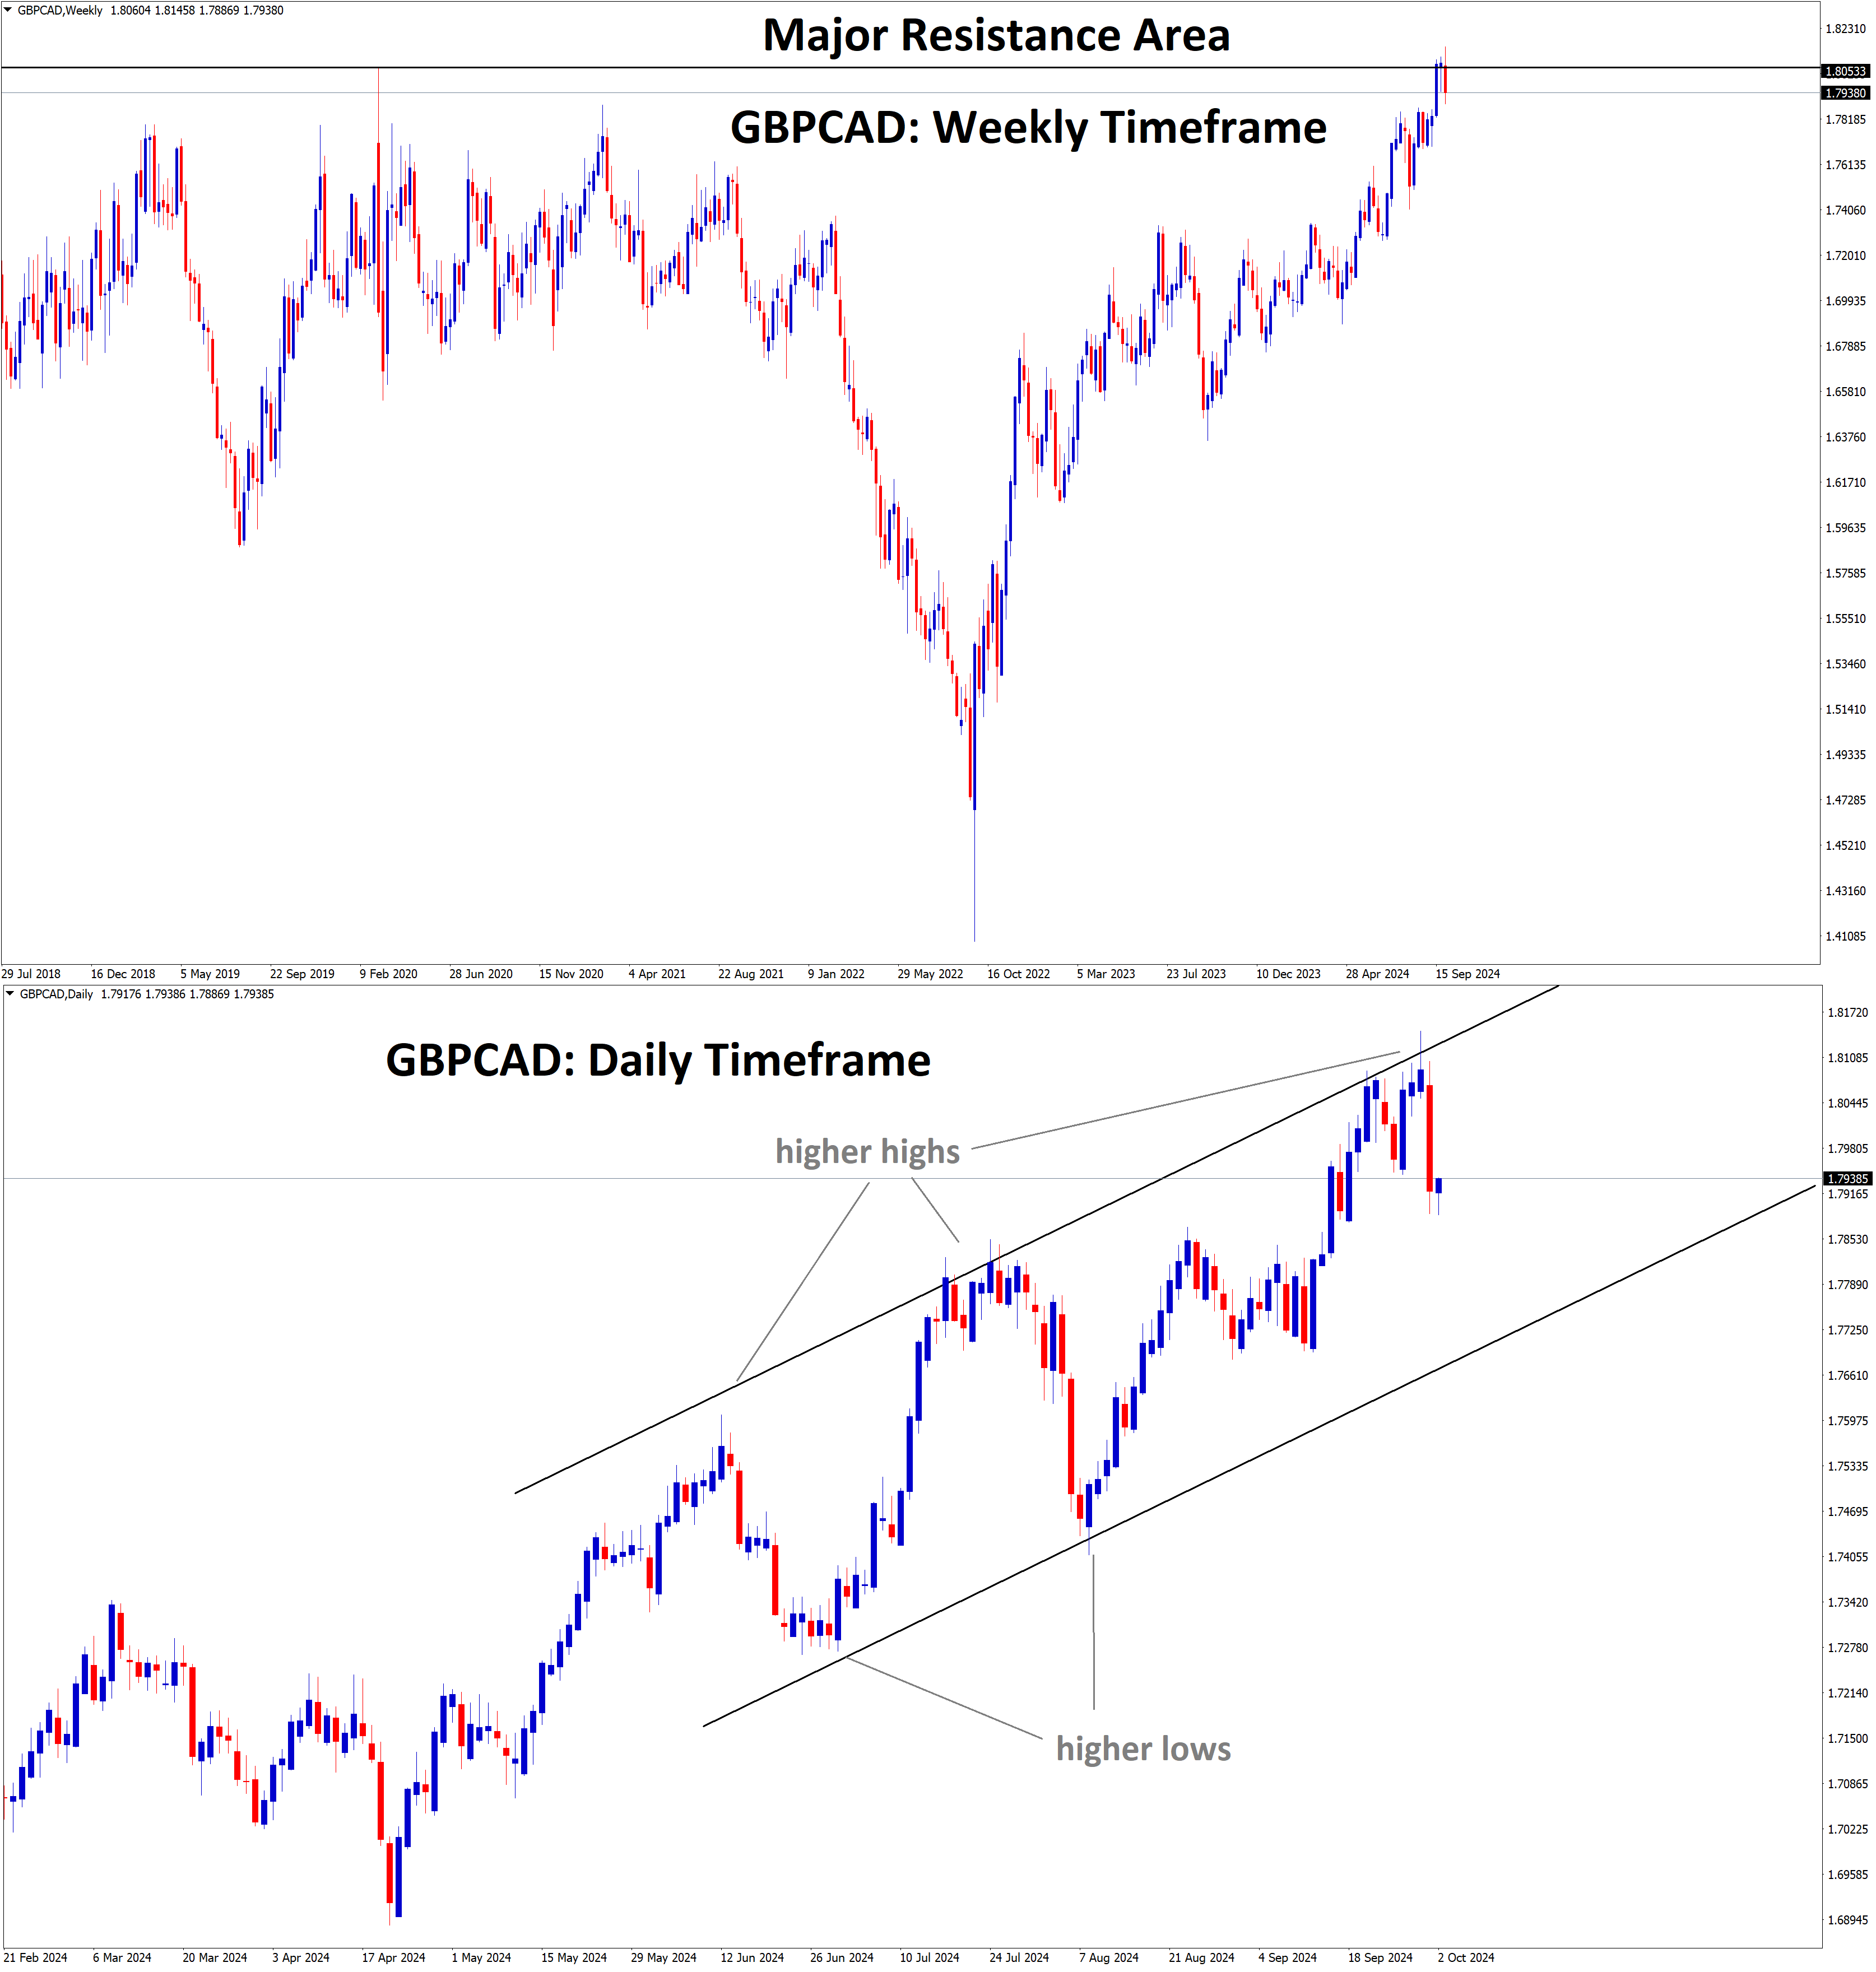
GBPCAD Analysis GBPCAD falling from the major resistance area in the higher timeframe weekly chart. In the daily timeframe, GBPCAD…
-
GBPCAD is trying to consolidate at the high area and closed at the entry price level due to ranging movement until the expiry time
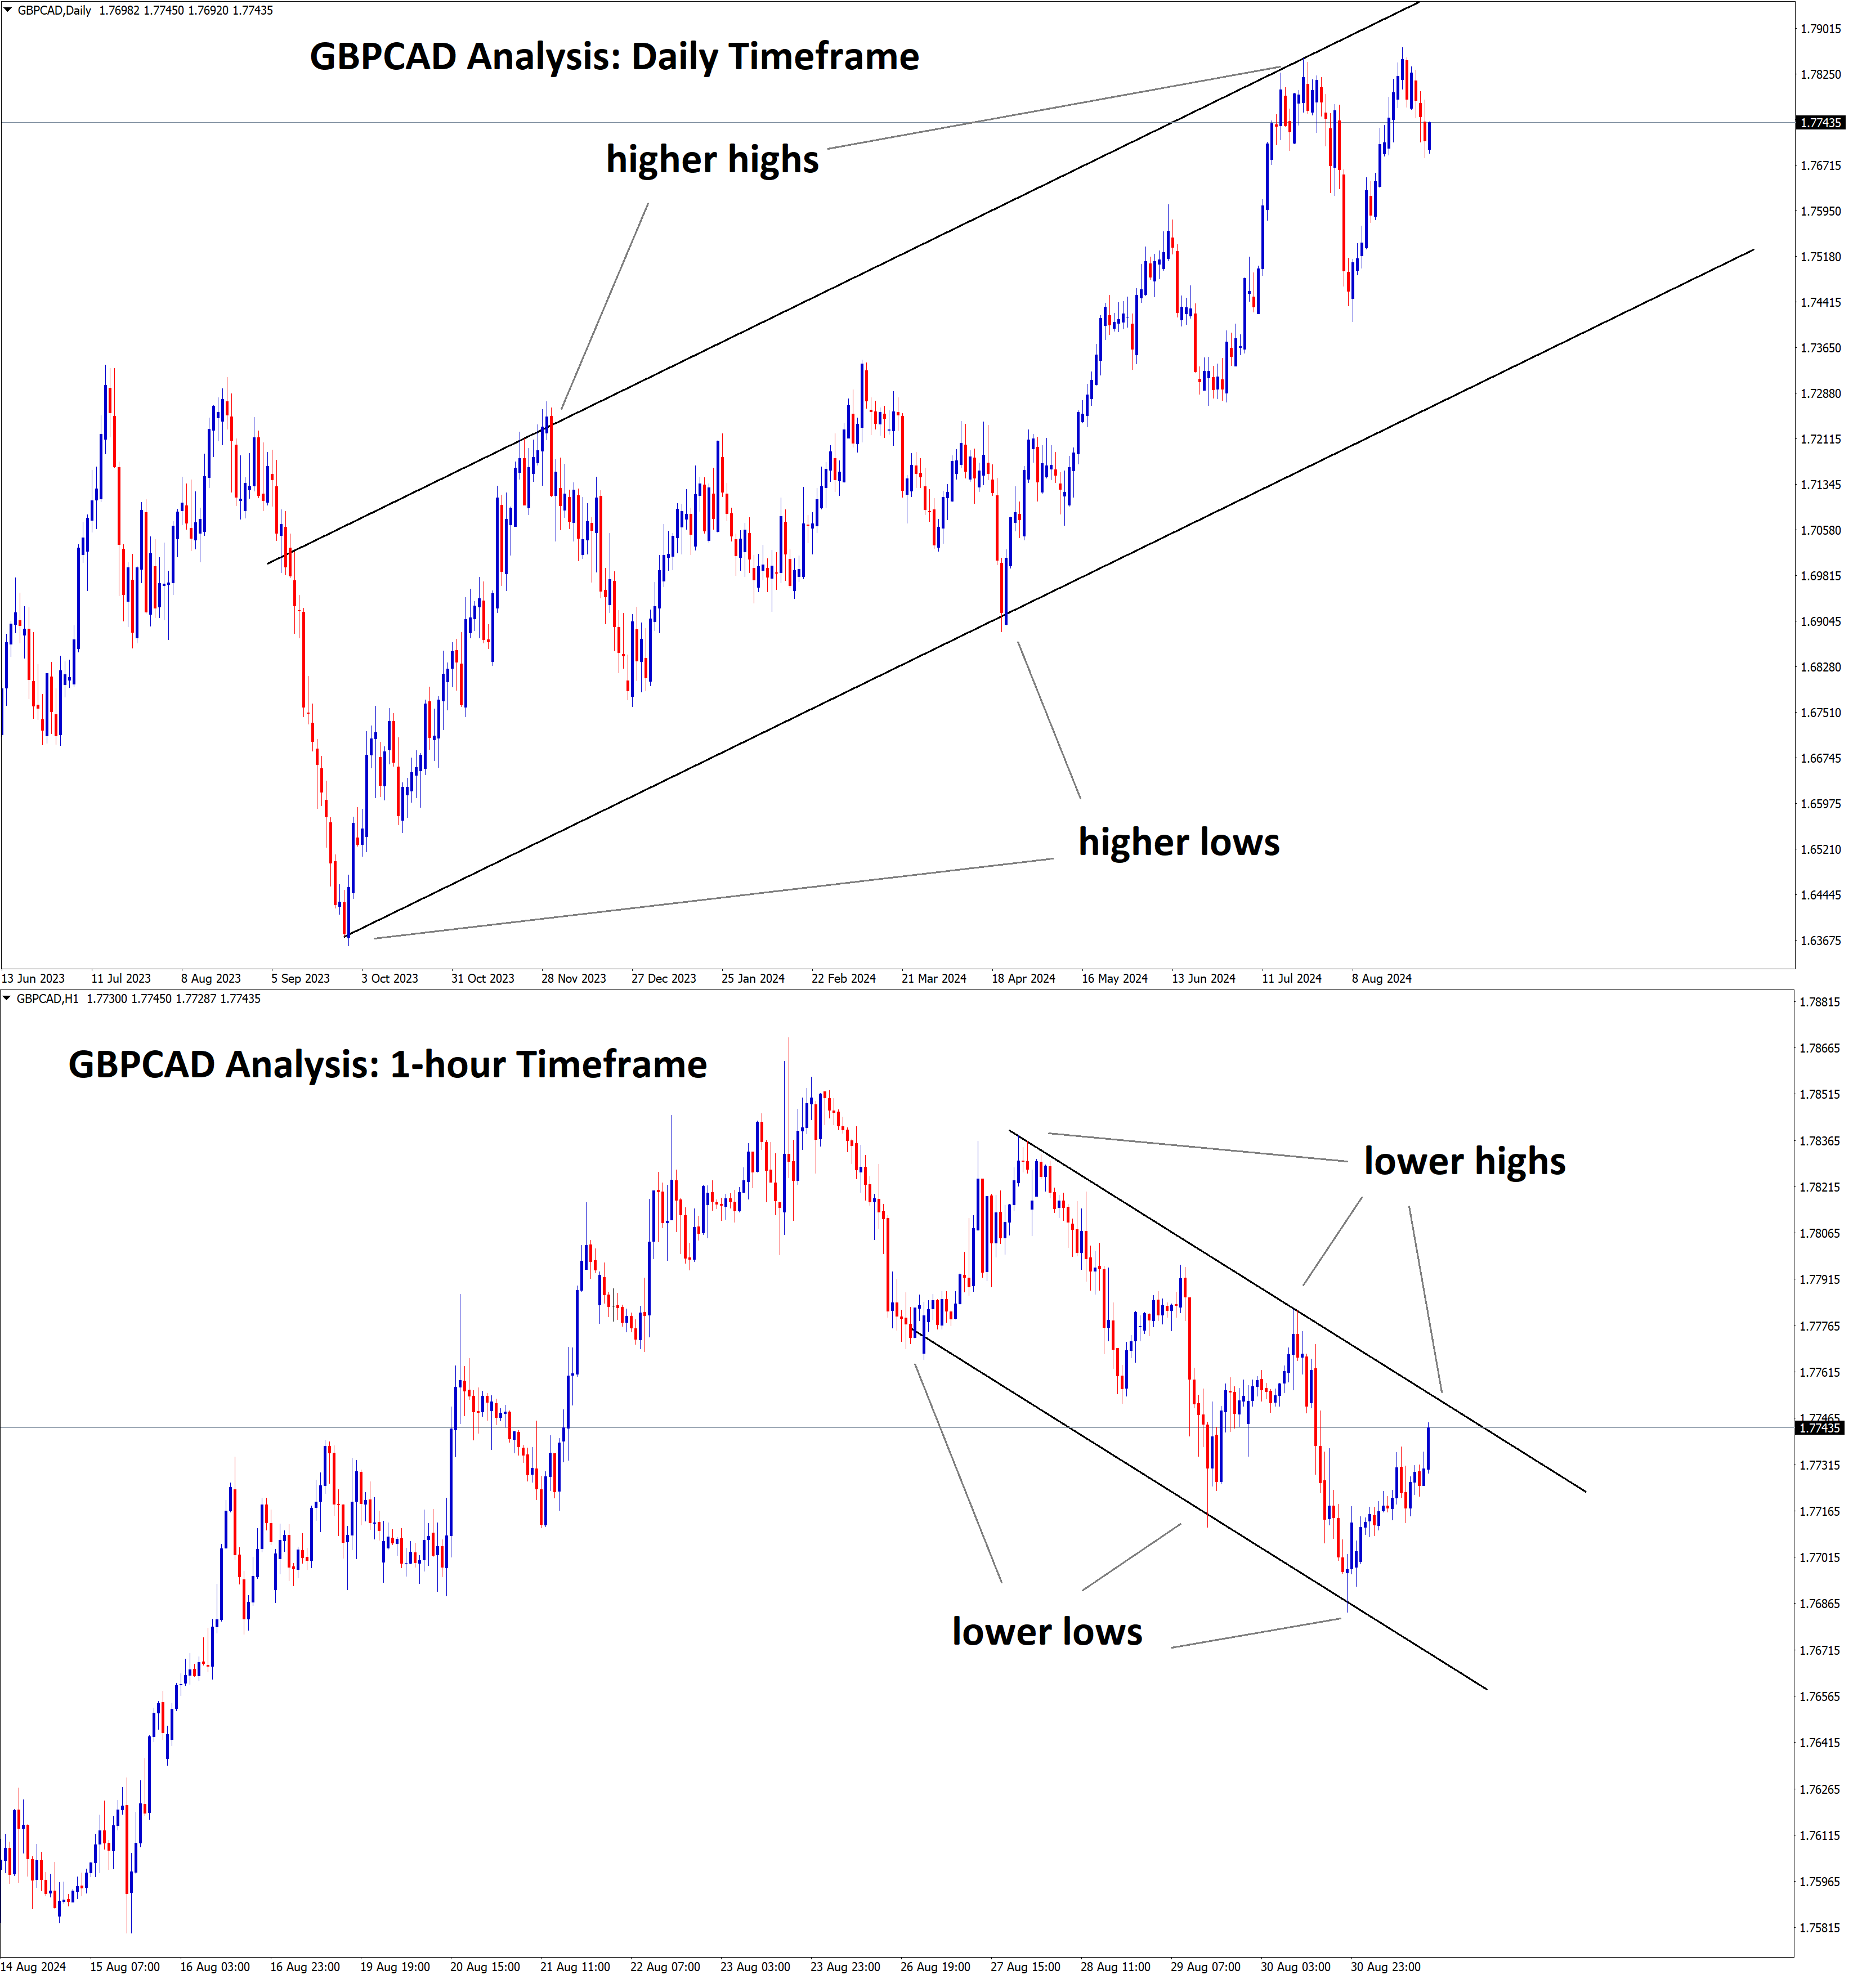
GBPCAD Analysis GBPCAD is falling from the higher area of the Uptrend line in the daily timeframe chart. In the…
-
+480 Points Reached in GBPCAD Sell signal after falling from the higher high area
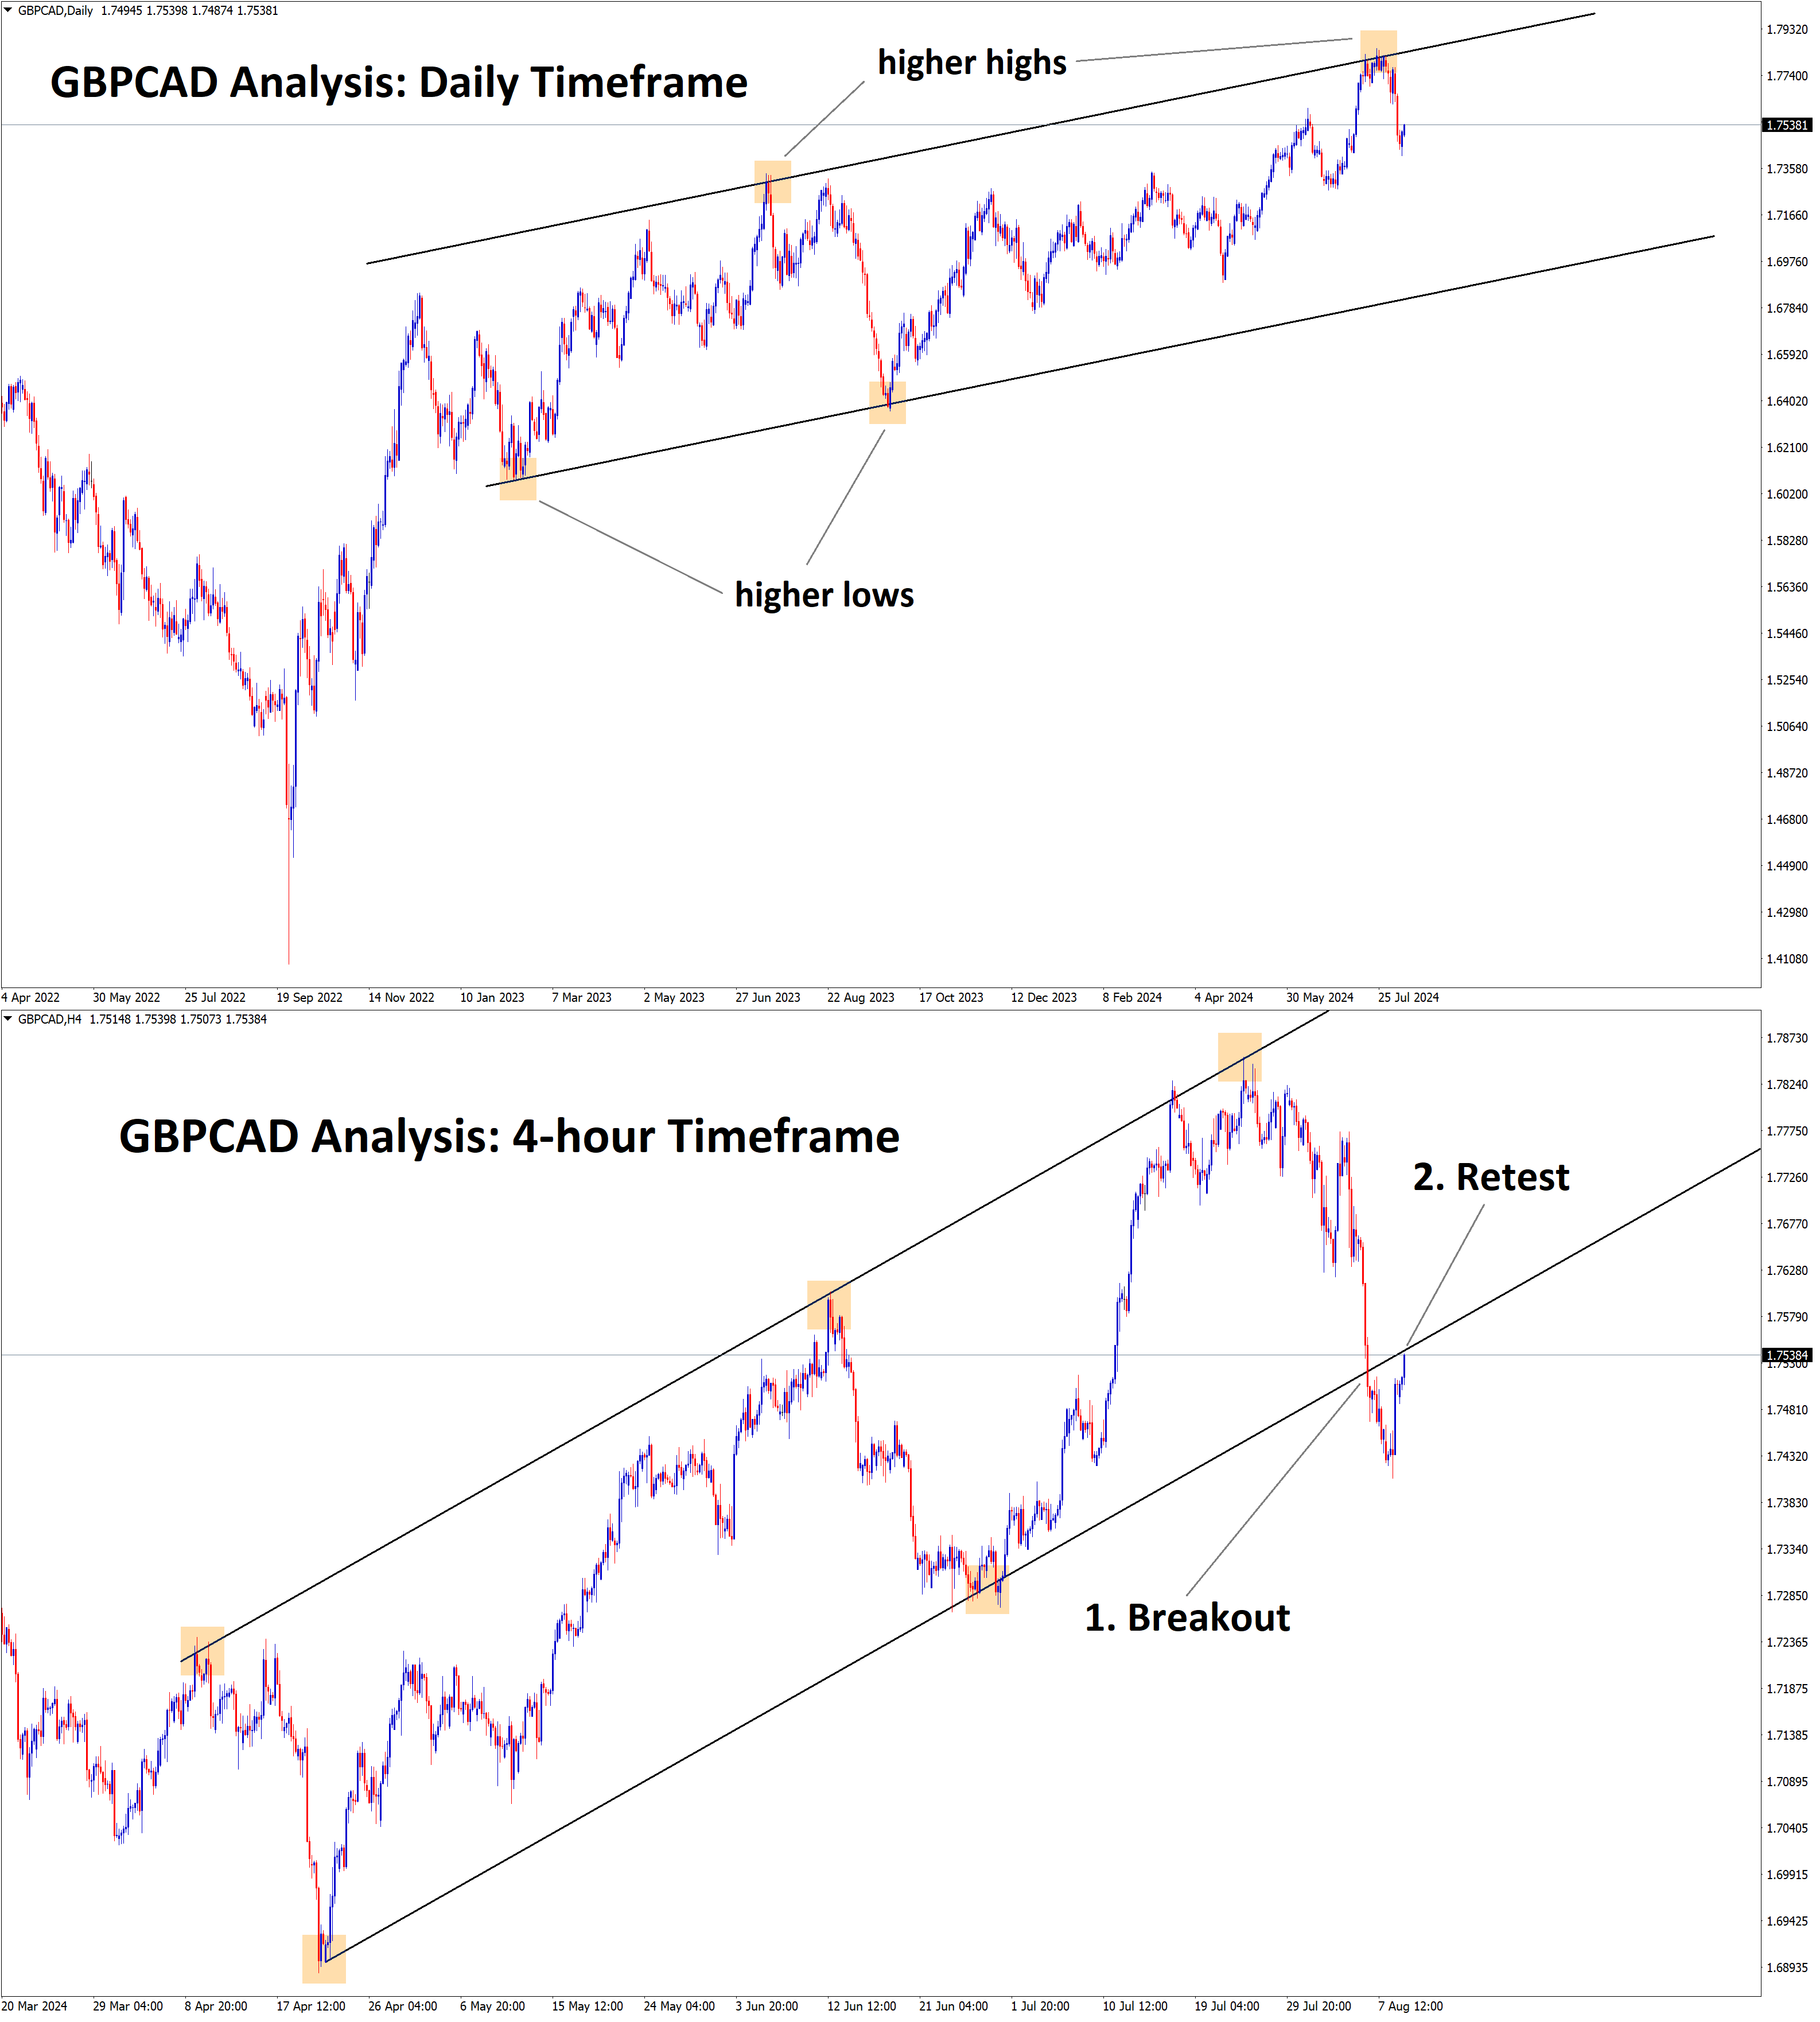
GBPCAD Analysis GBPCAD is falling from the higher high area of the Ascending channel in the daily timeframe chart. In…
-
+500 Points Reached in GBPCAD Buy signal after rebounding from the retest area of the broken Ascending Triangle
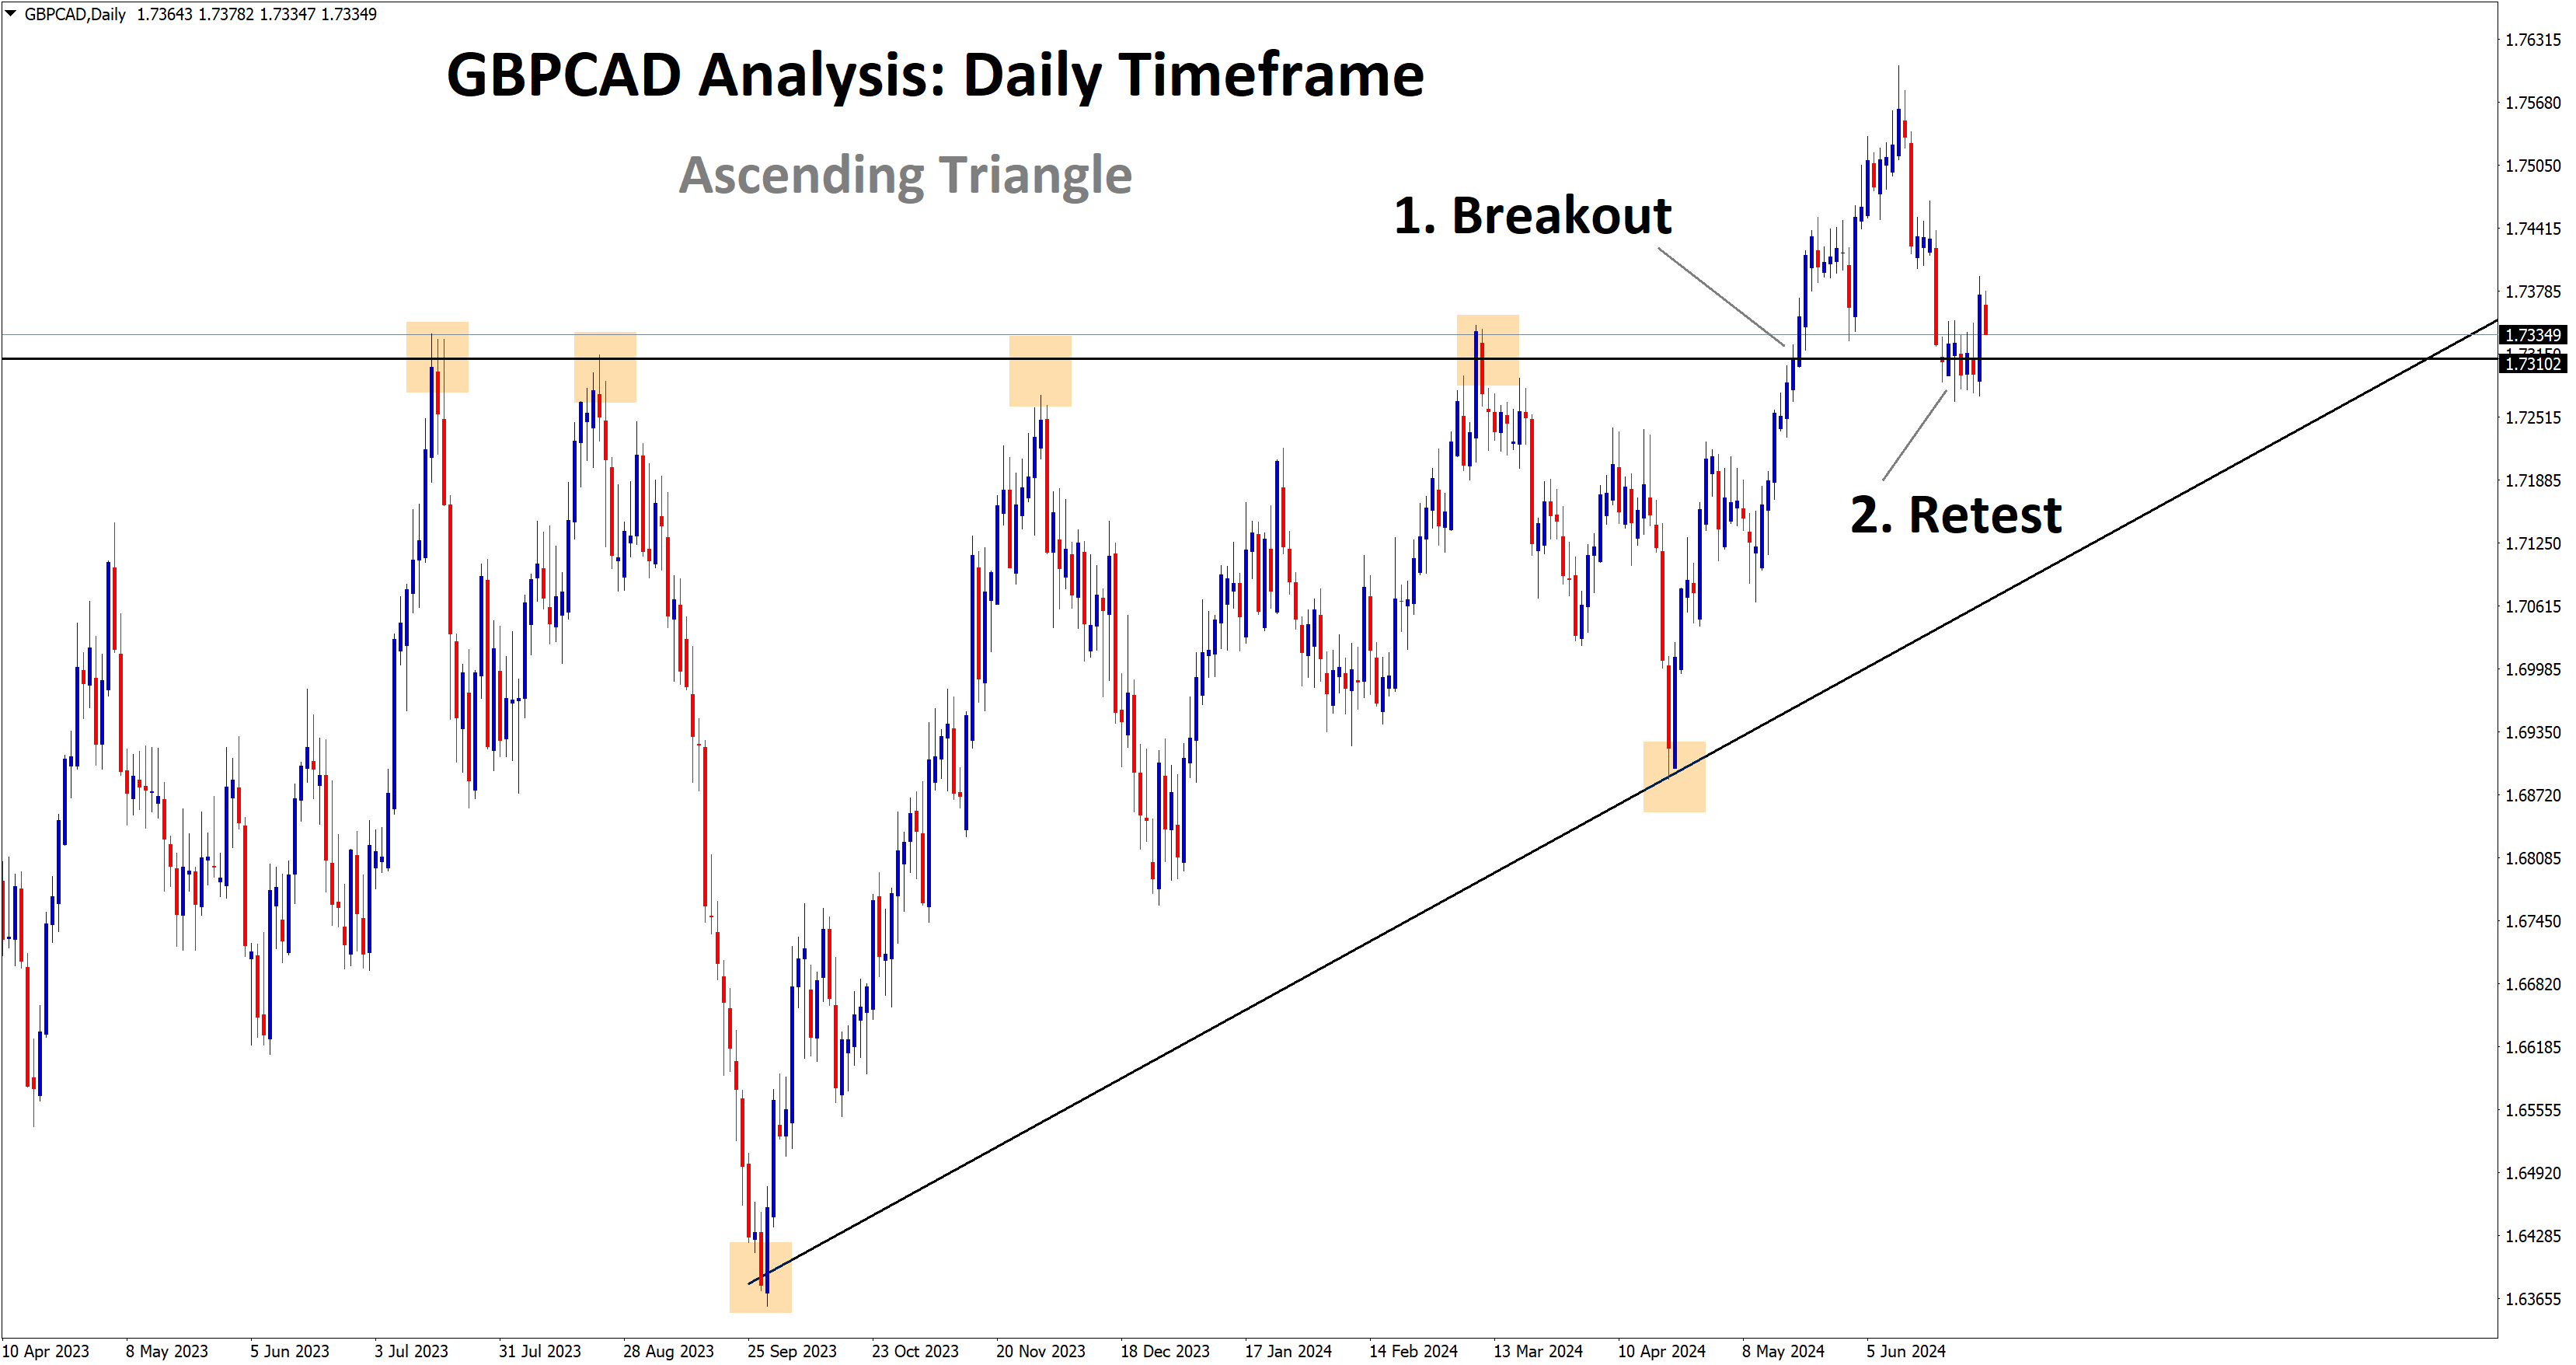
GBPCAD Analysis GBPCAD is rebounding from the retest area of the broken Ascending Triangle pattern in the daily timeframe chart…
-
+750 Points Reached in GBPCAD Sell signal after reached retest and the lower high area
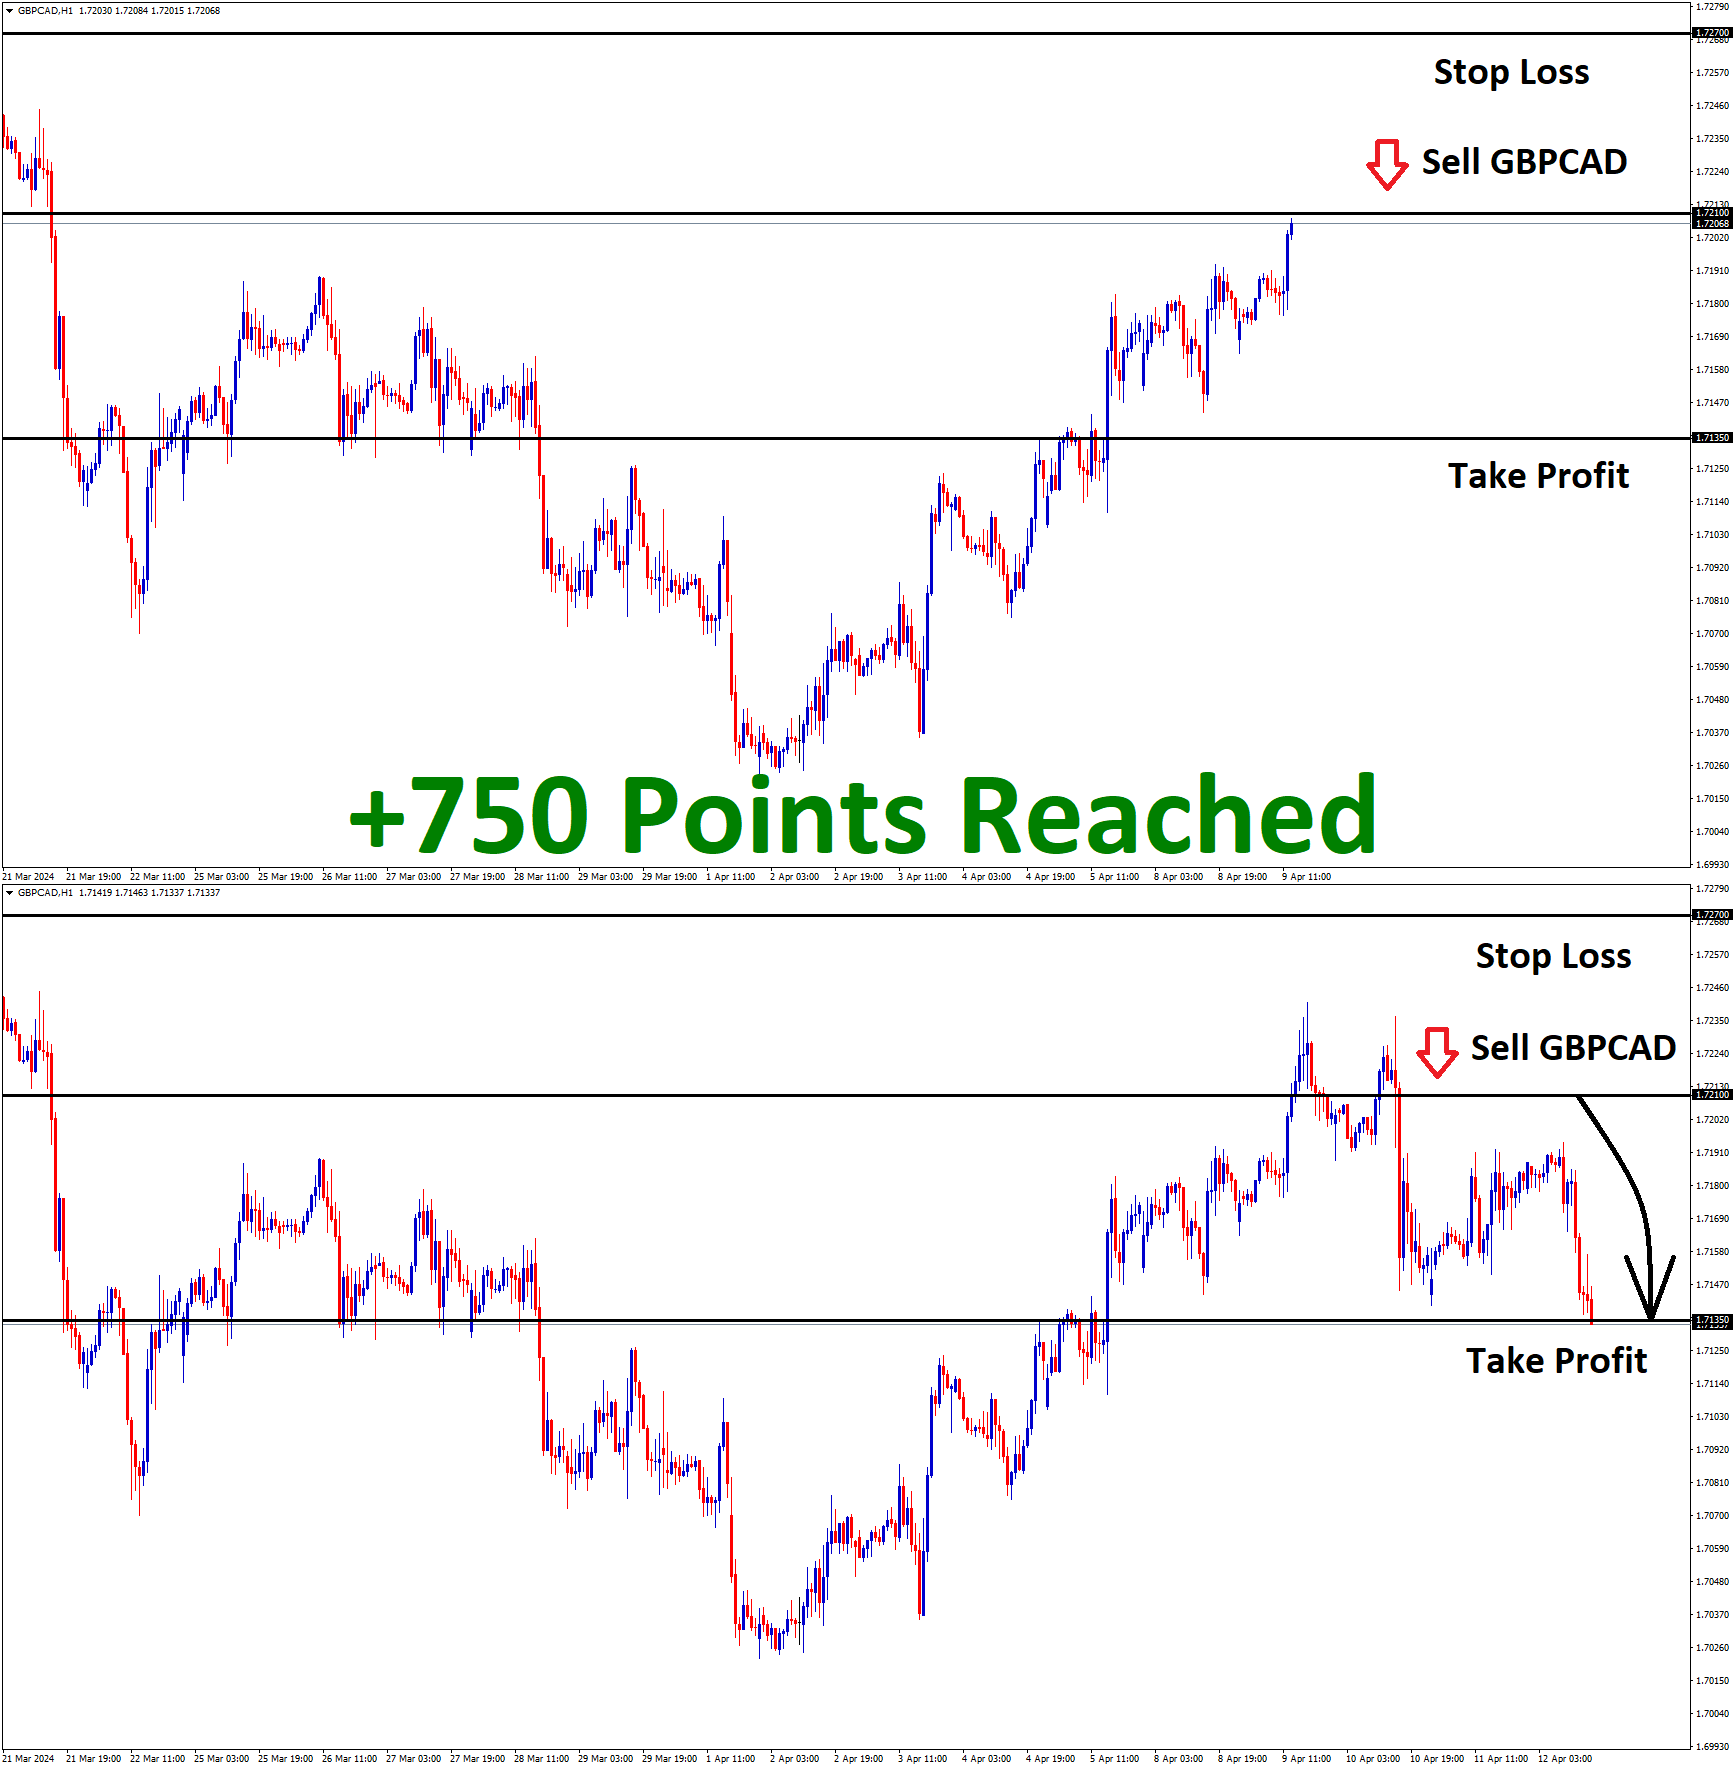
GBPCAD Analysis GBPCAD at the retest and the lower high area of the channel in the 4-hour timeframe chart After…
-
+500 Points Reached in GBPCAD Sell signal after falling from the major resistance area
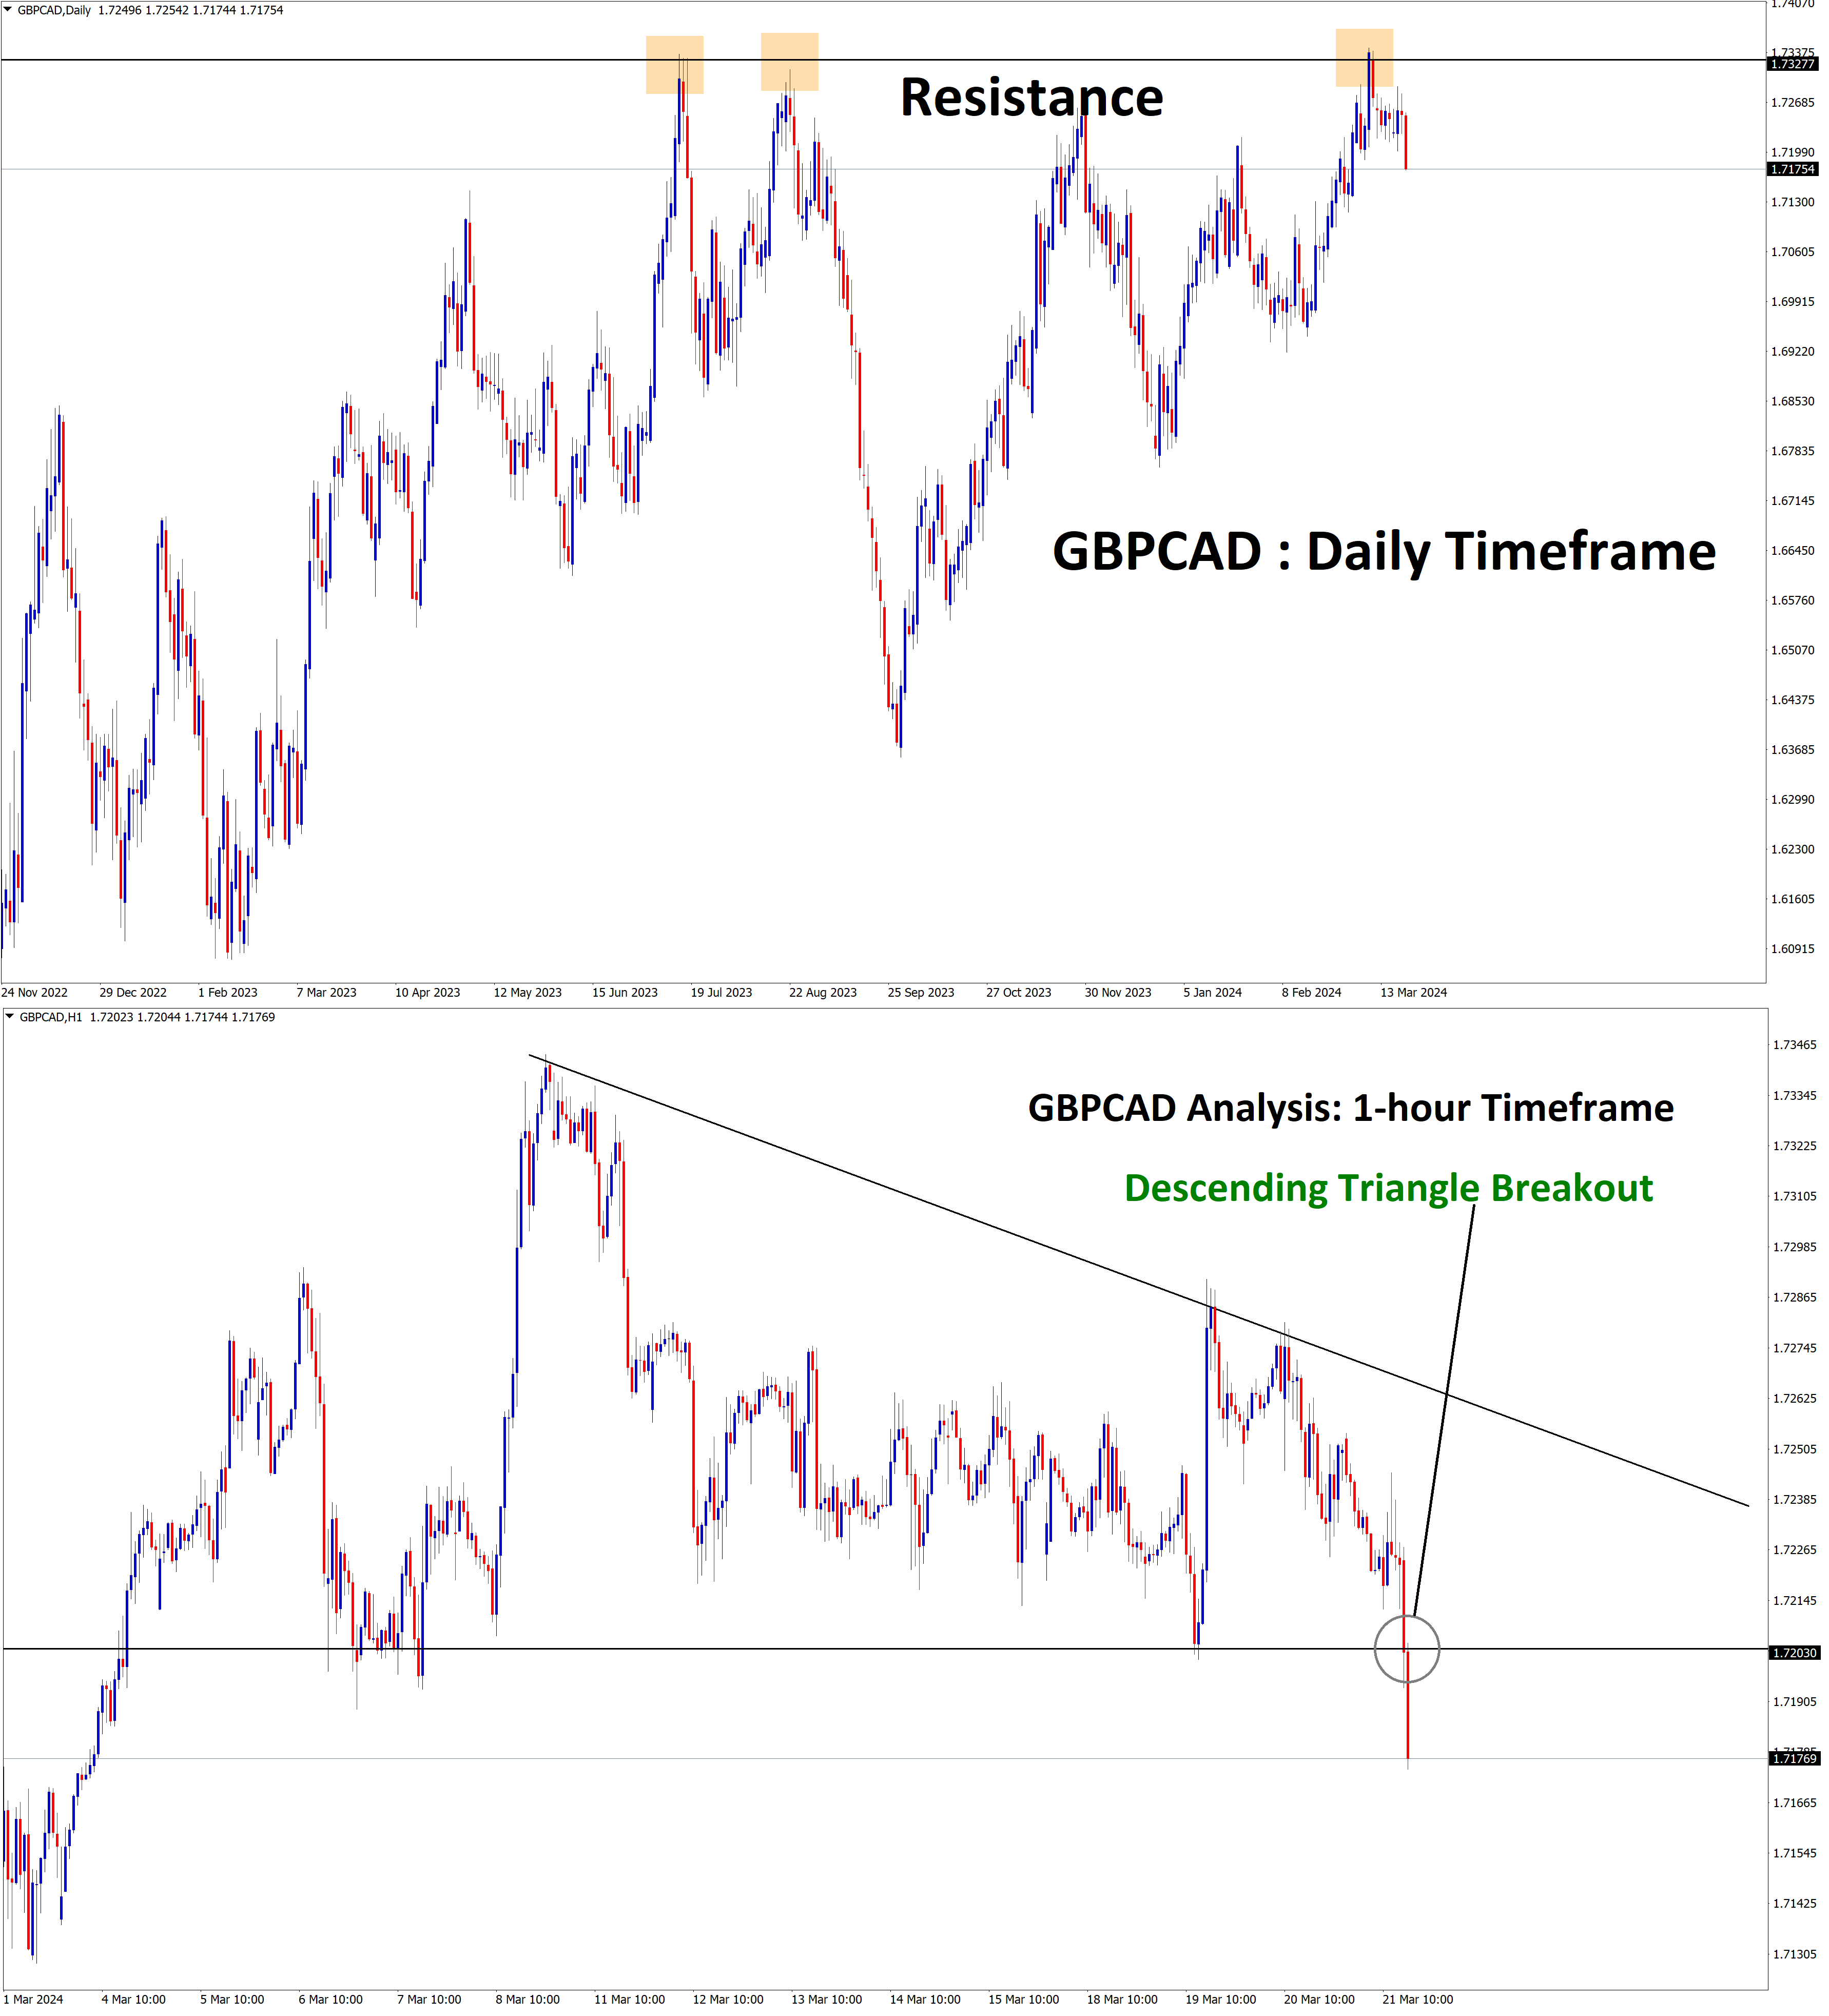
GBPCAD Analysis GBPCAD is falling from the major resistance in the daily timeframe chart. In the 1-hour timeframe, GBPCAD has…
-
GBPCAD is trying to Re-Enter the Box pattern which leads to -725 Points
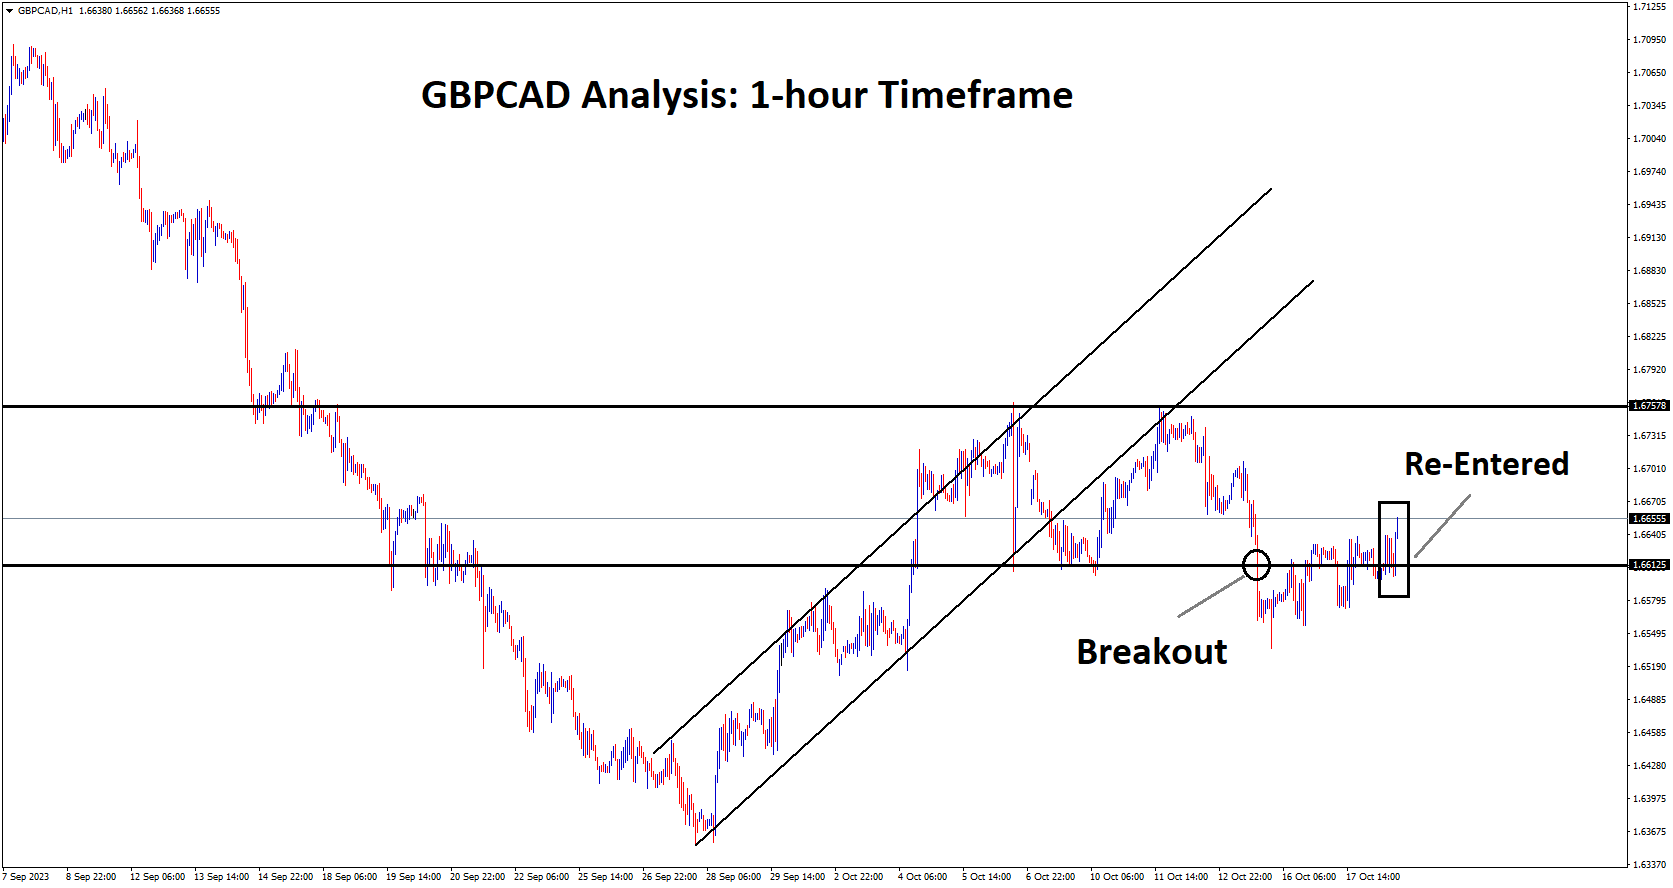
GBPCAD Analysis GBPCAD falling from the lower high area of the descending channel in the higher timeframe monthly chart In…
-
+800 Points Reached in GBPCAD Sell signal after breaking the bottom area of the ascending channel
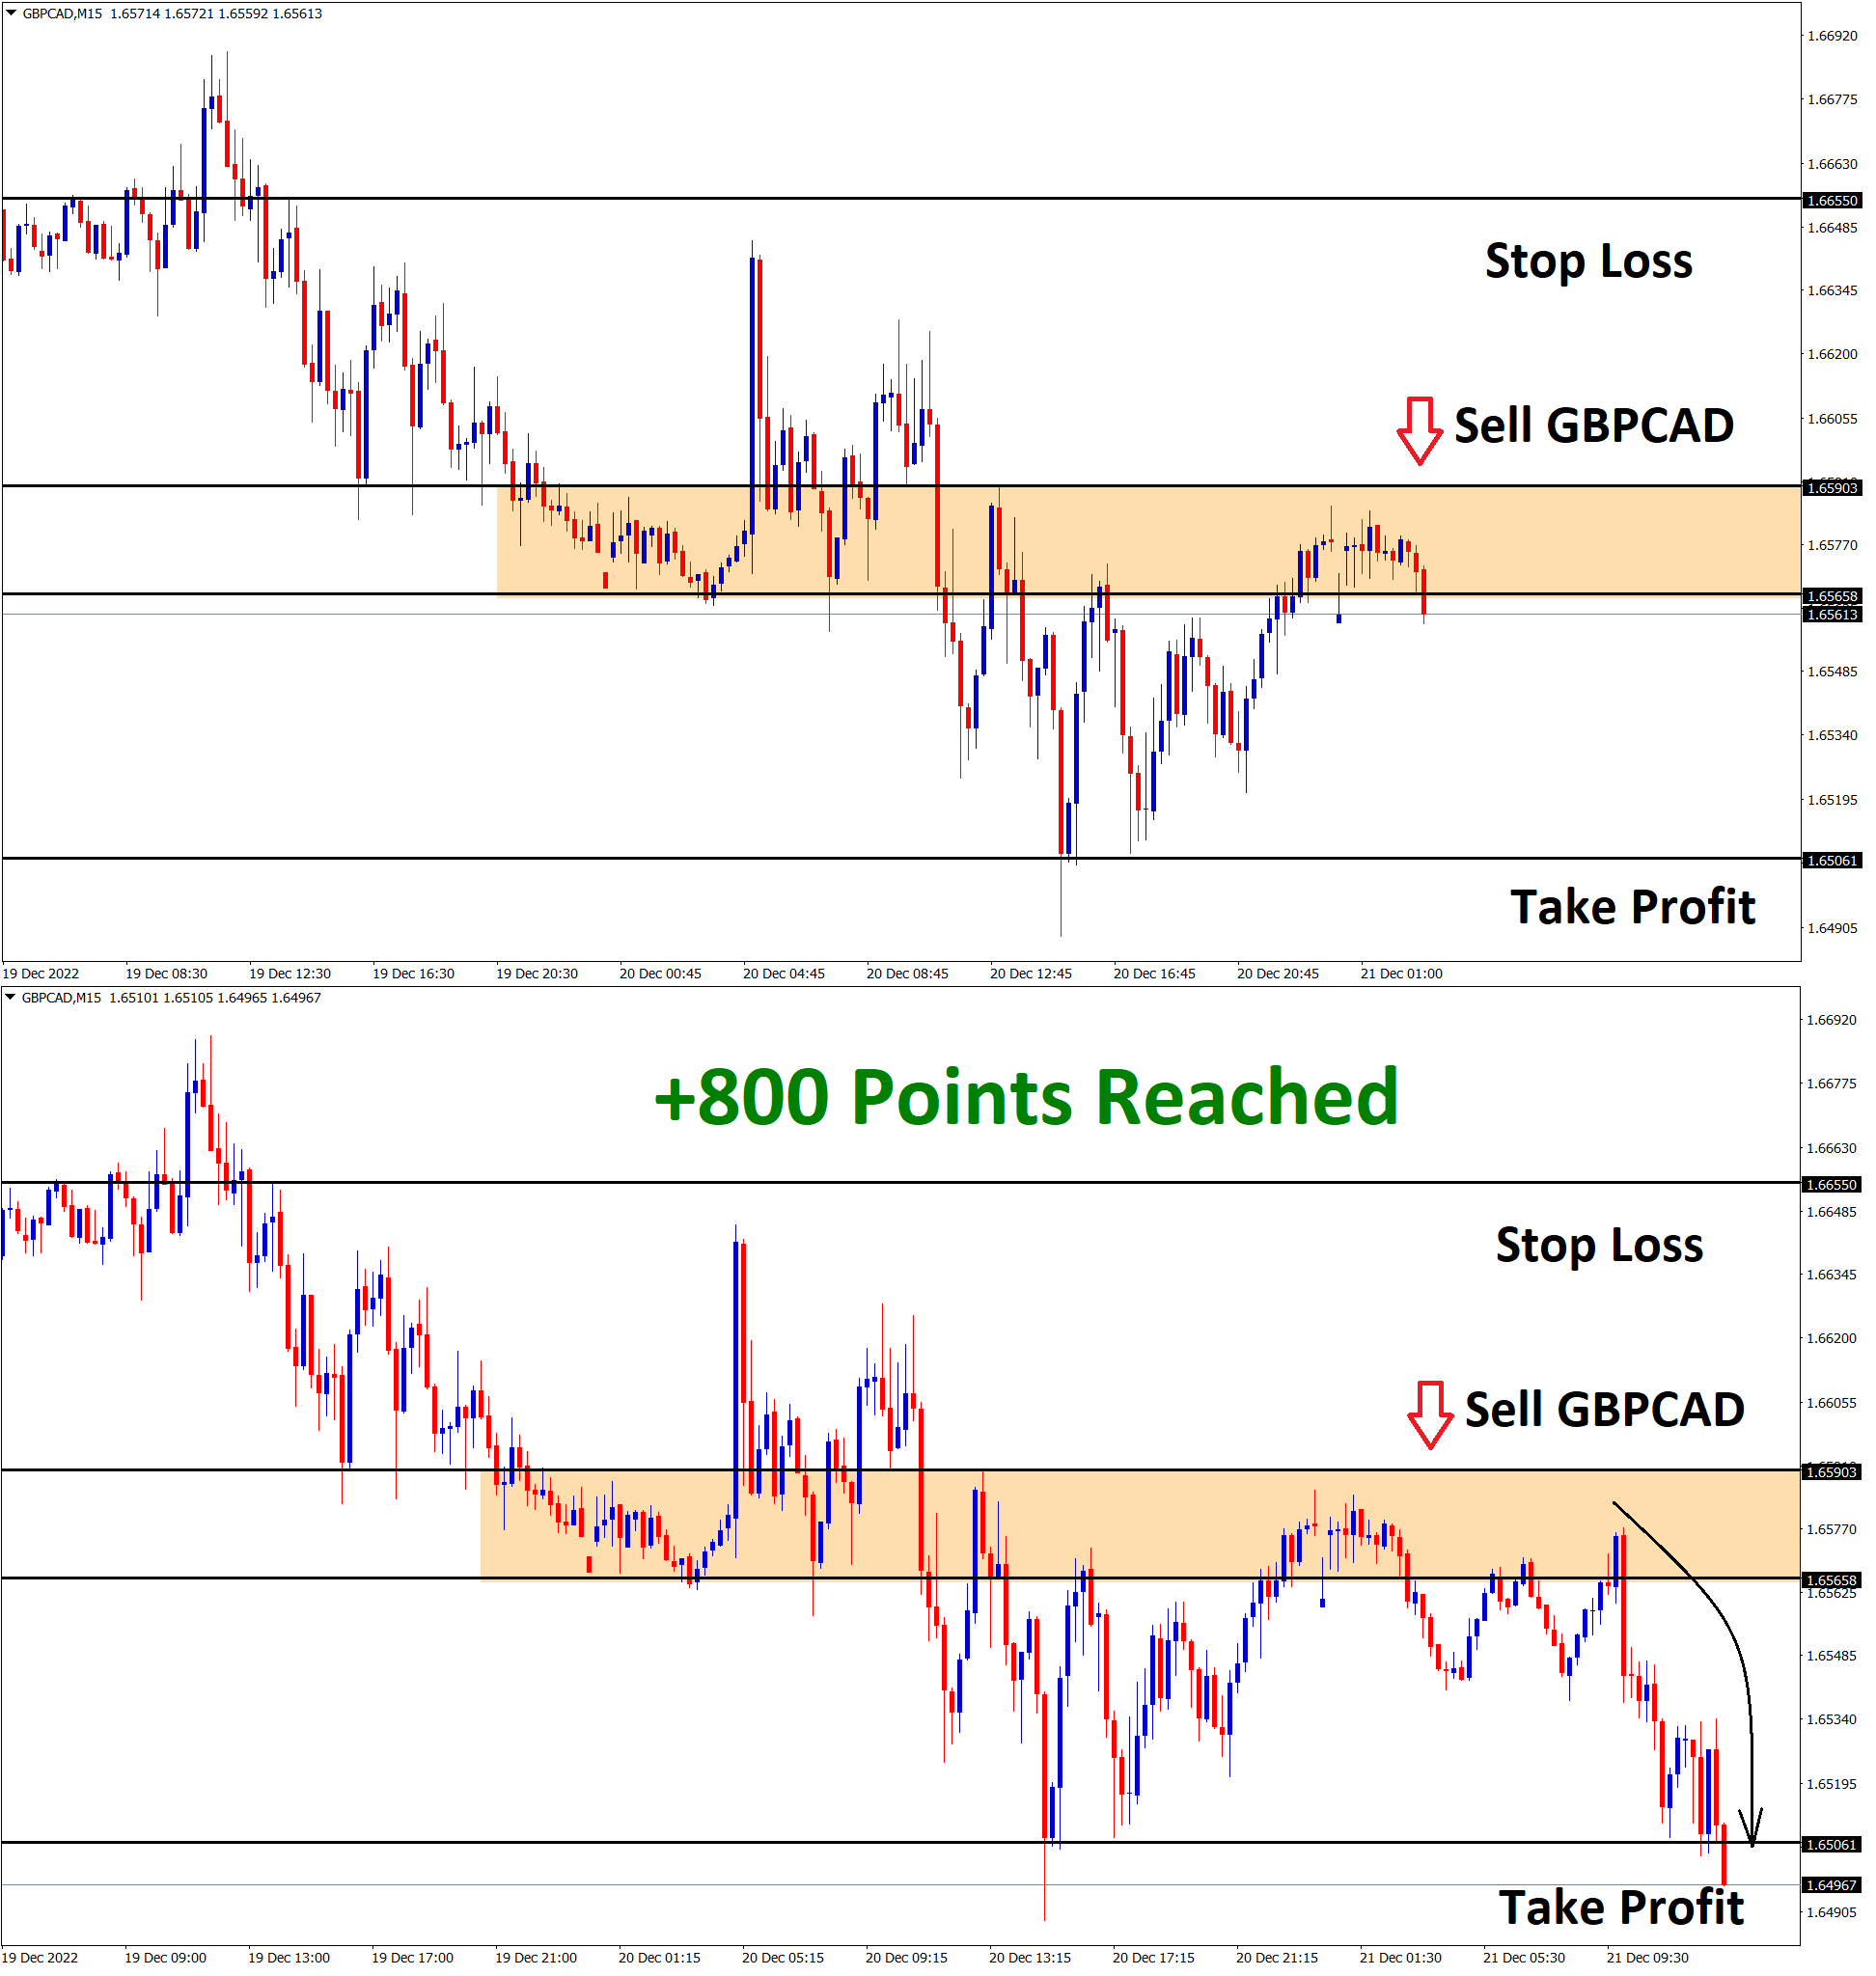
GBPCAD Analysis: GBPCAD has broken the bottom area of the ascending channel and moving in a minor descending channel now…
-
+790 Points Reached in GBPCAD Buy signal after rebounding from the lower low area of the descending channel
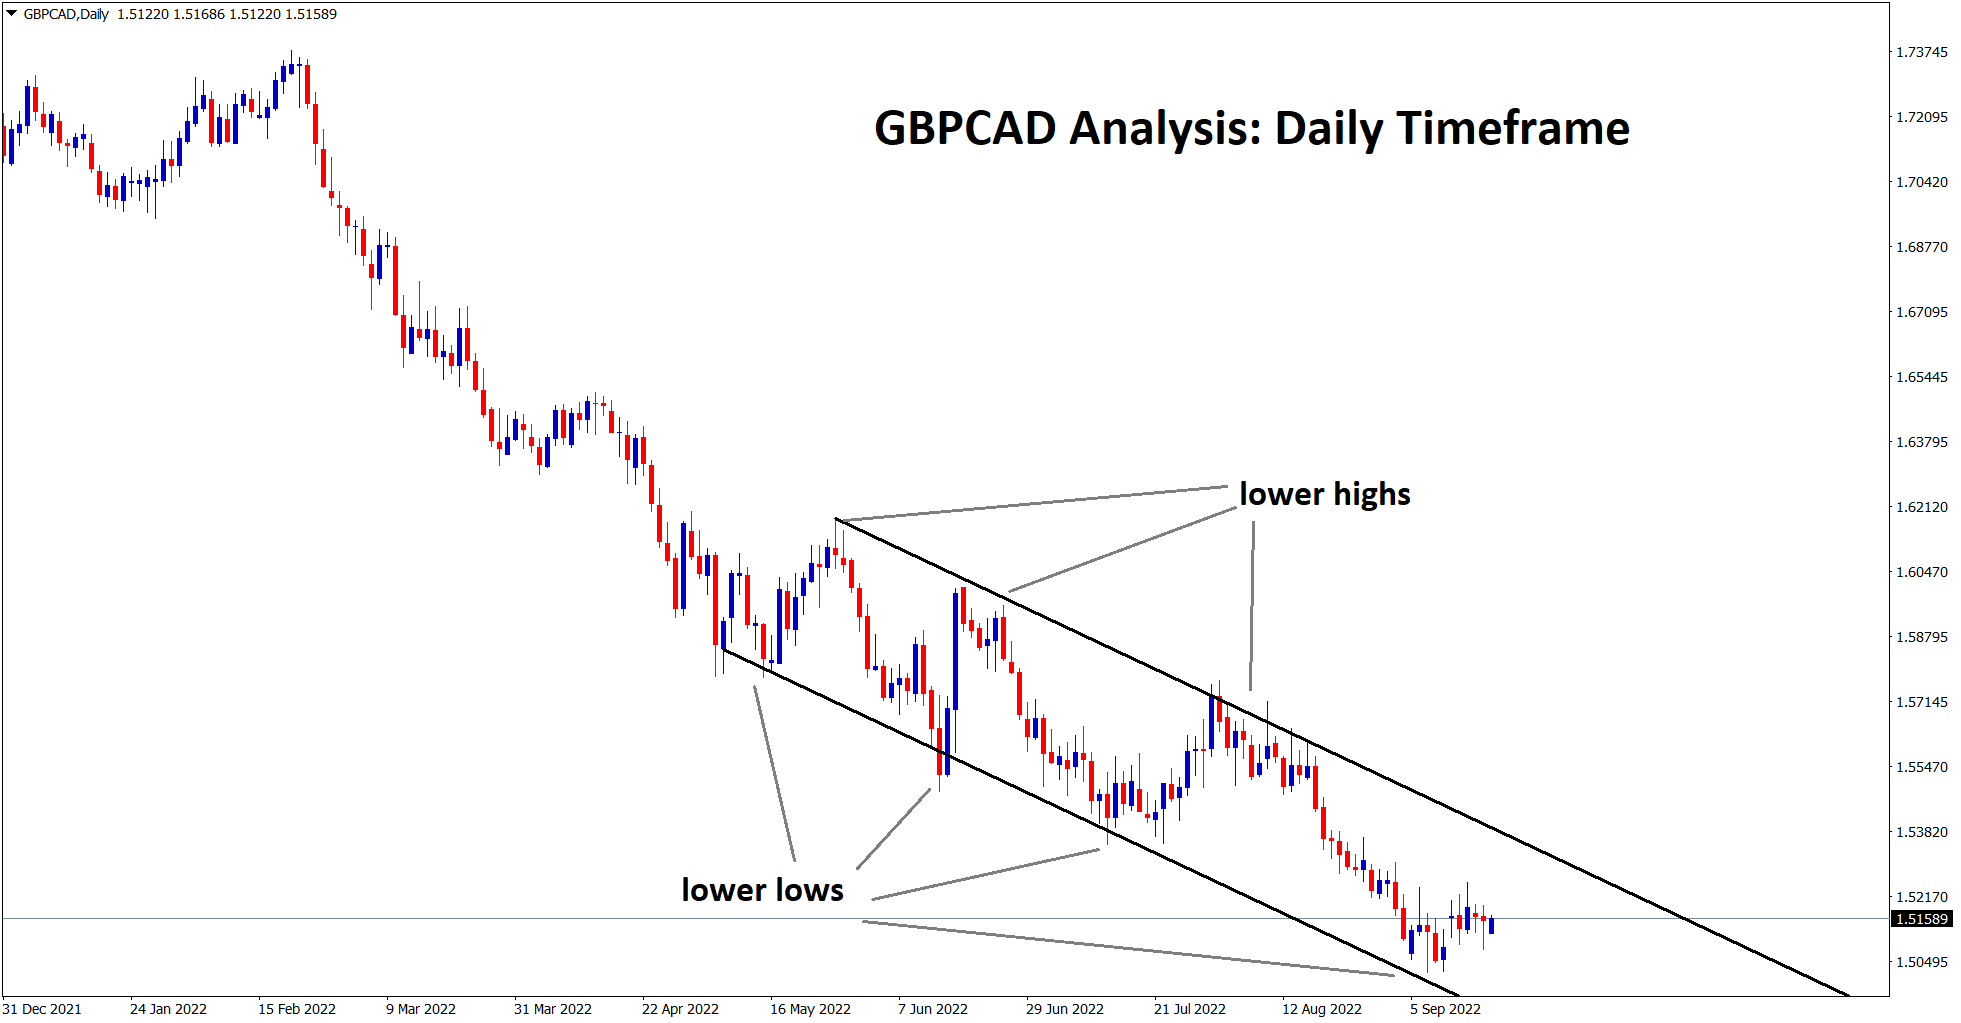
GBPCAD Analysis: GBPCAD is rebounding from the lower low area of the descending channel in the daily timeframe chart. [caption…
-
+700 Points Reached in GBPCAD Buy signal after broken the top resistance area
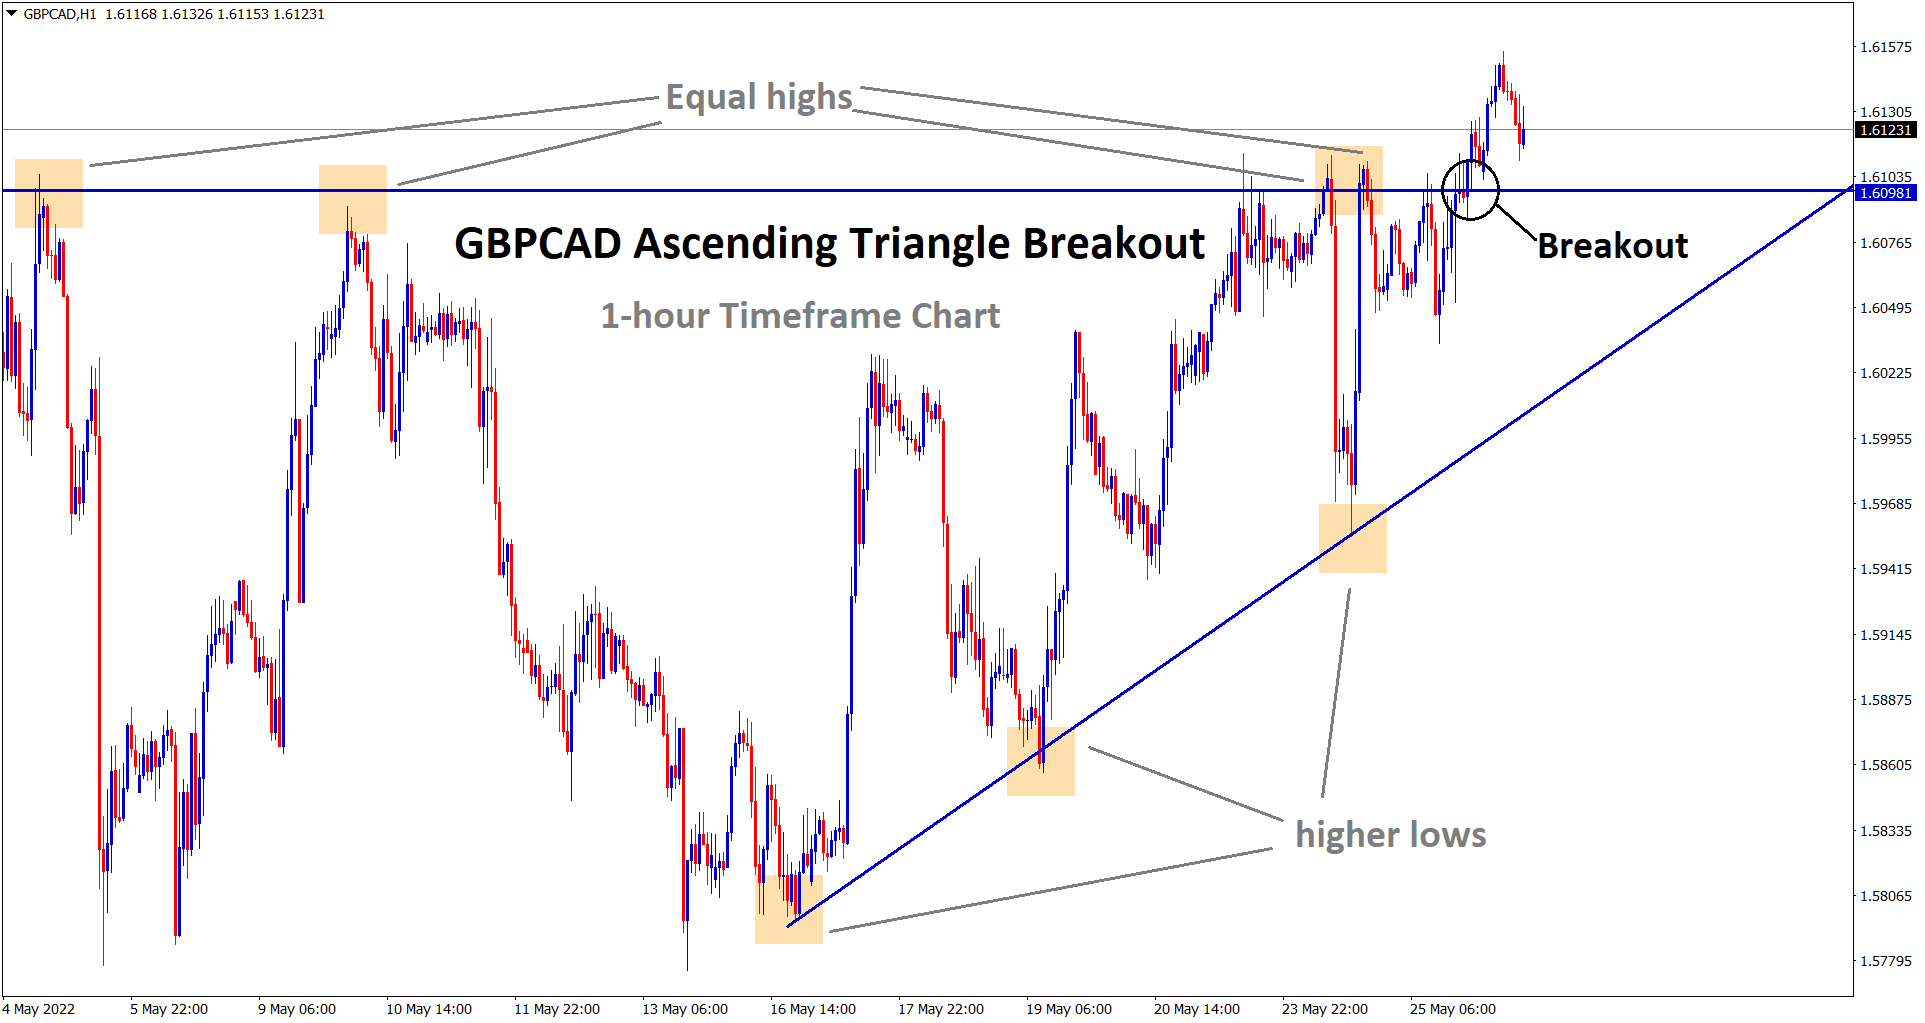
GBPCAD Analysis: GBPCAD has broken the top resistance area of the Ascending Triangle Pattern in the 1-hour timeframe chart. After…
-
+520 Points reached in GBPCAD sell signal after hitting lower high area of the descending channel
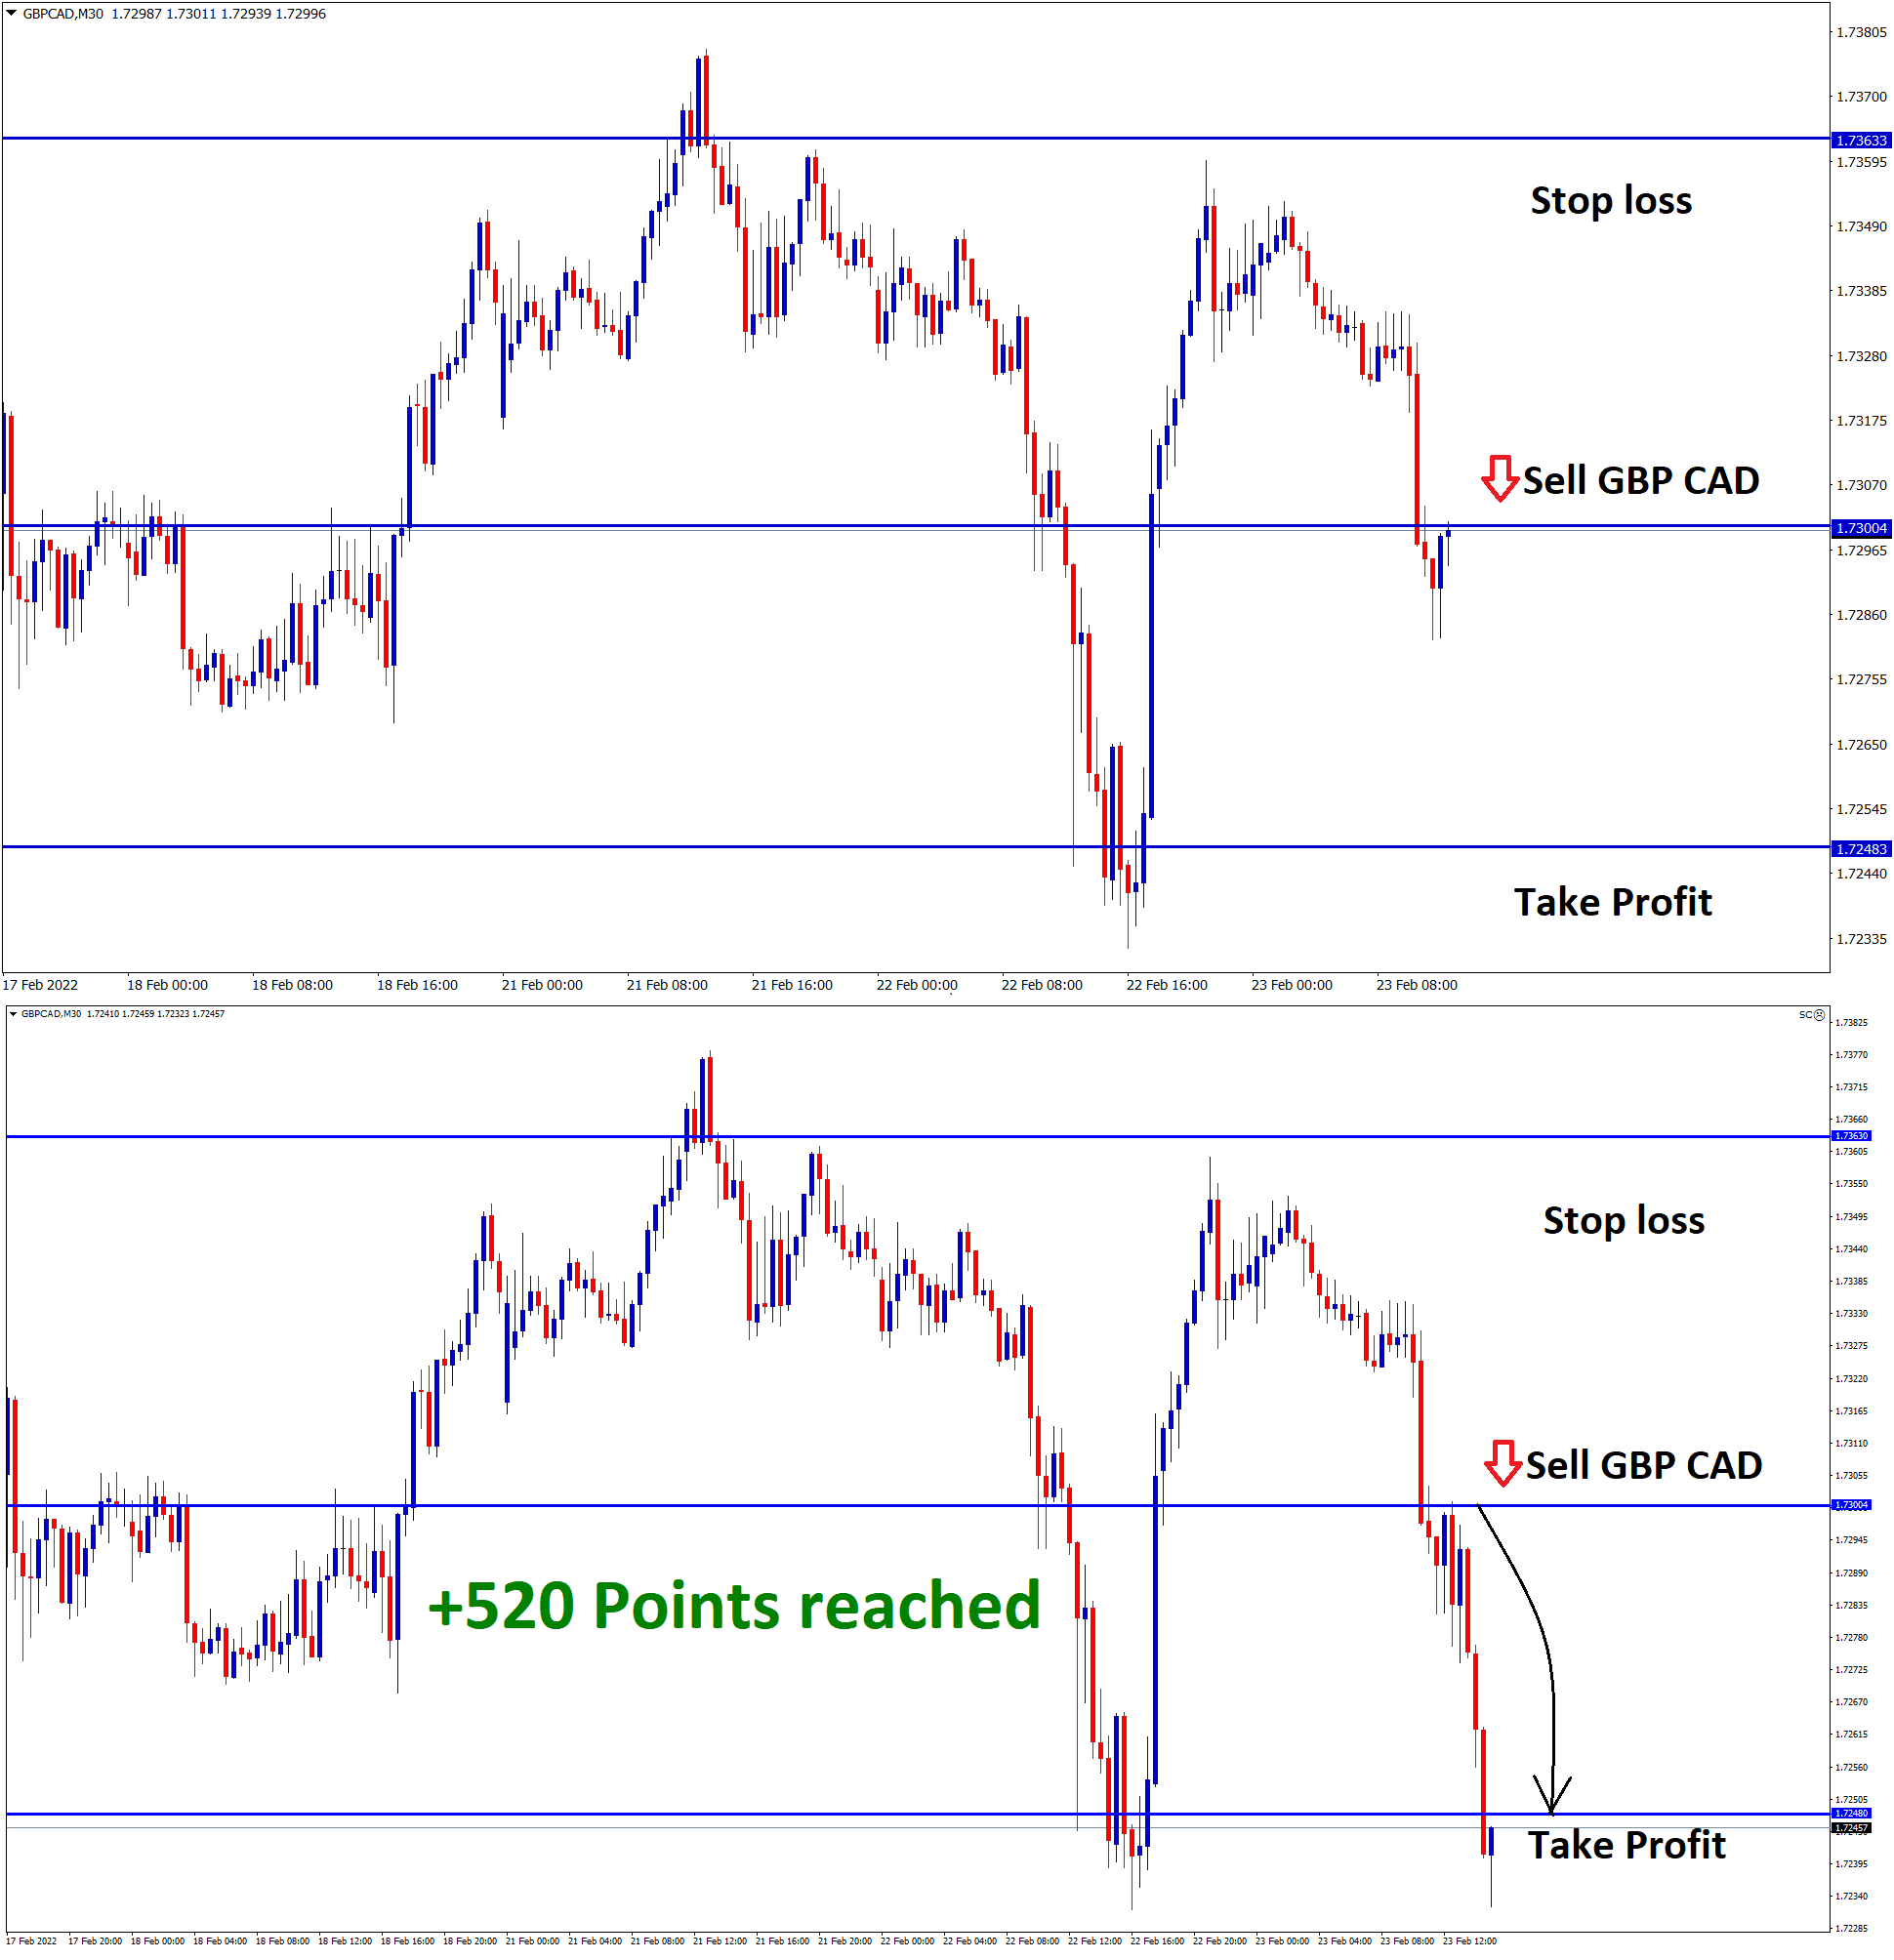
GBPCAD Analysis: GBPCAD hits the lower high area of the descending channel line in the daily timeframe chart. In the…
-
+670 points reached in GBPCAD buy signal after rebounding from the lower low level of the descending channel
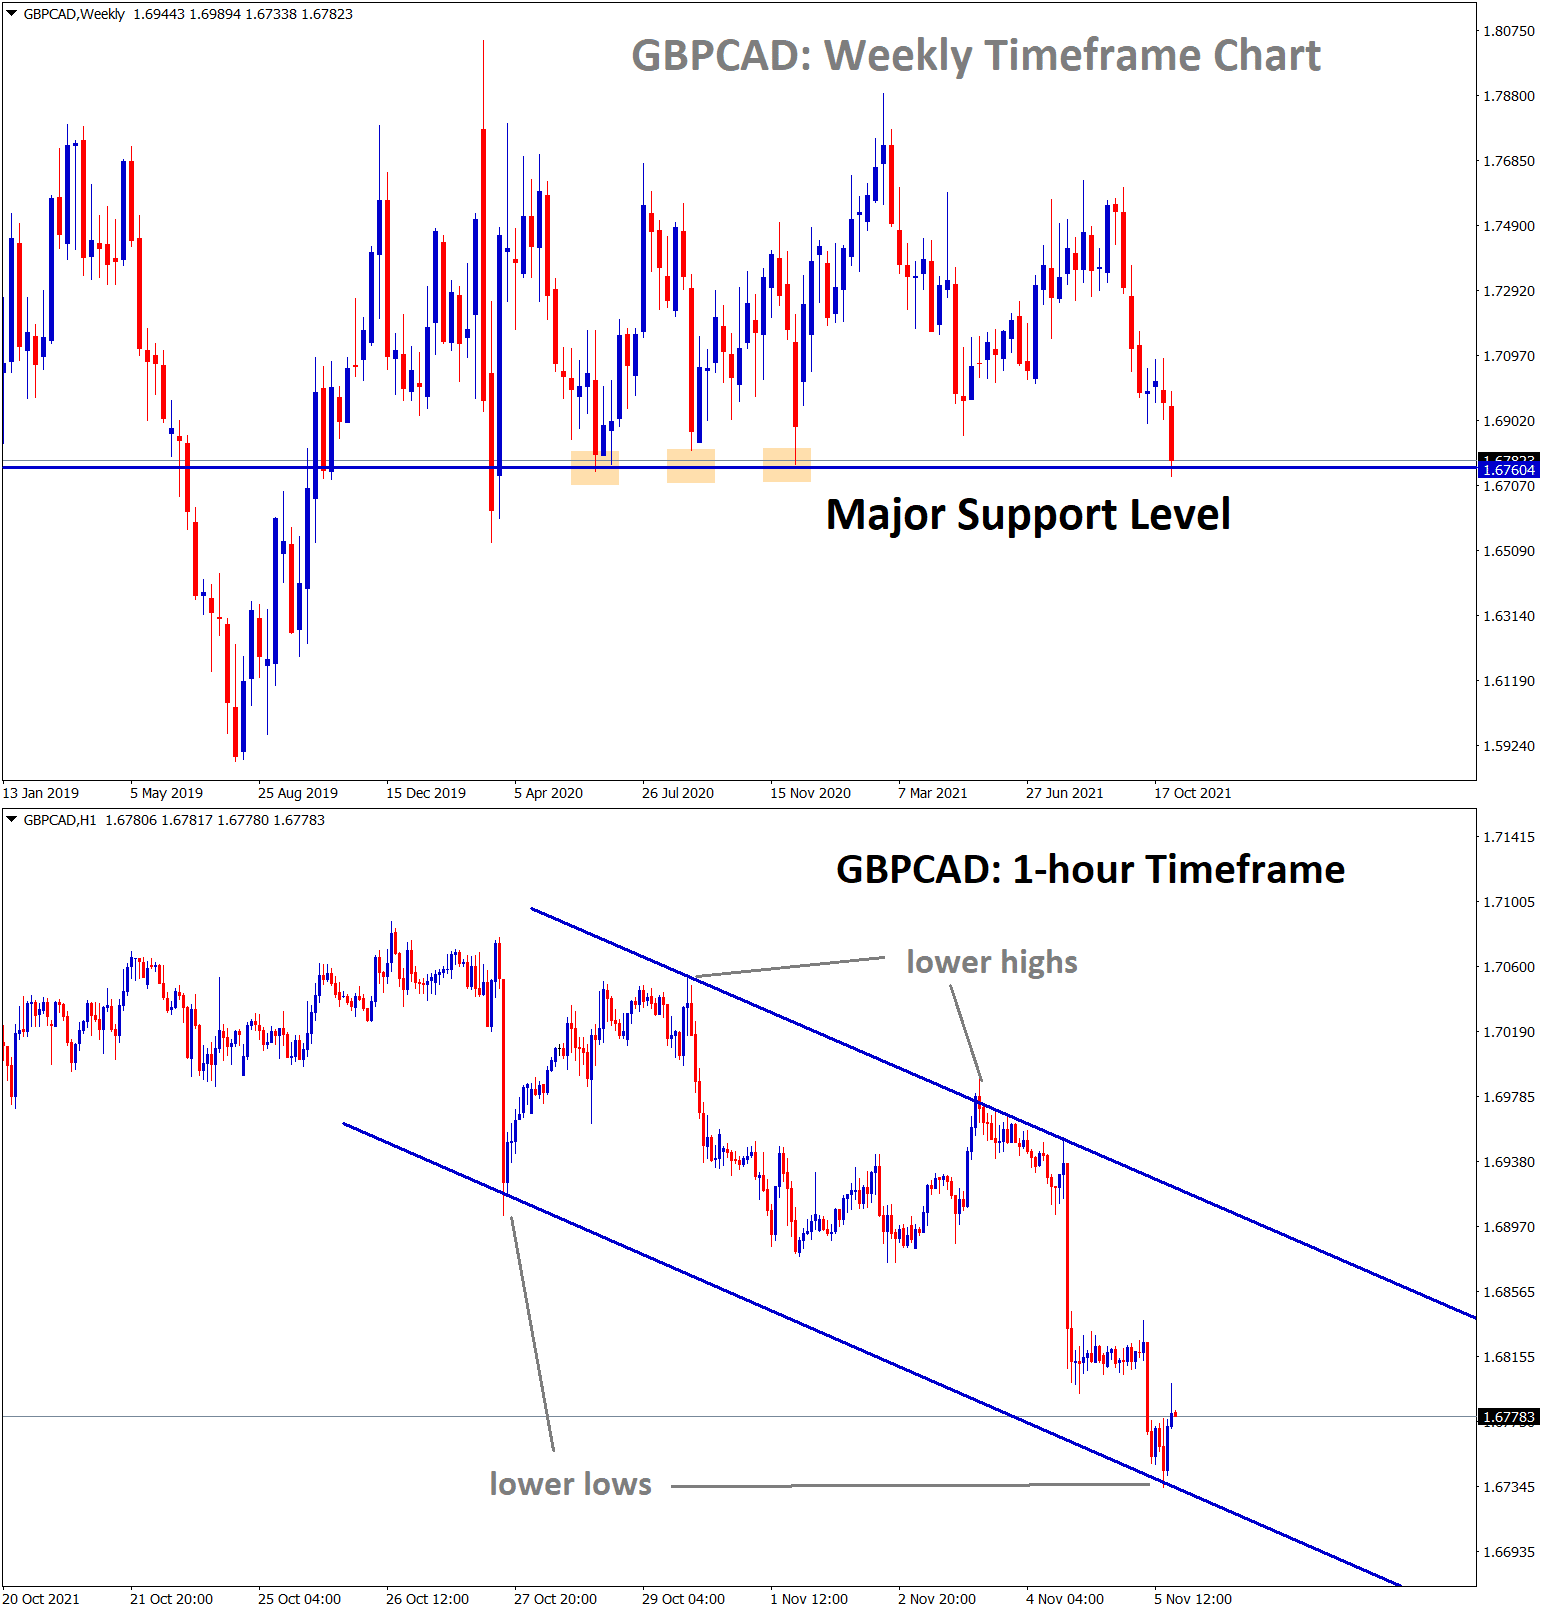
GBPCAD Analysis GBPCAD is rebounding from the lower low level of the descending channel in the 1-hour chart (smaller timeframe)…
- « Previous
- 1
- 2
- 3
- Next »