gbpchf long term
-
+1950 Points Reached in GBPCHF Sell signal after broken the horizontal support area
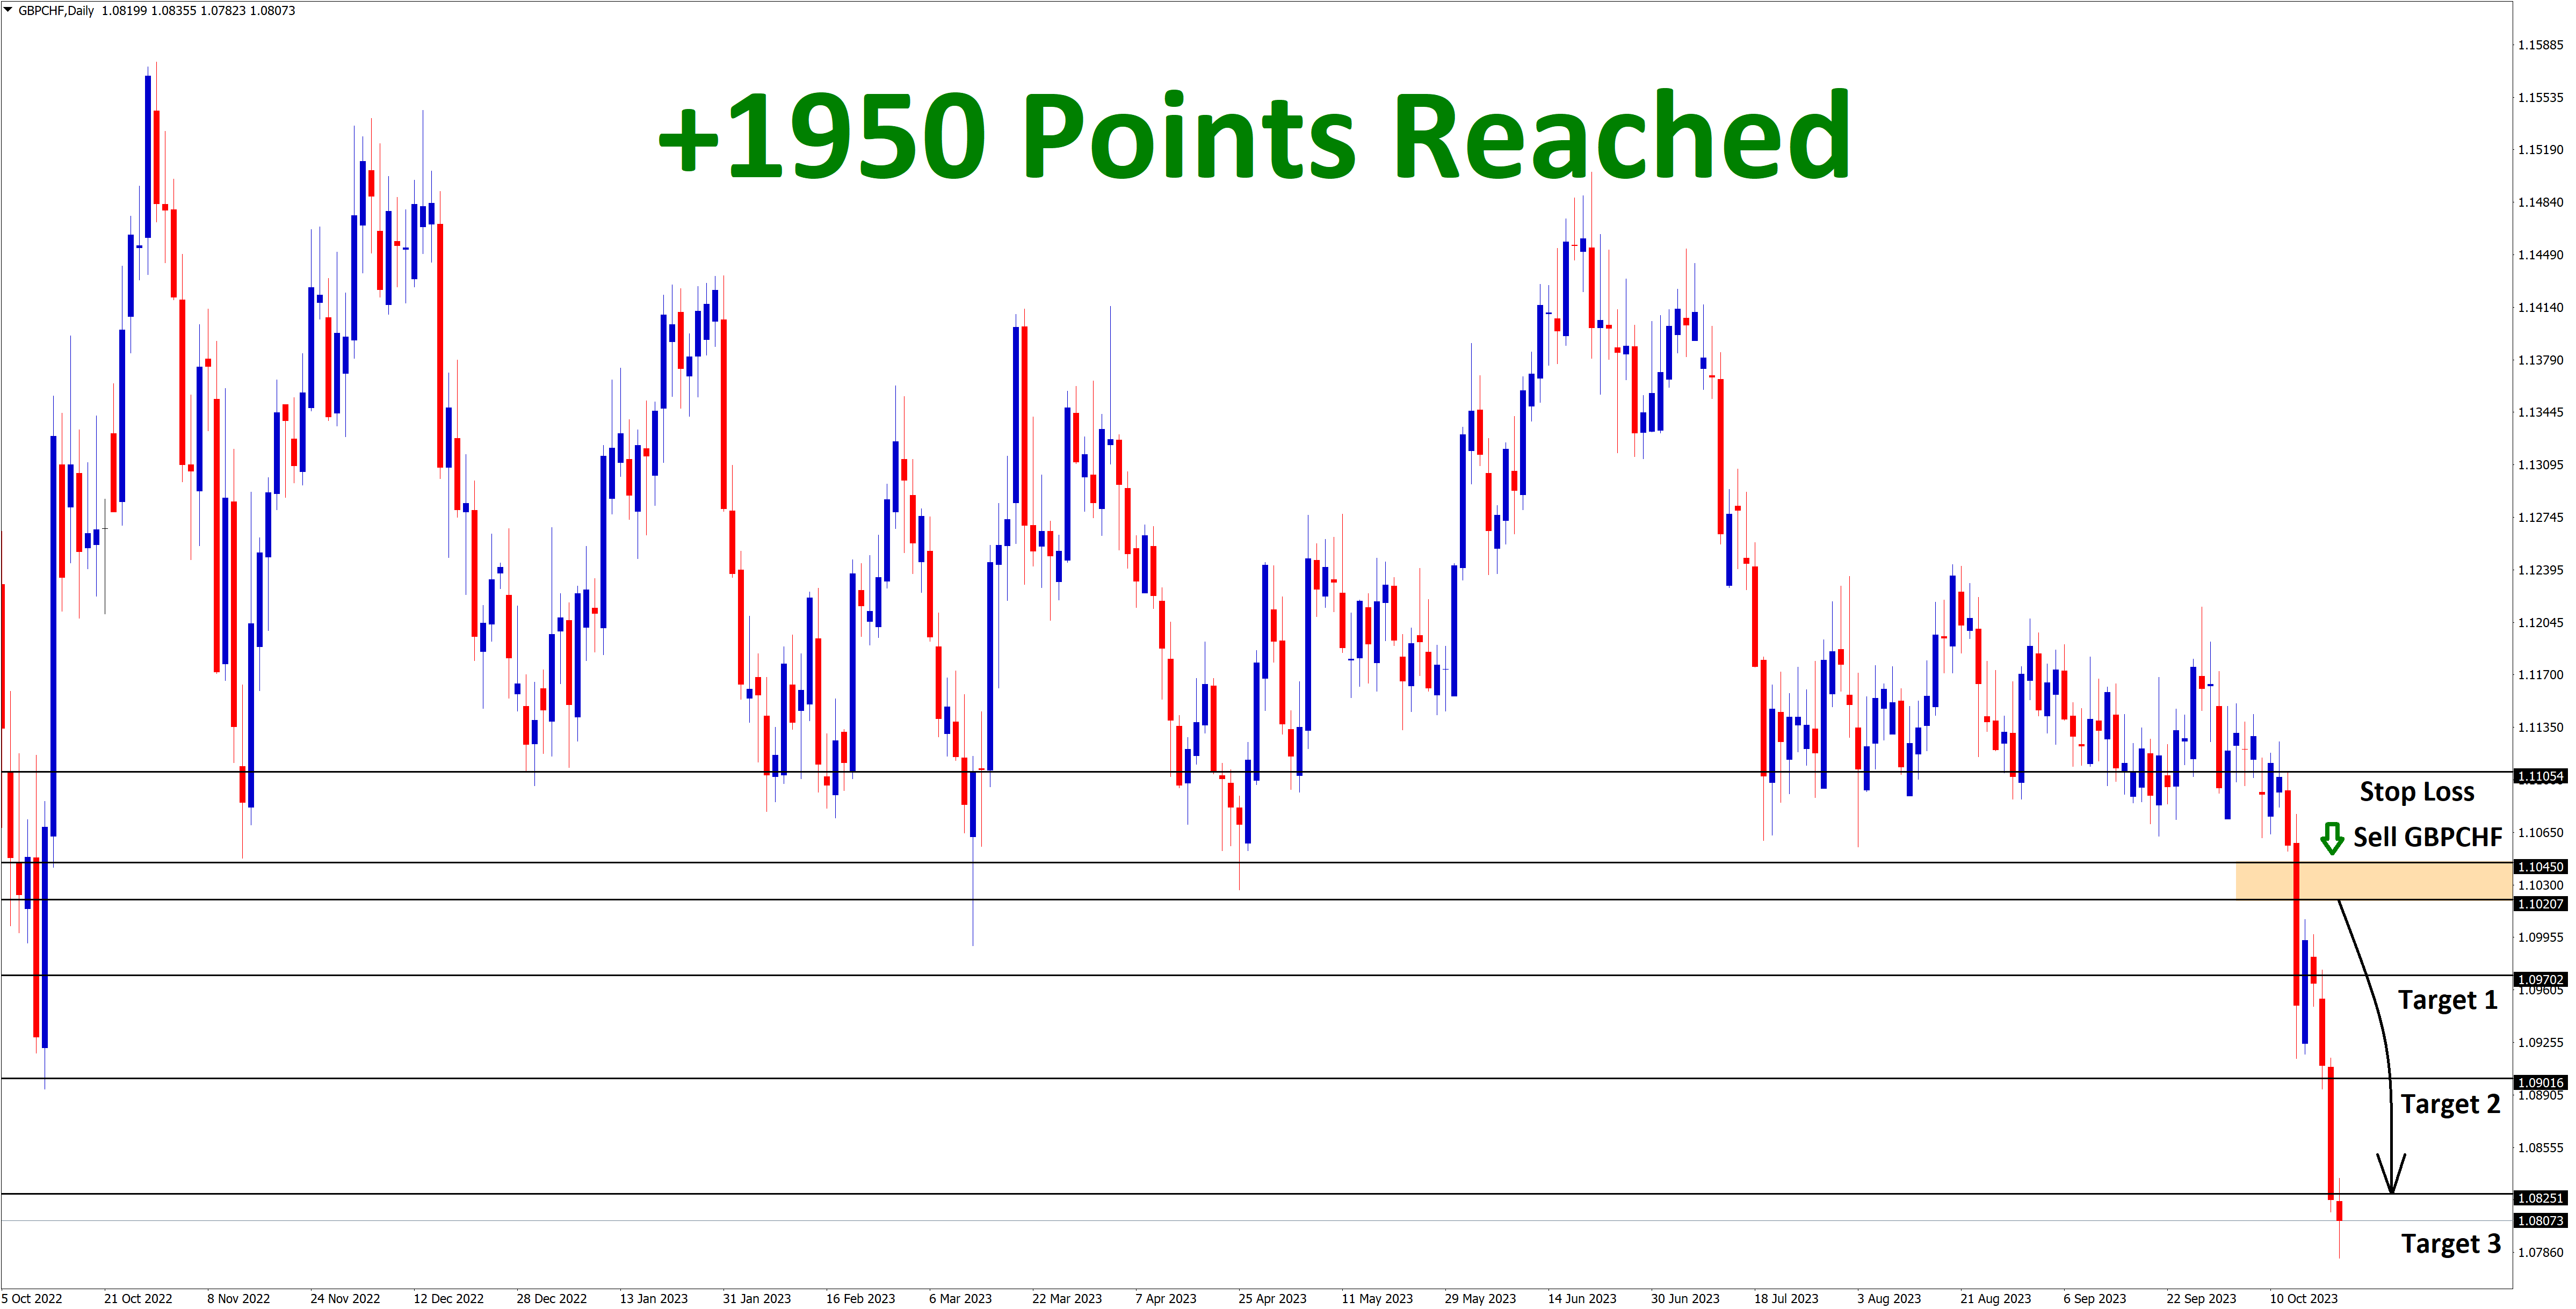
GBPCHF Analysis: After a long time, GBPCHF has broken the horizontal support area in the 4-hour timeframe chart After the…
-
+1180 Points Reached in GBPCHF Buy signal after hitting higher low area of the uptrend line
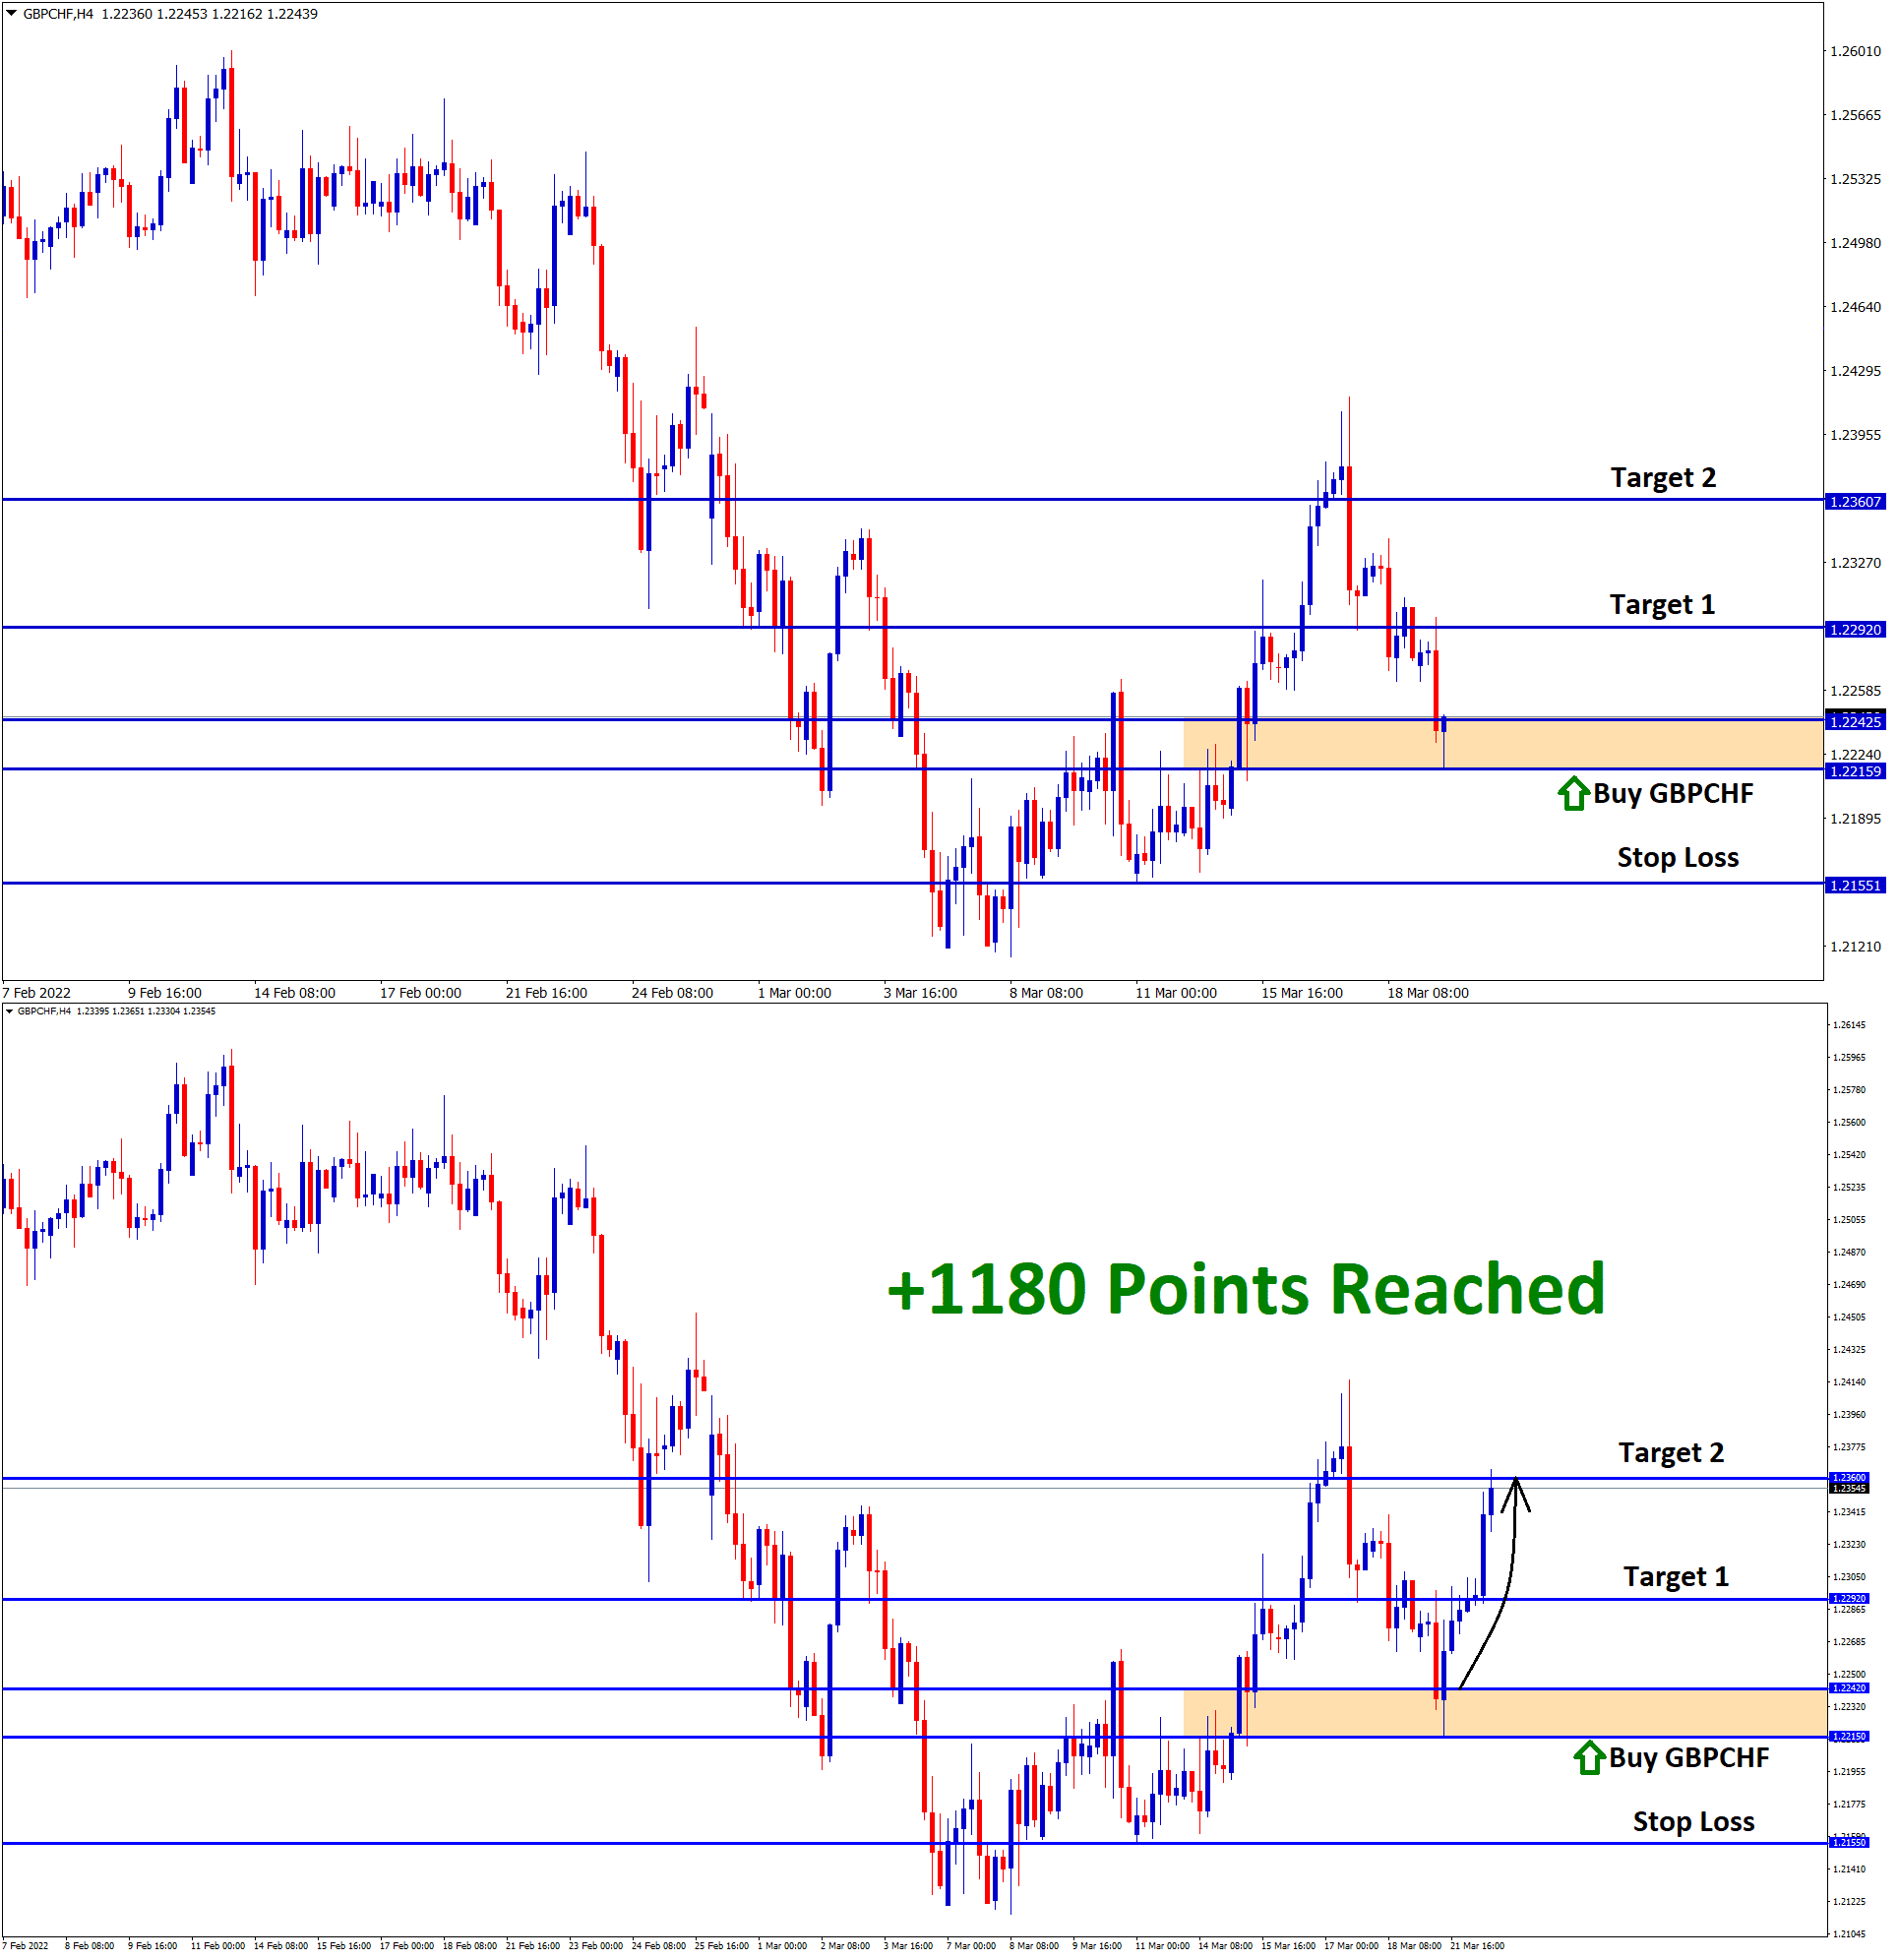
GBPCHF Analysis: GBPCHF hits the higher low area of the uptrend line in the 1-hour timeframe chart. After the confirmation…
-
+3450 Points Profit Reached in GBPCHF buy signal after rebounding from the Strong Support
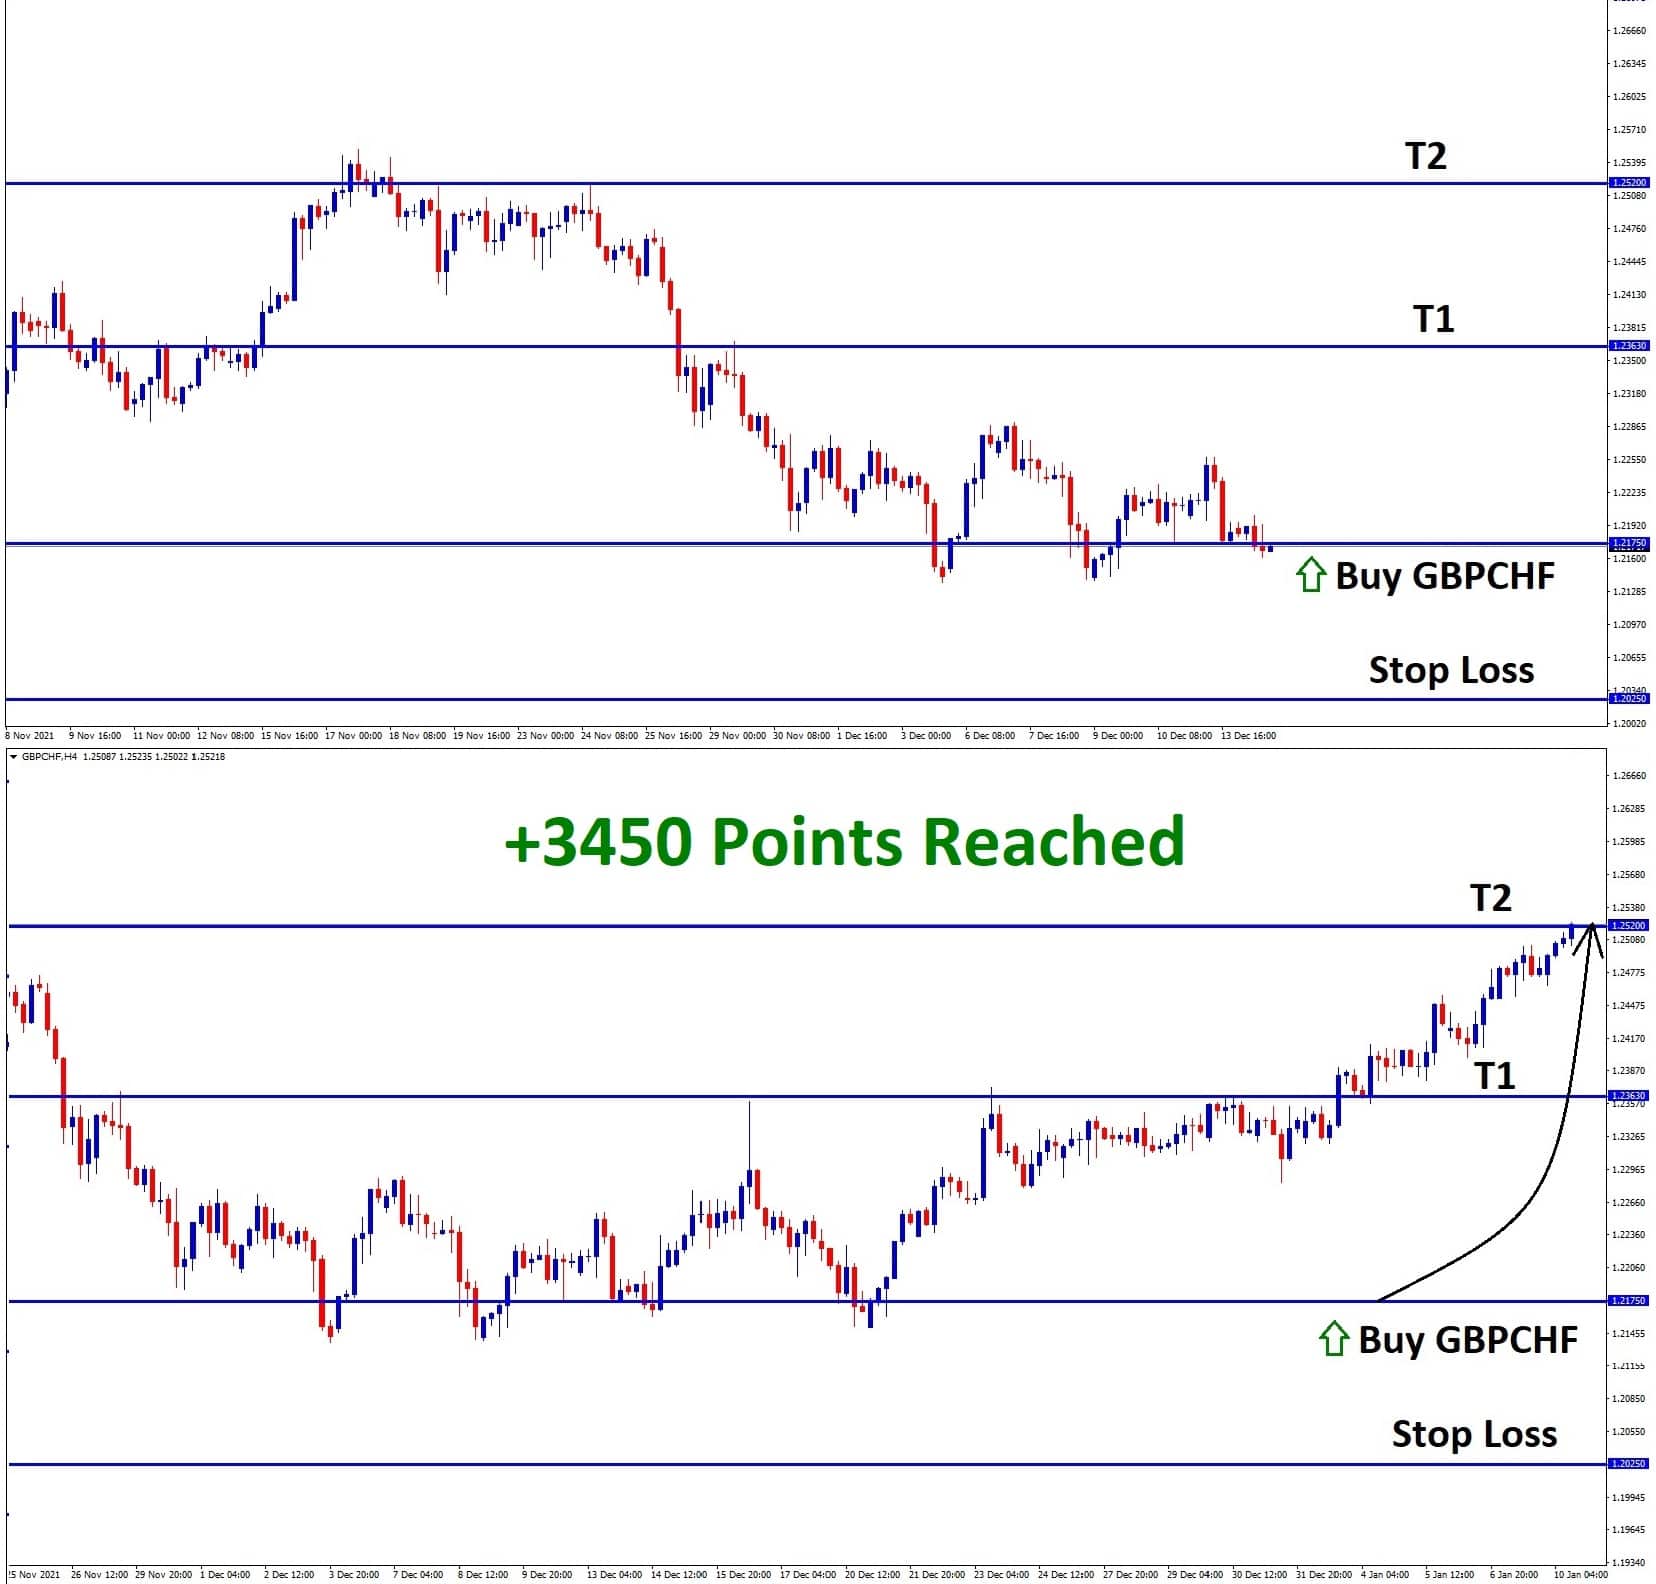
GBPCHF Analysis GBPCHF has reached the major price level where the old resistance turns into new support in the weekly…
-
+1880 Points Profit Reached in GBPCHF buy signal after rebounding from the Strong Support
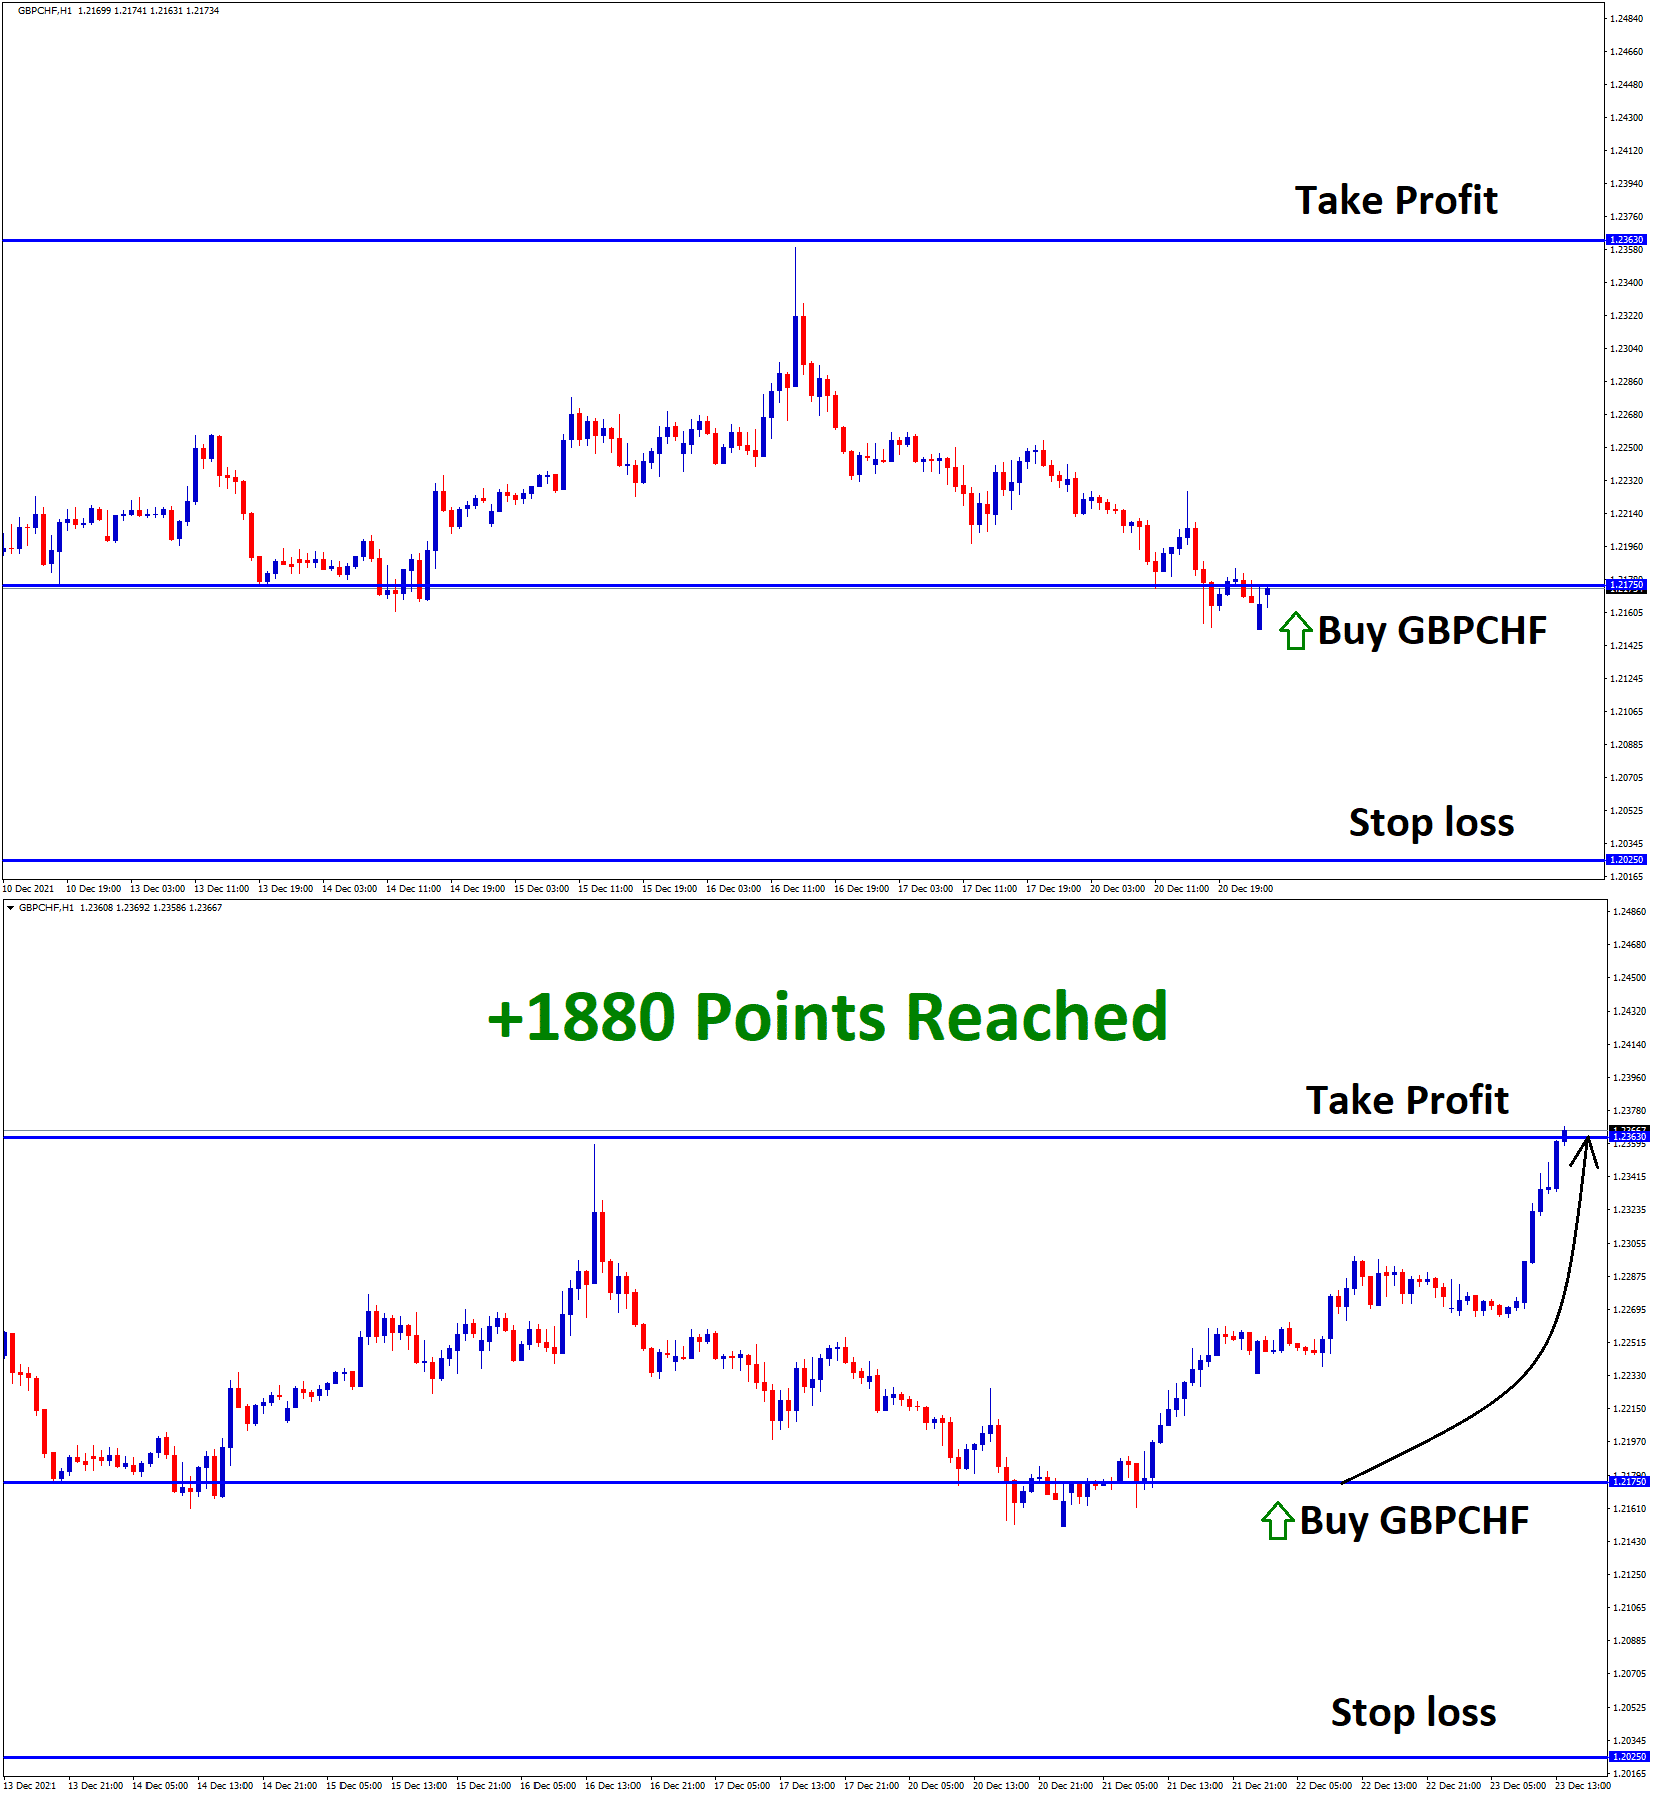
GBPCHF Analysis GBPCHF has reached the major price level where the old resistance turns into new support in the weekly…
-
Continuous Breakouts in GBPCHF shows strong bullish momentum
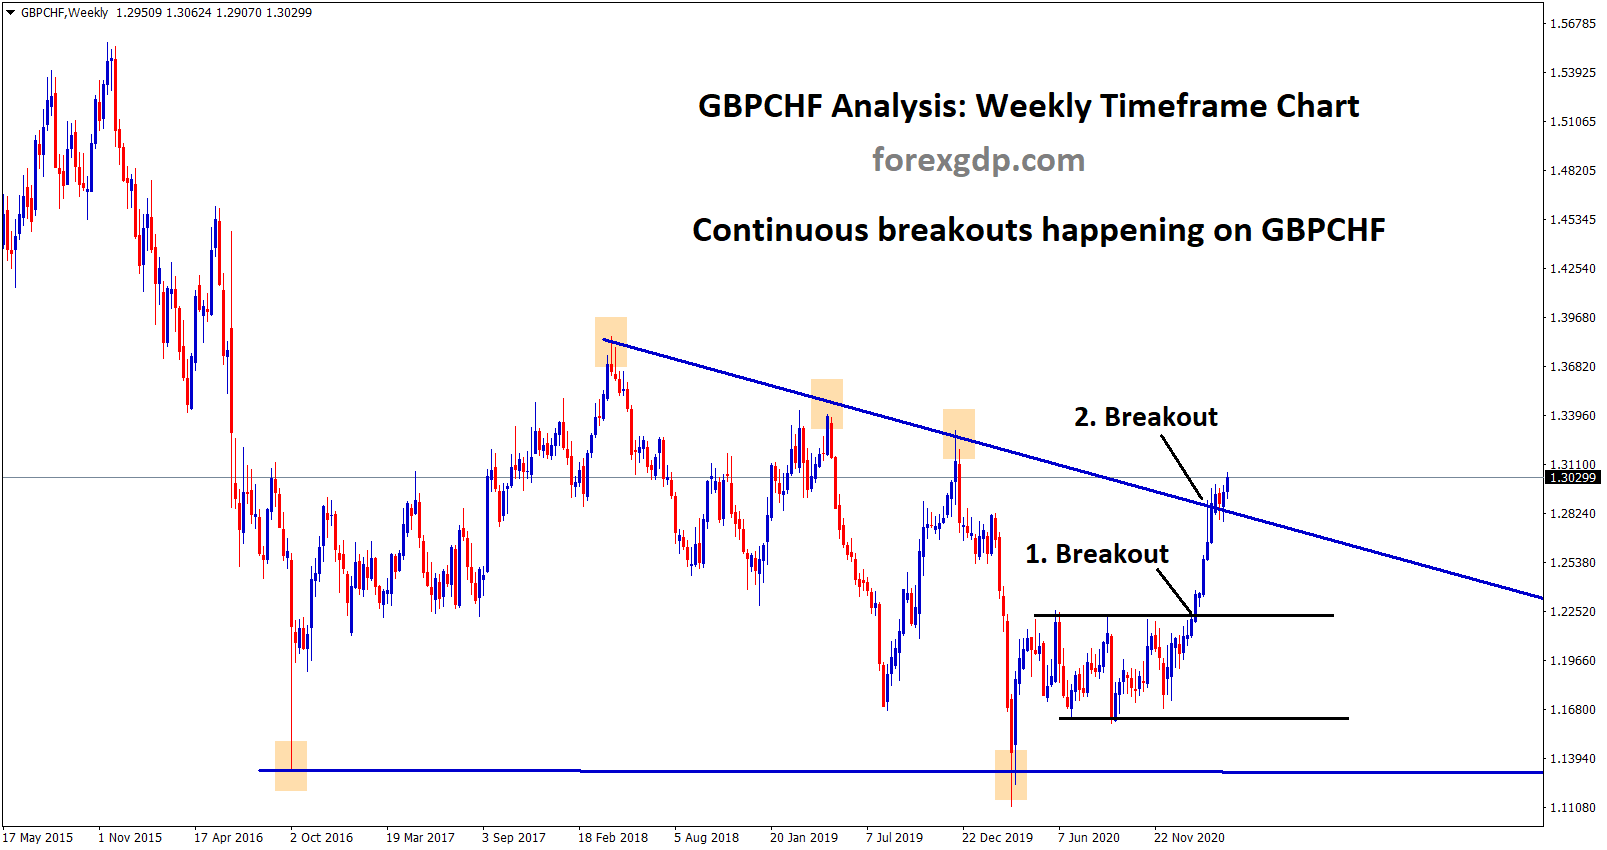
GBPCHF Analysis Continuous breakouts are happening in the GBPCHF market. First, GBPCHF has broken the resistance level of the rectangle…
-
Resistance level reached in GBPCHF. Wait for breakout or reversal.
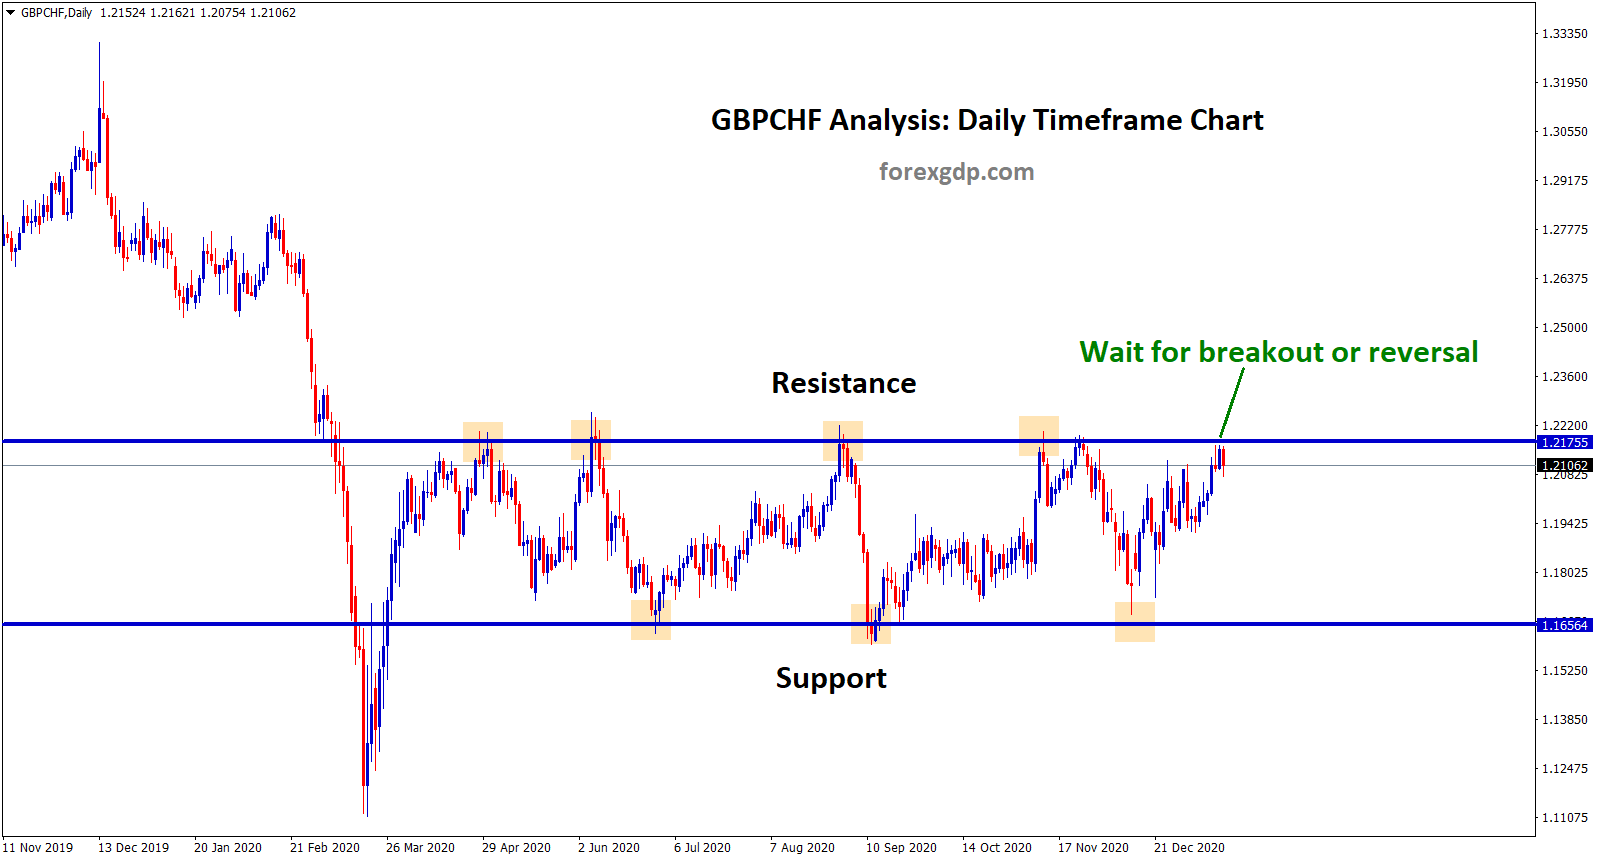
GBPCHF Analysis GBPCHF is moving up and down between the resistance and support level. Now, GBPCHF is standing at the…
-
Ascending Triangle Pattern in GBPCHF
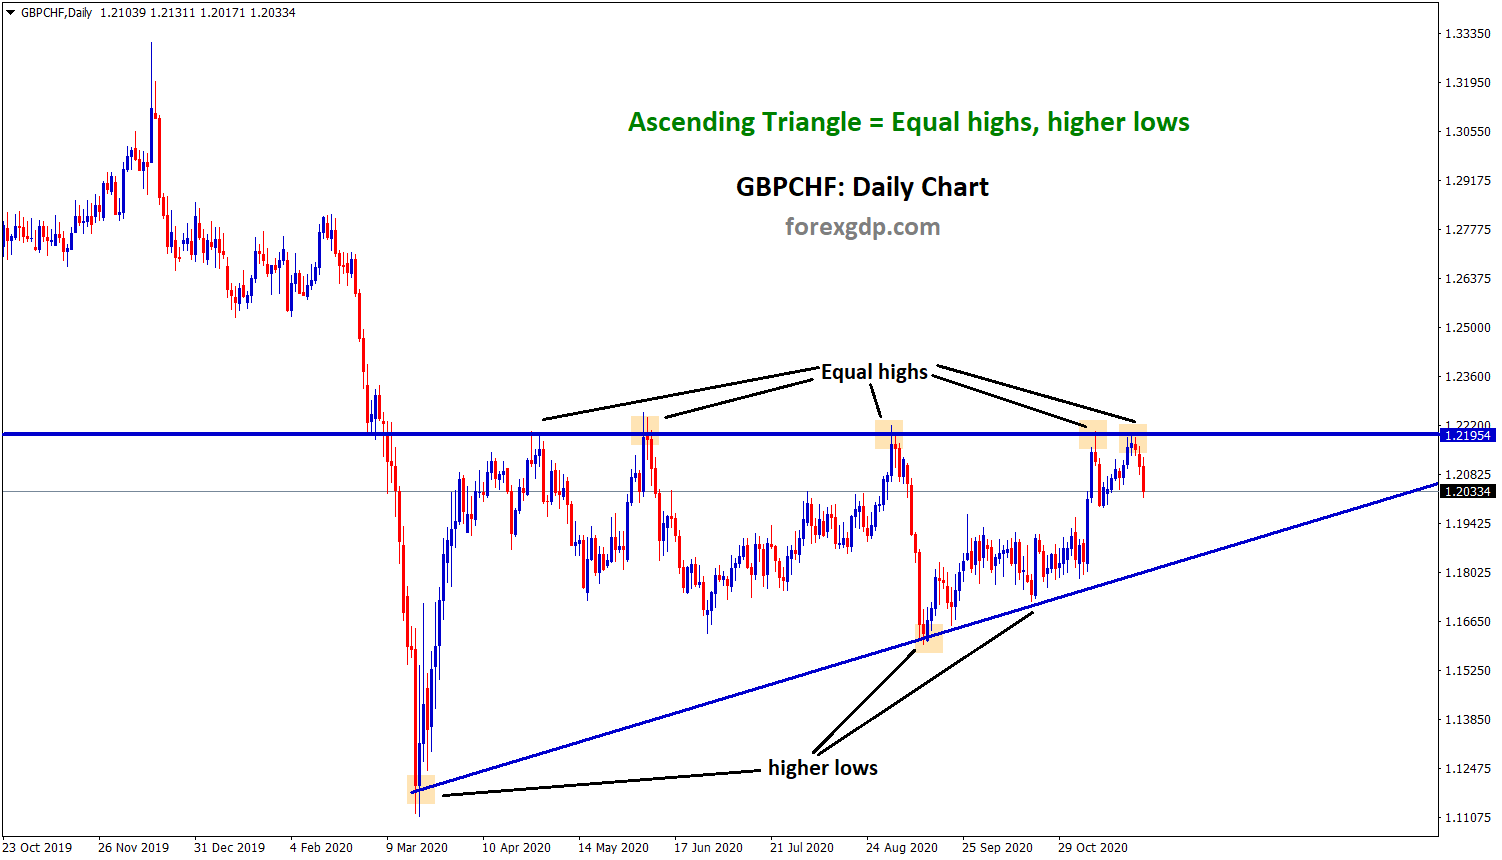
GBPCHF Triangle Analysis GBPCHF has reached the top resistance zone again for the 5th time and now it starts to…
-
GBPCHF is still moving in a Descending Triangle Pattern
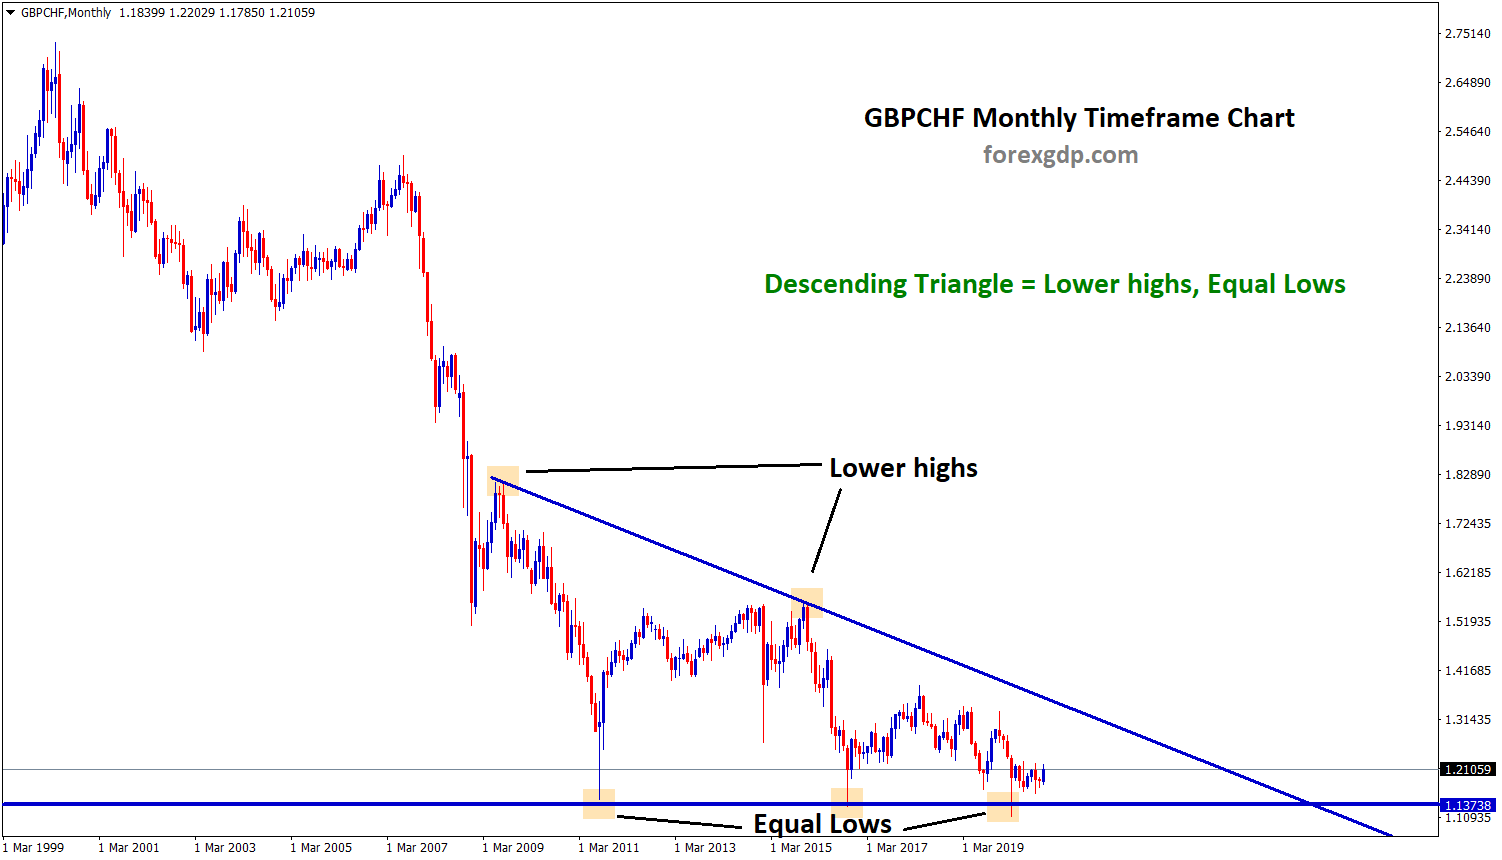
GBPCHF Descending Triangle Analysis GBPCHF has formed a descending triangle pattern by creating lower highs and equal lows in the…
-
GBP Currency pairs at the key price levels

GBPJPY Uptrend Analysis GBPJPY is moving in an Uptrend by forming higher highs, higher lows in 4-hour time frame chart.…
-
+728 Points reached in GBPCHF Buy signal
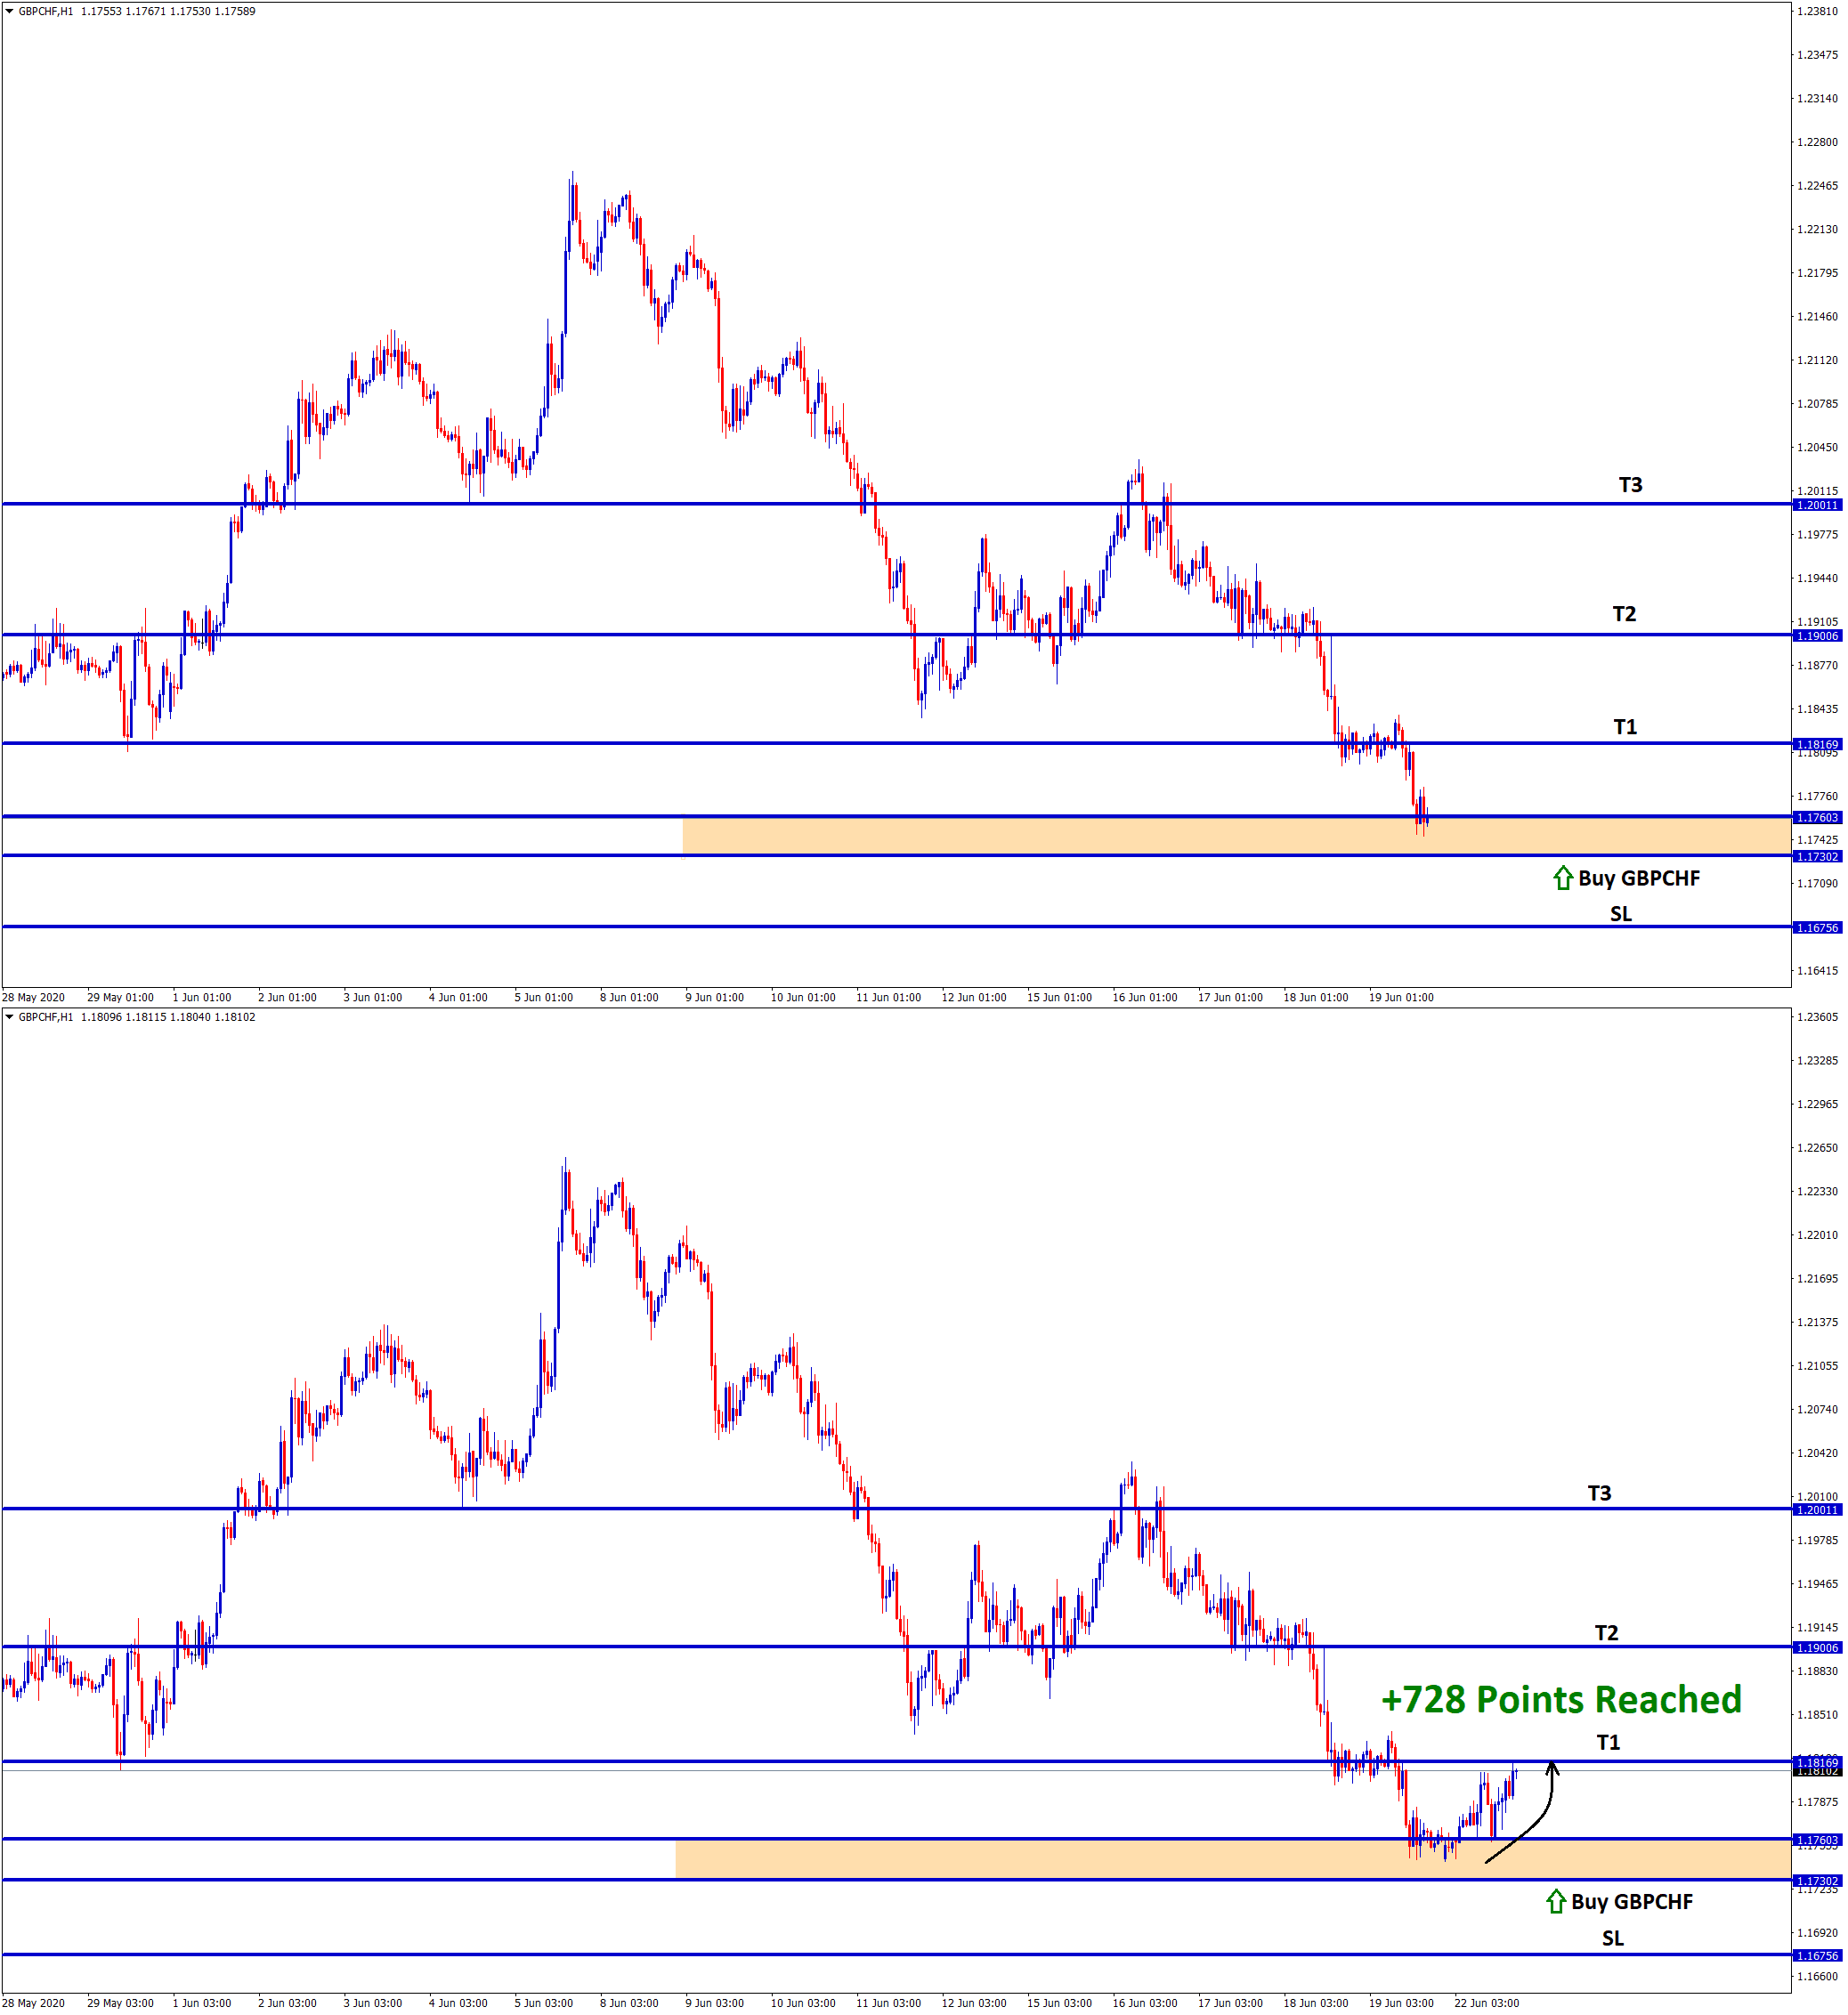
GBPCHF Buy signal at the support level GBPCHF is moving up and down between the resistance and support level. In…
-
GBPCHF Landed at the support exactly after 1 month
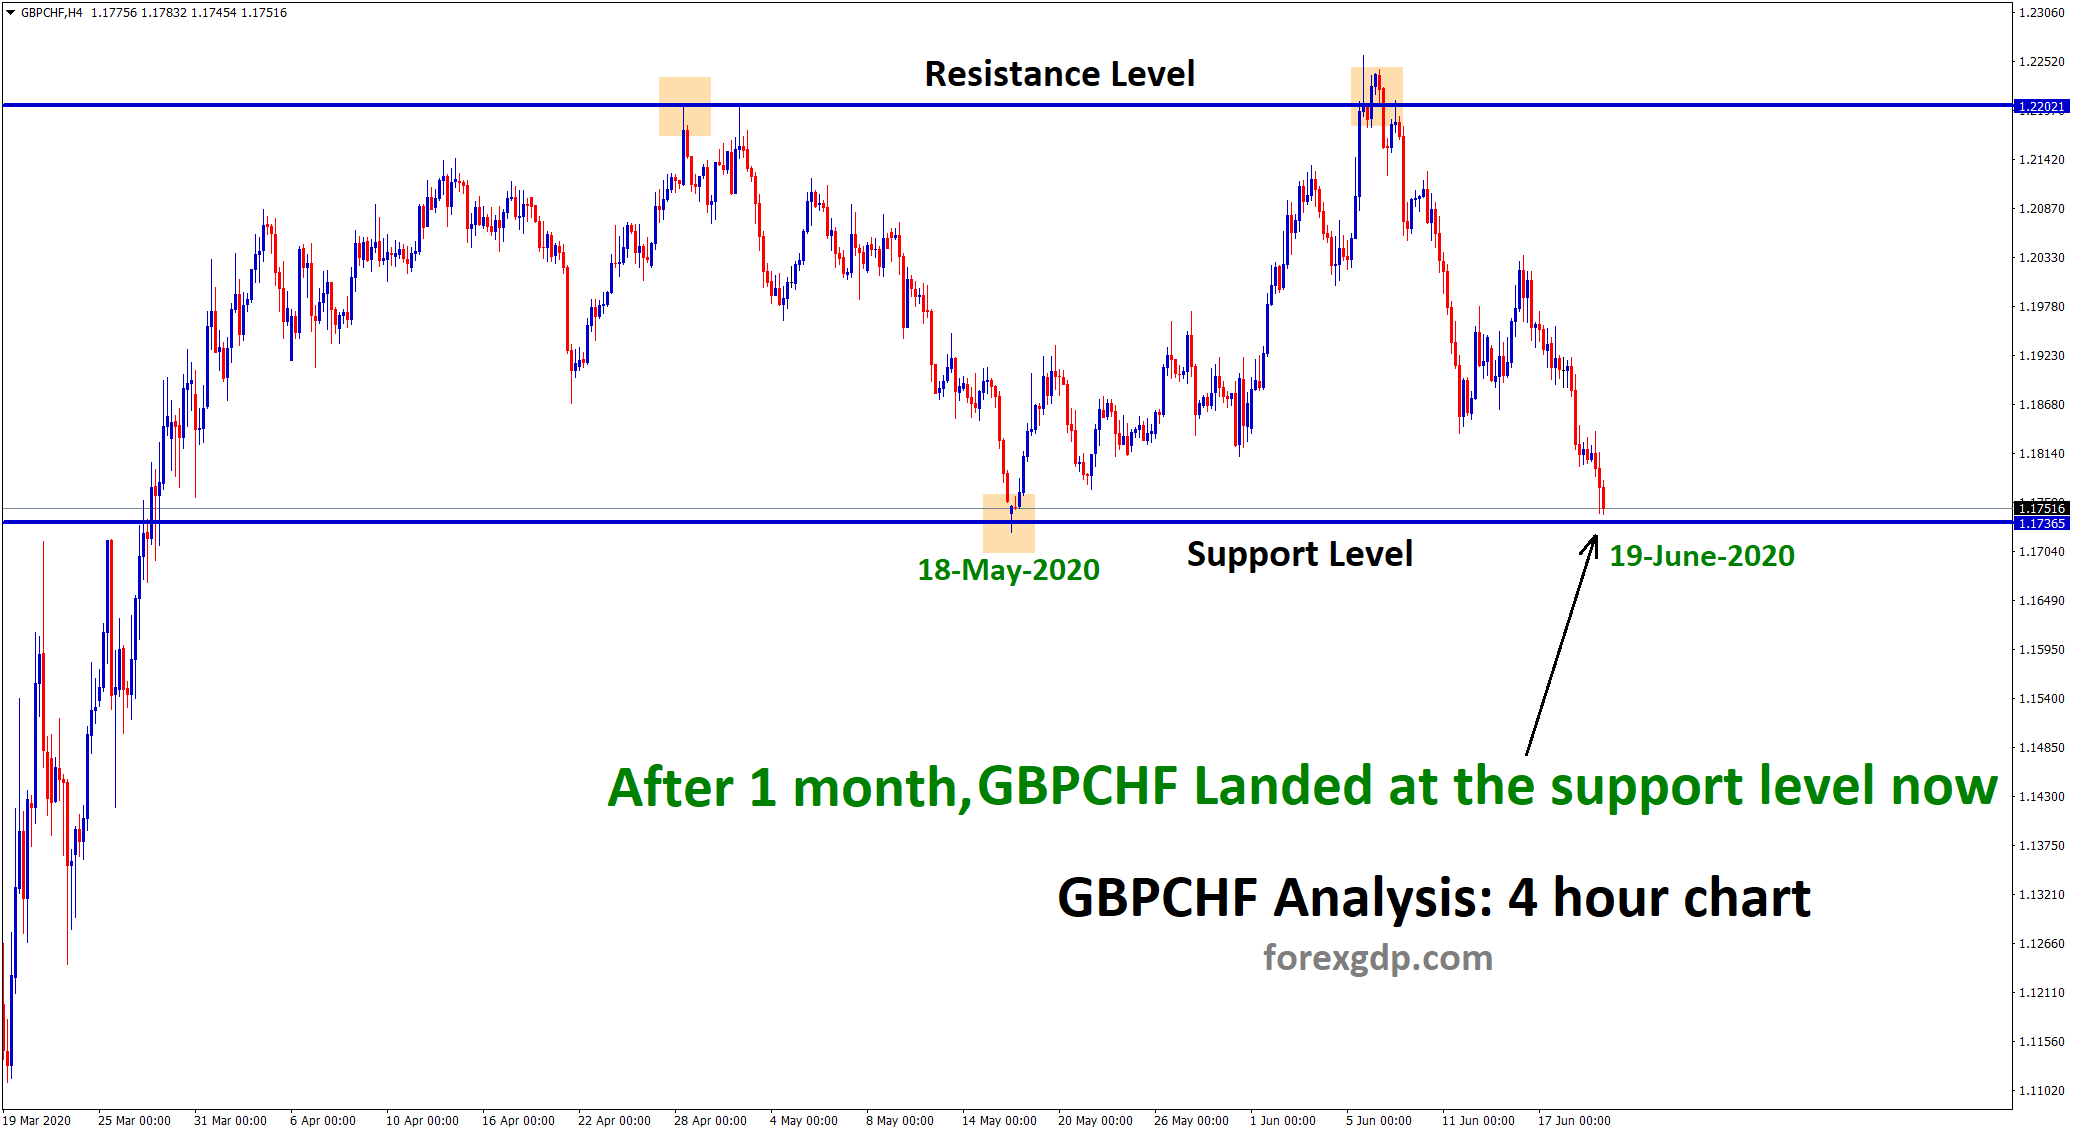
GBPCHF Technical Analysis GBPCHF is moving up and down between the resistance and support level. In previous month 18-May-2020, GBPCHF…
-
GBP/CHF reaches the bottom level, wait for Breakout (or) Reversal ?
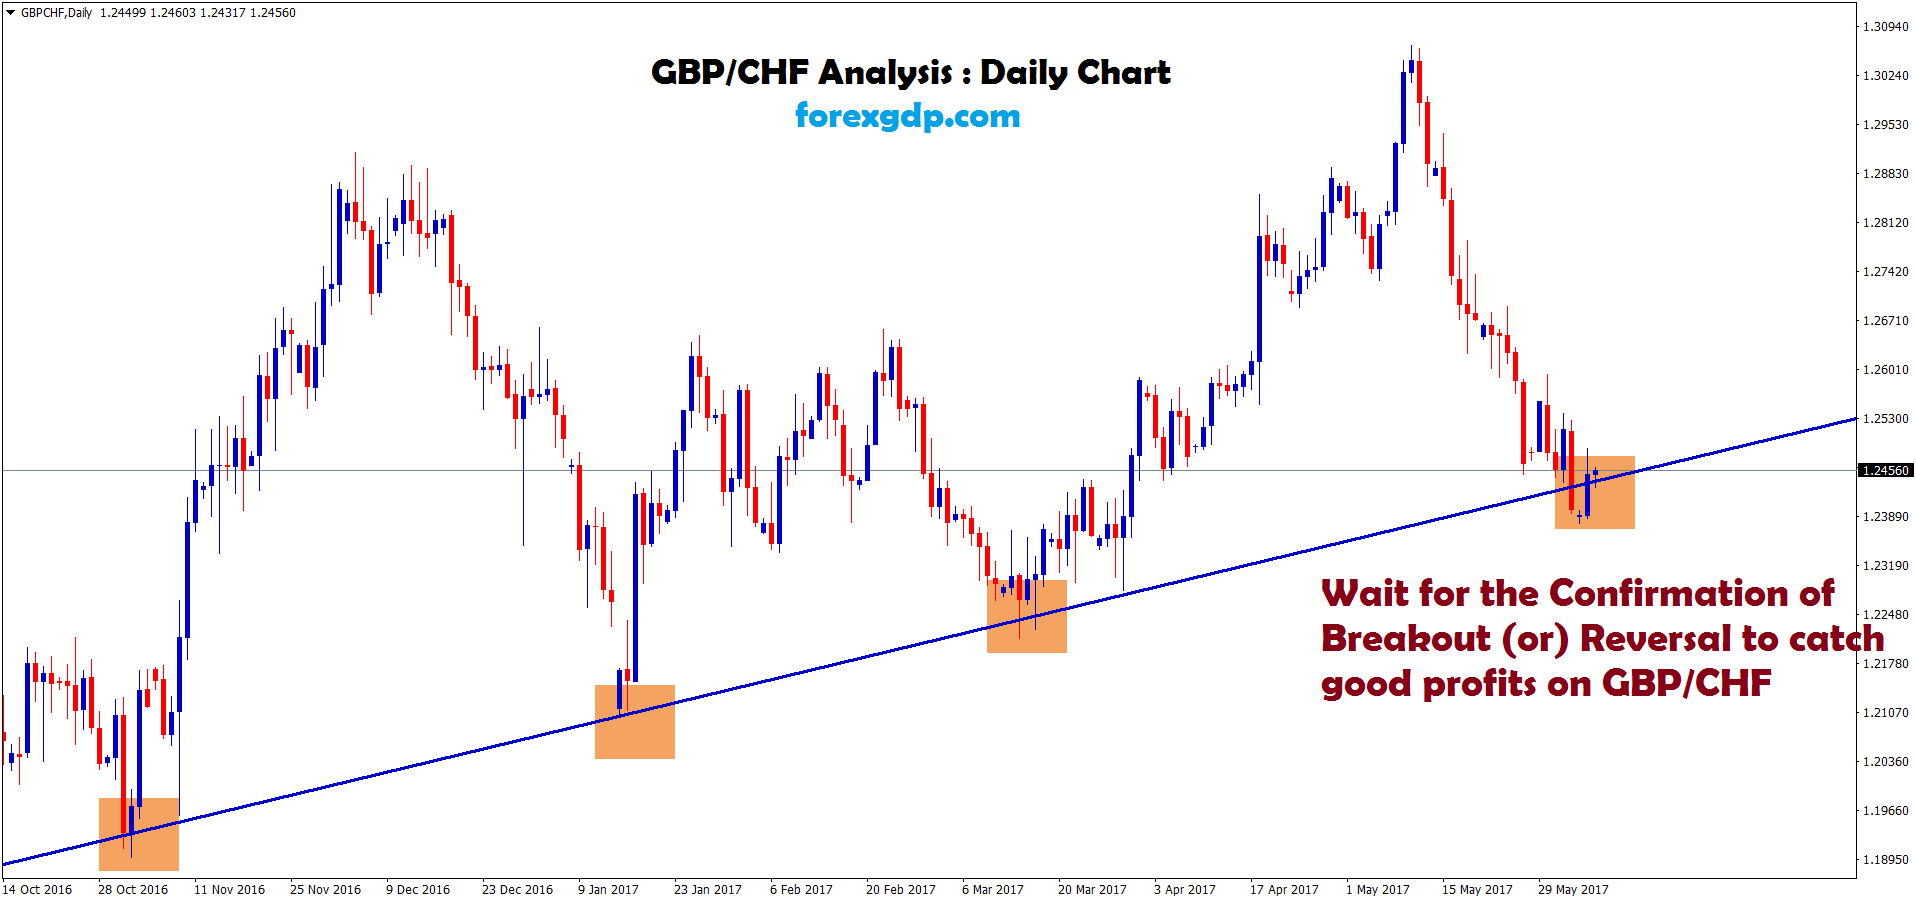
GBP/CHF Analysis : GBP/CHF is moving in an uptrend by forming Higher Highs and Higher Lows. Market Reaches the bottom…