Short Term Trade Analysis
Short Term Trade Analysis on all Forex Currency pairs, Commodities, Metals, CFD’s, stocks and shares. Short term trade analysis like scalping, intraday forex signals are given at best trade setup. Check latest short term analysis setups now. Click here to join Free.
-
CAD/JPY reached the top level of the range, wait for breakout or reversal ?
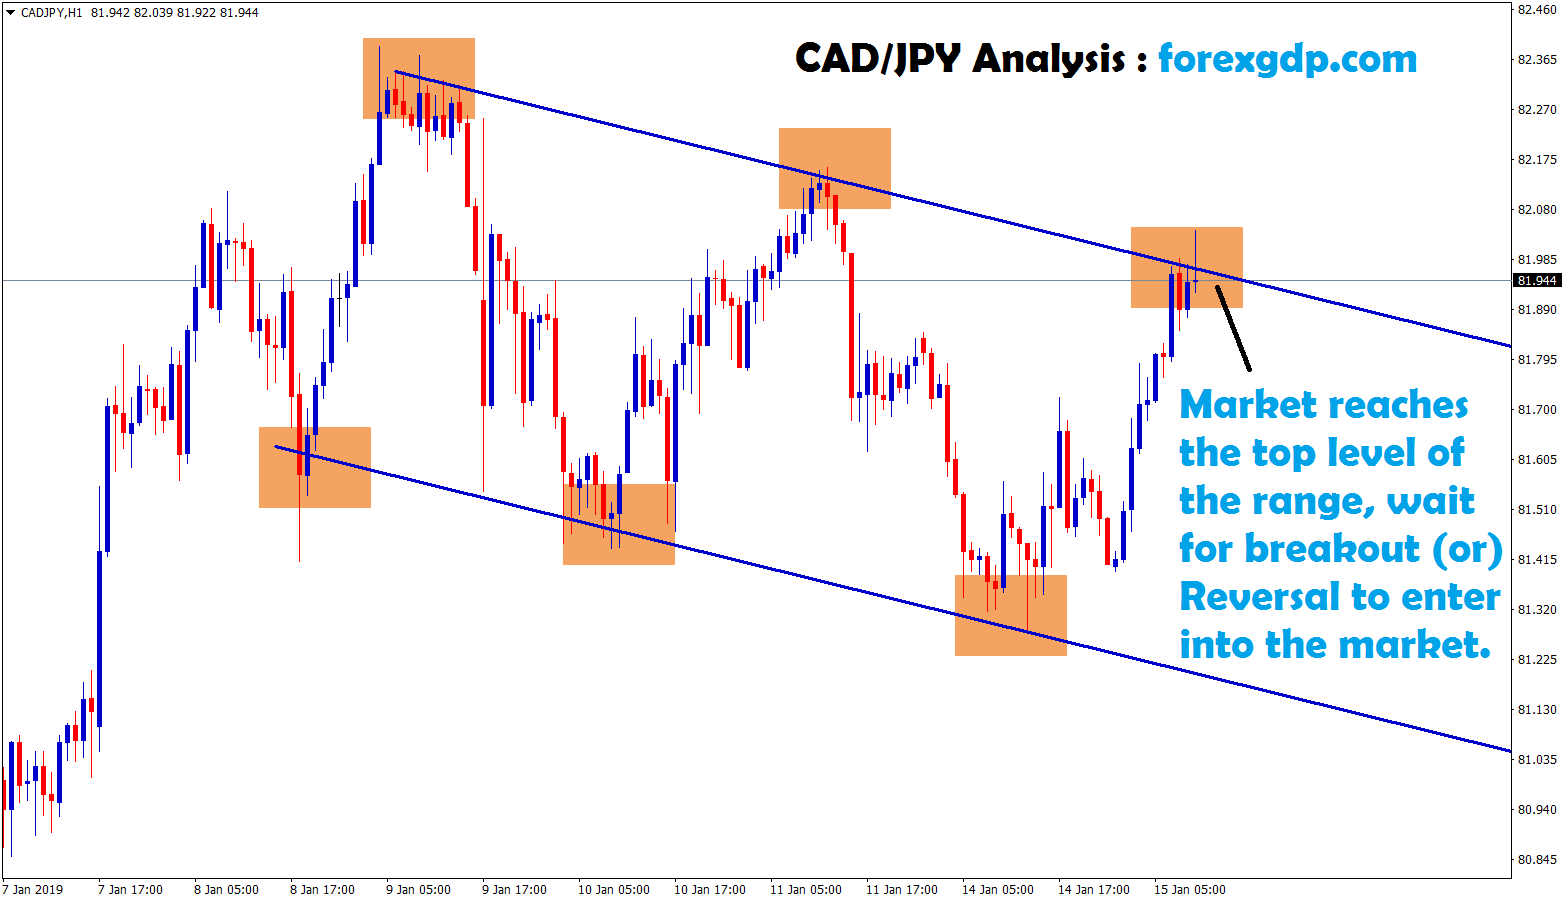
CAD/JPY Analysis (For Education Purpose): CAD/JPY is moving up and down between the ranges in H1 Chart. Now, market reaches…
-
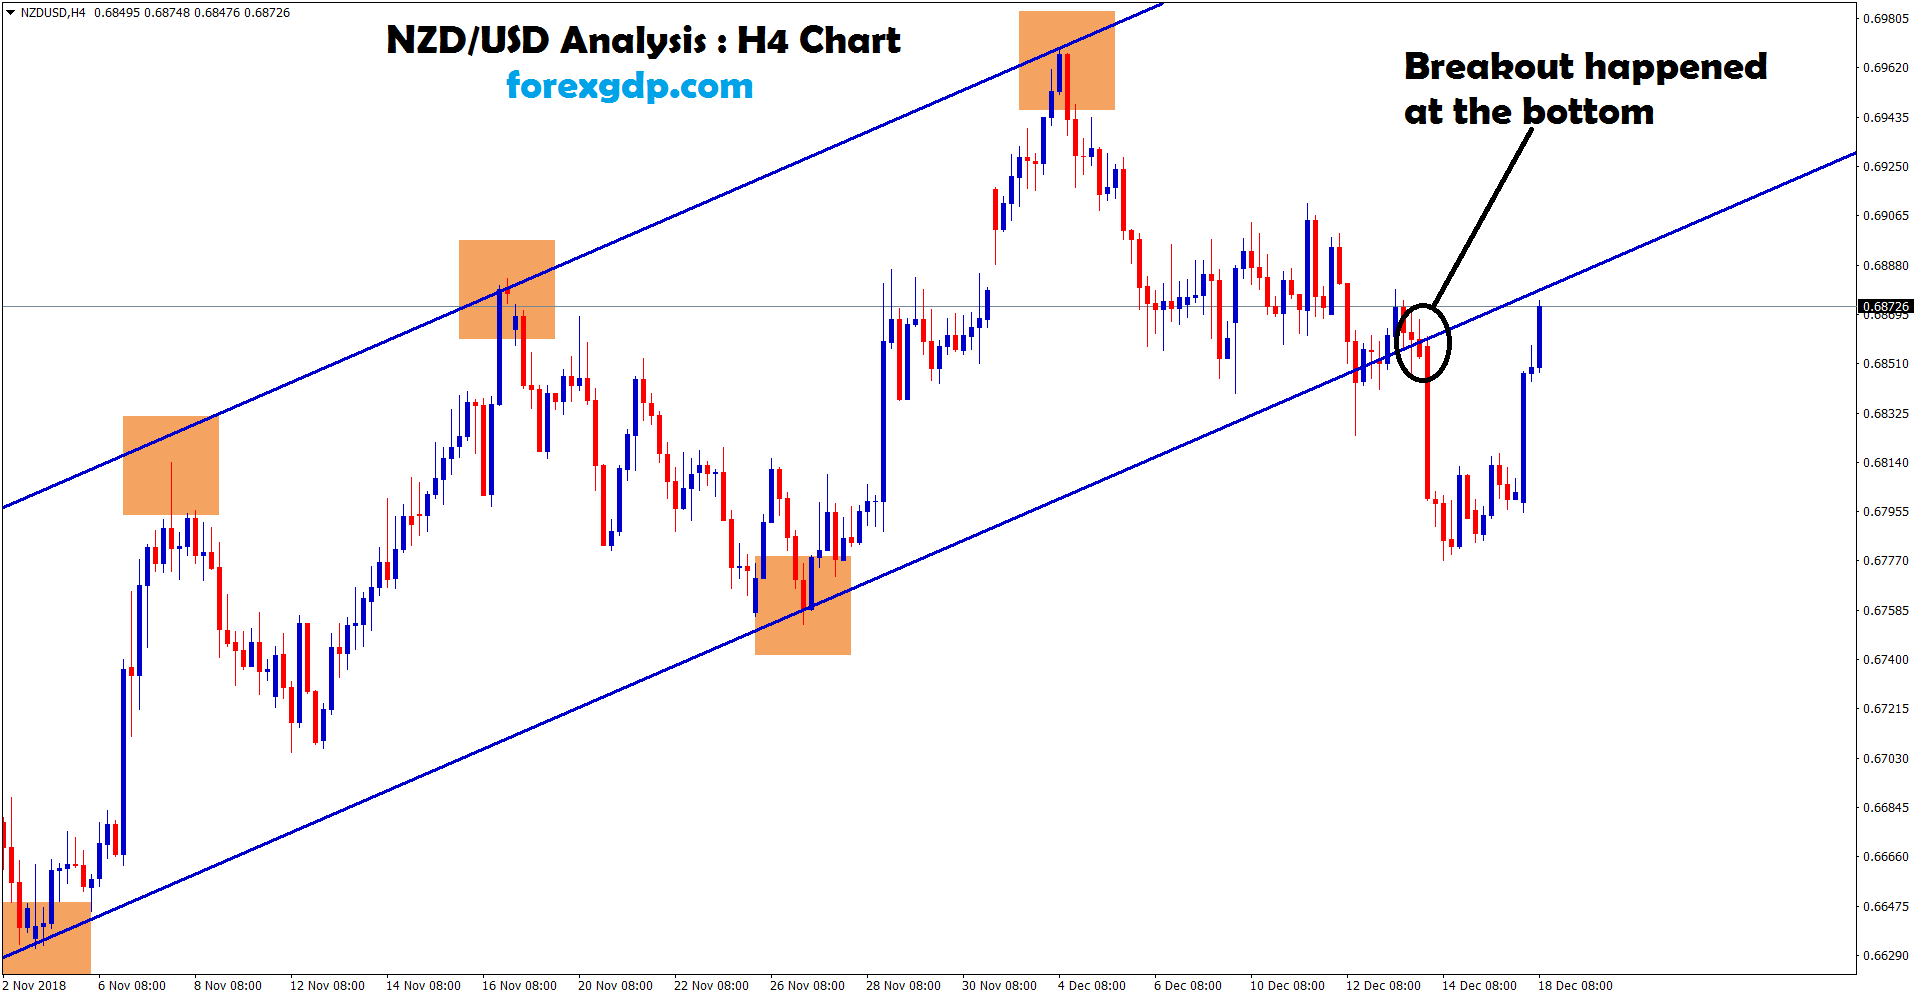
+637 Points Reached in NZD/USD Buy Signal
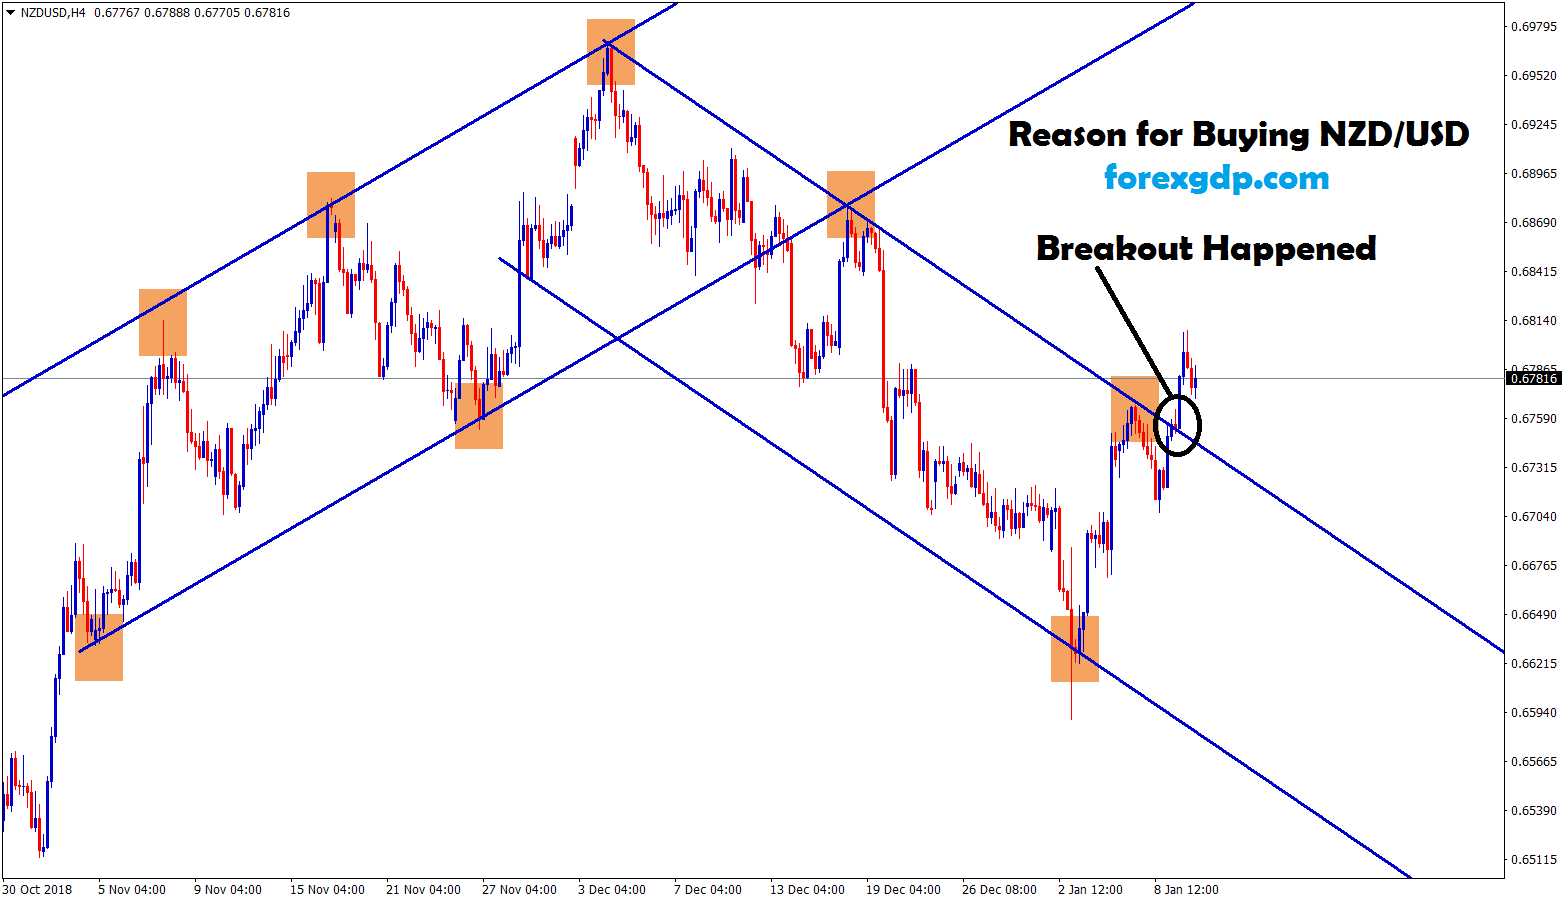
Reason for Buying NZD/USD : NZD/USD broken the top level of the range in H4 Chart. After the confirmation of…
-
+819 Points Reached in CAD/CHF Buy Signal
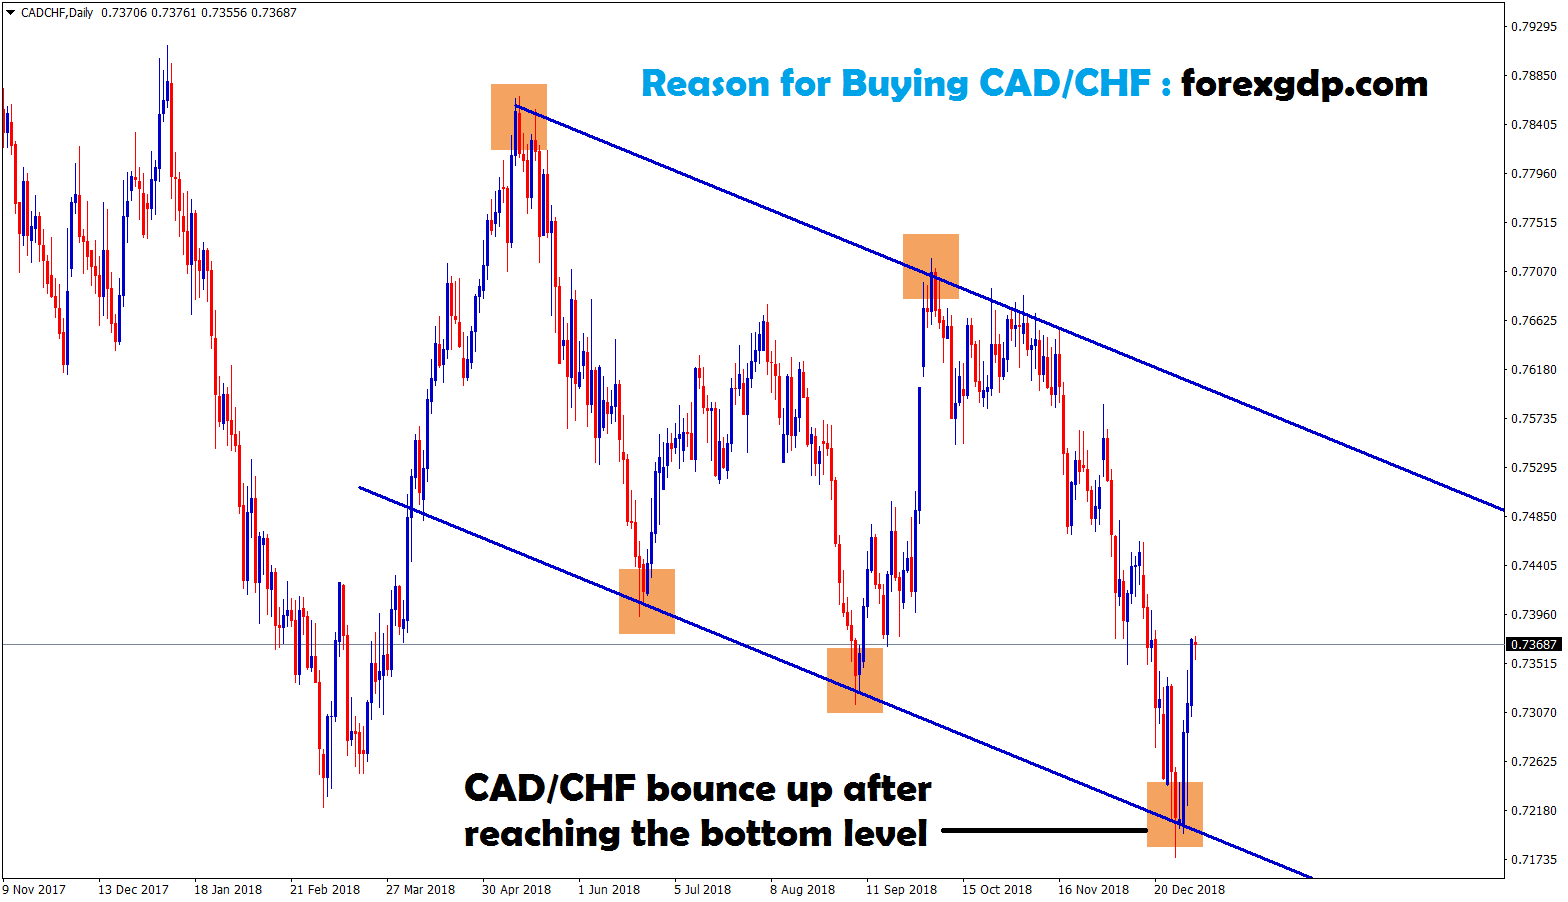
Reason for Buying CAD/CHF : 1. CAD/CHF bounce up after reaching the strong bottom level 0.72 in Daily Chart. 2.…
-
+758 Points Reached in EUR/USD Buy Signal
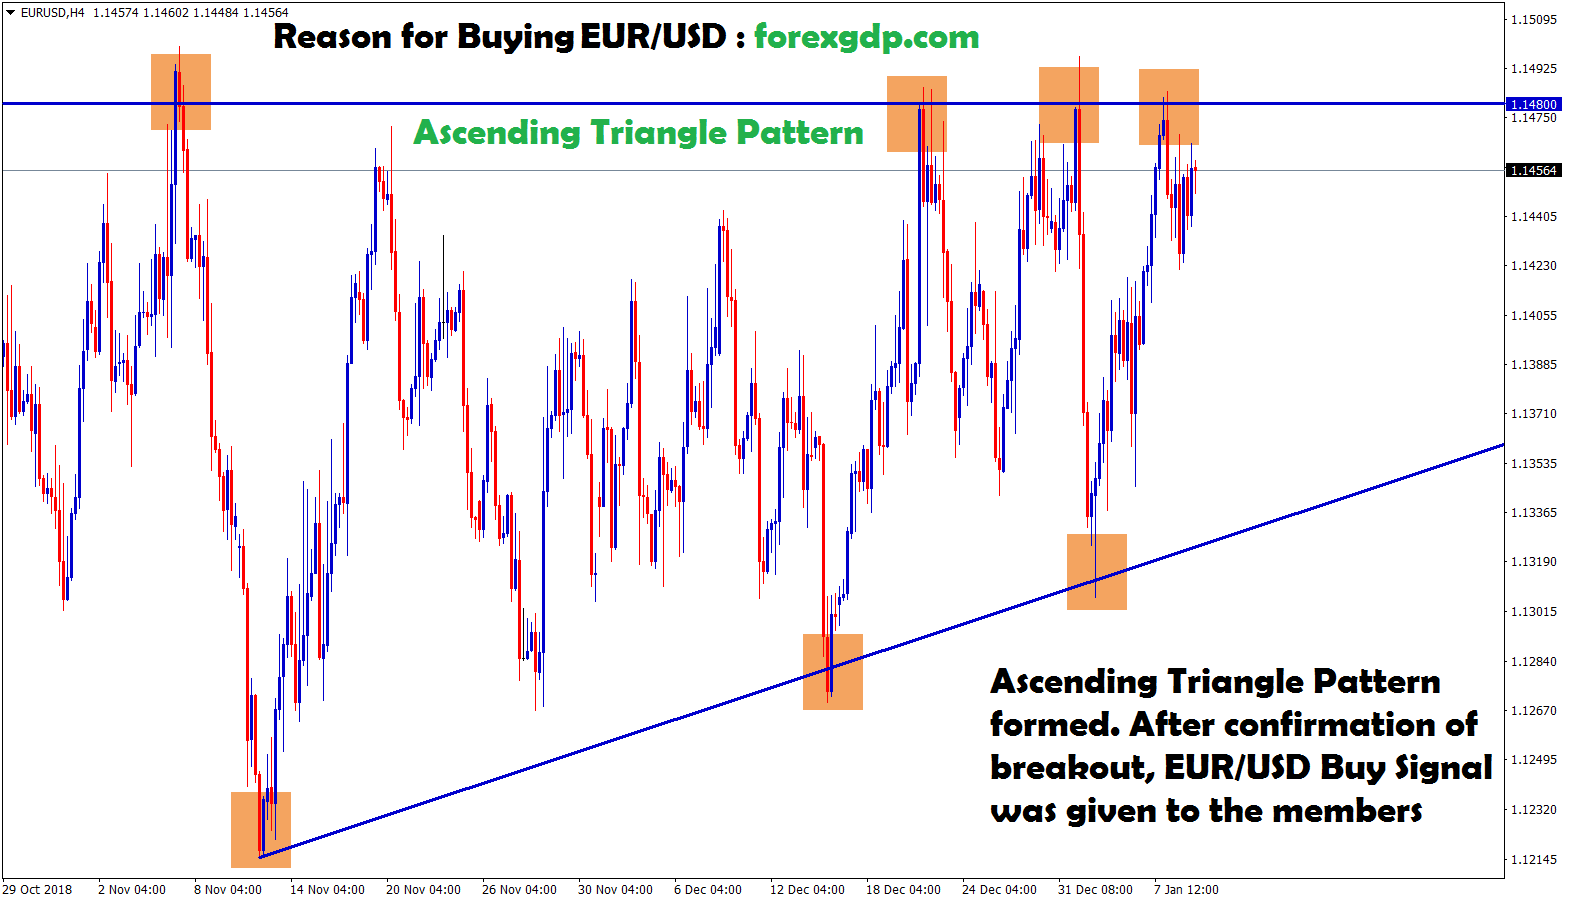
Reason for Buying EUR/USD : 1. EUR/USD has formed Ascending Triangle Pattern in H4 Chart. 2. As per our technical…
-
+800 Points Reached in USD/CHF Sell Signal
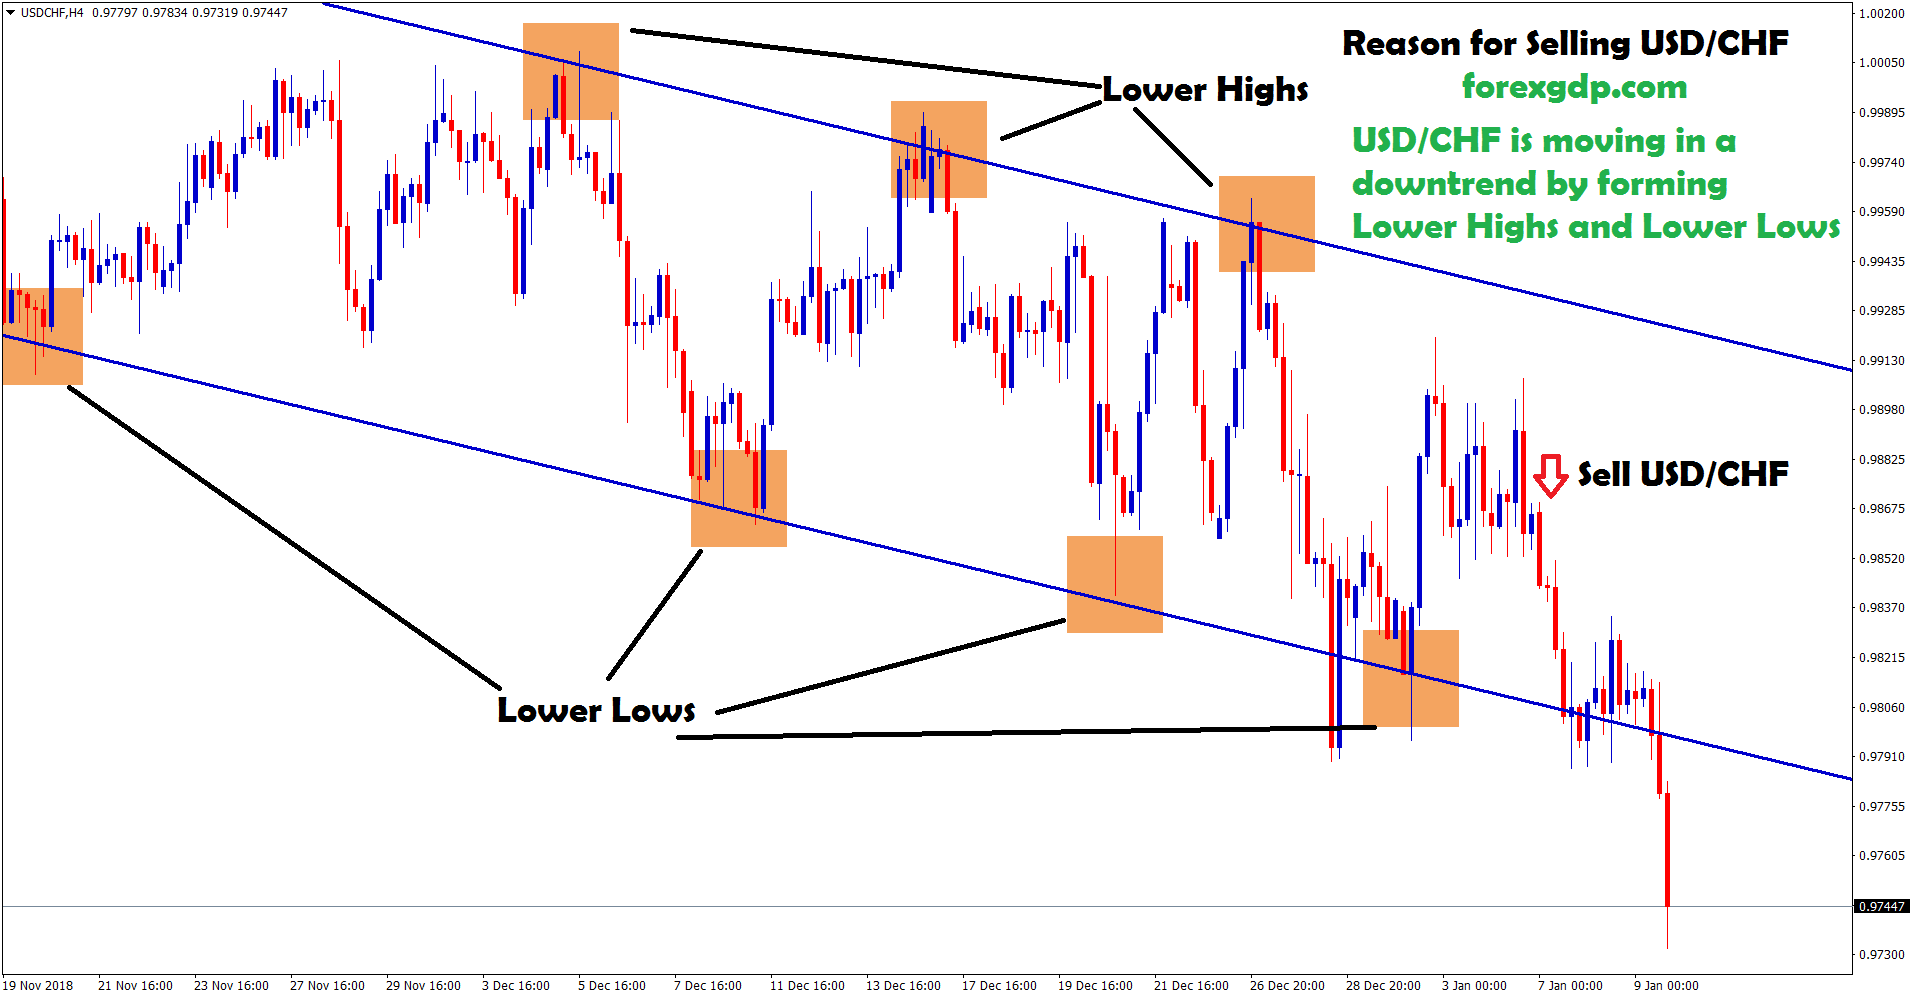
Reason for Selling USD/CHF : USD/CHF moving in a downtrend by forming Lower Highs and Lower Lows in H4 Chart.…
-
+614 Points Reached in EUR/GBP Sell Signal
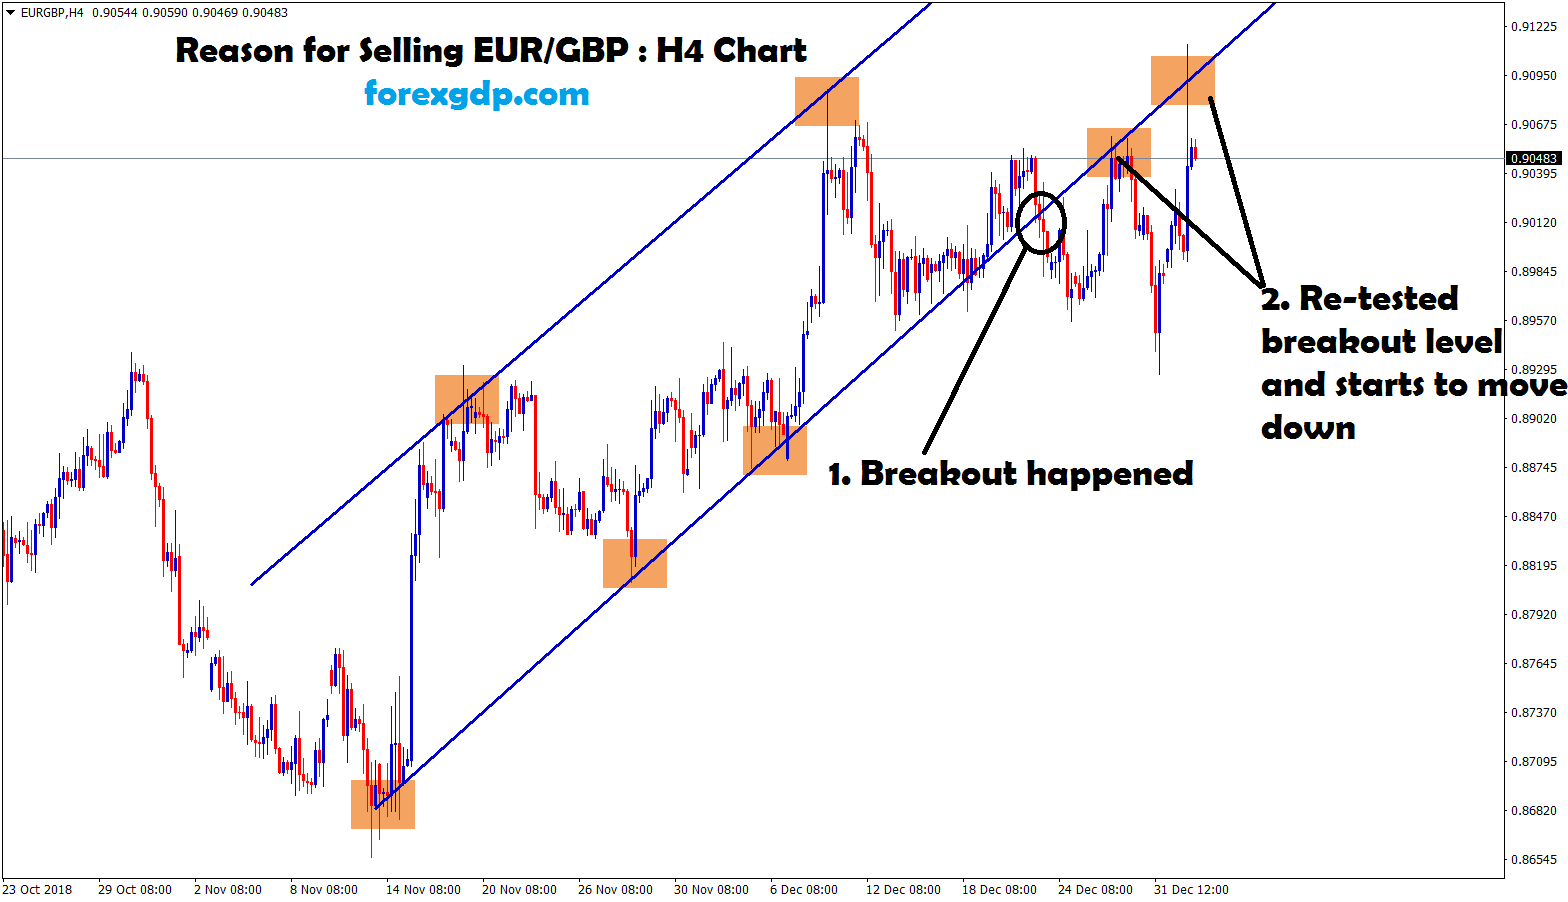
Reason for Selling EUR/GBP : 1. EUR/GBP is moving in between the ranges in H4 Chart. 2. After breakout happened…
-
+652 Points Reached in NZD/USD Sell Signal
Reason for Selling NZD/USD : NZD/USD is moving between the ranges in H4 Chart. Market broken the bottom level of…
-
Gold is moving in an Uptrend by forming Higher Highs and Higher Lows
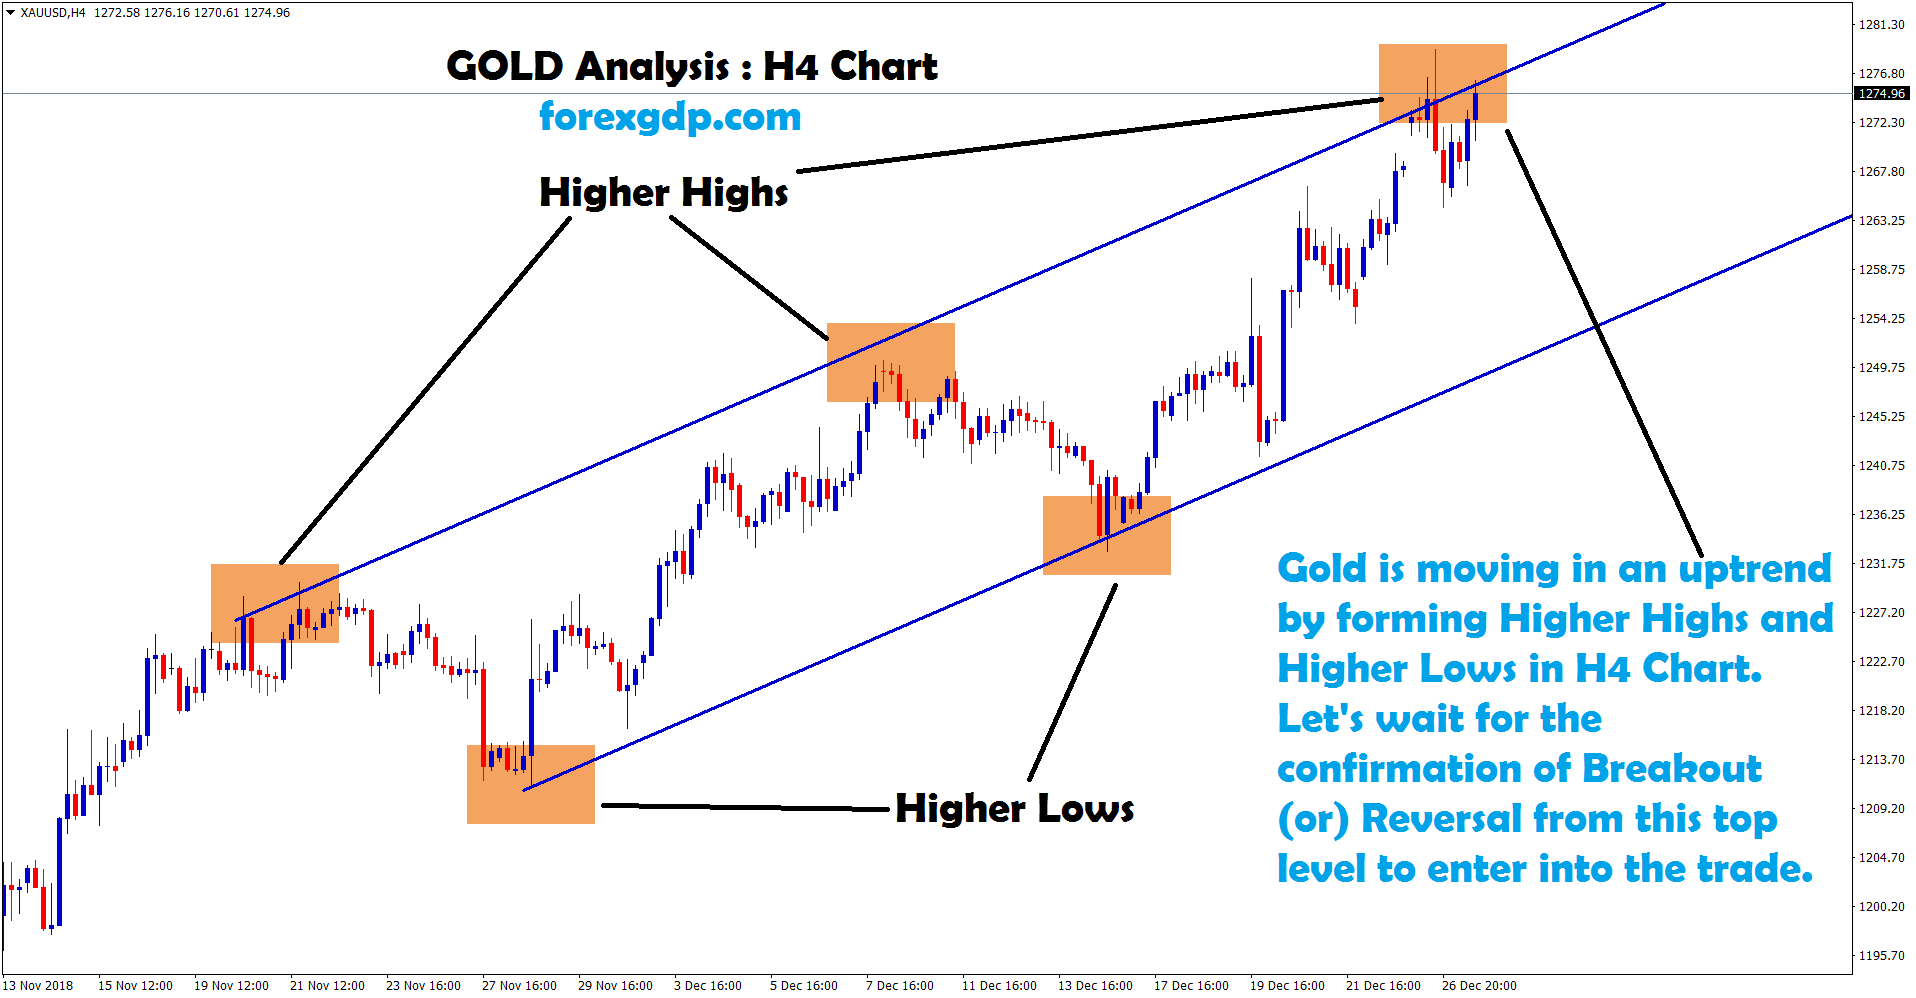
Gold Analysis : (For Education Purpose) Gold is moving in an uptrend by forming Higher Highs and Higher Lows in…
-
-710 Points Reached in AUD/CHF Sell Signal
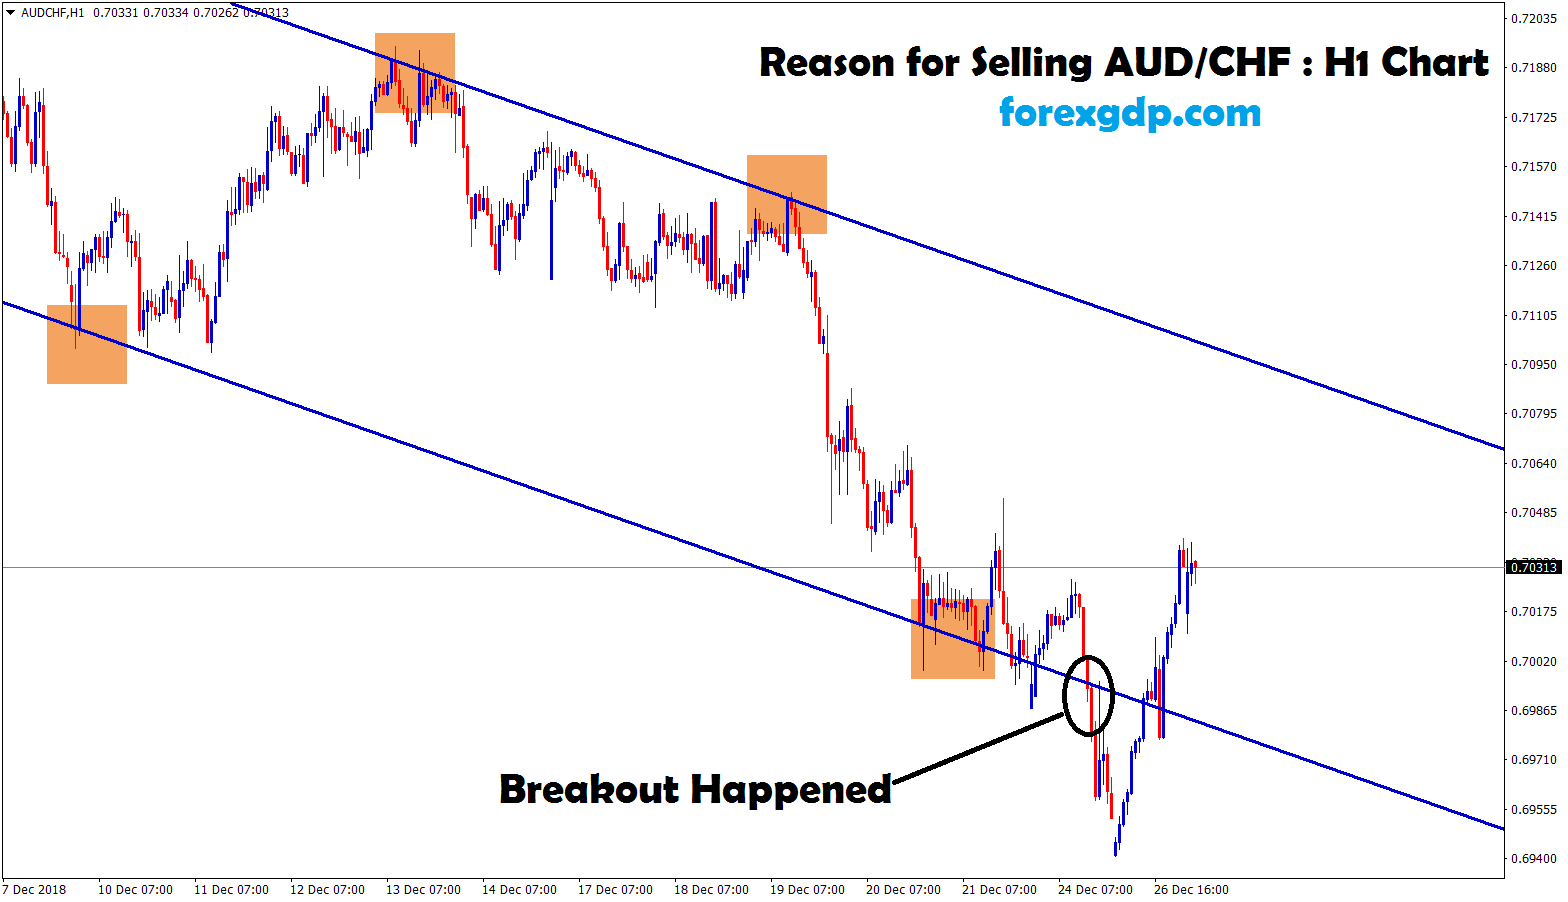
Reason for Selling AUD/CHF : AUD/CHF is moving in a downtrend between the ranges. After breakout happened at the bottom…
-
+638 Points Reached in USD/JPY Sell Signal
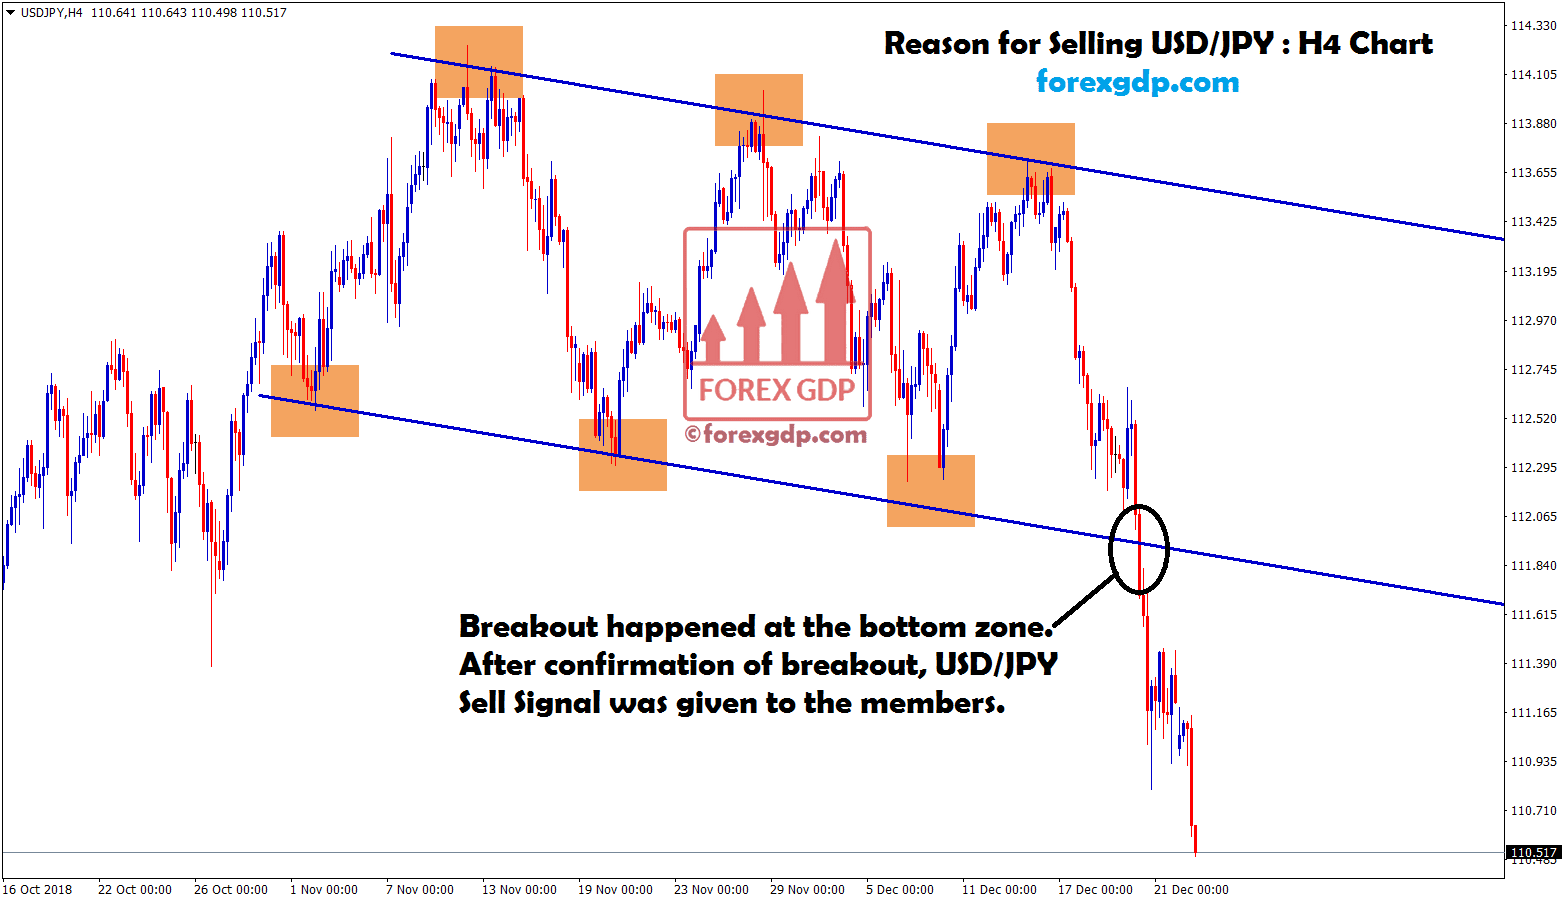
Reason for Selling USD/JPY: 1. USD/JPY was moving up and down between the ranges in H4 Chart. 2. Breakout happened…
-
+590 Points Reached in AUD/JPY Sell Signal
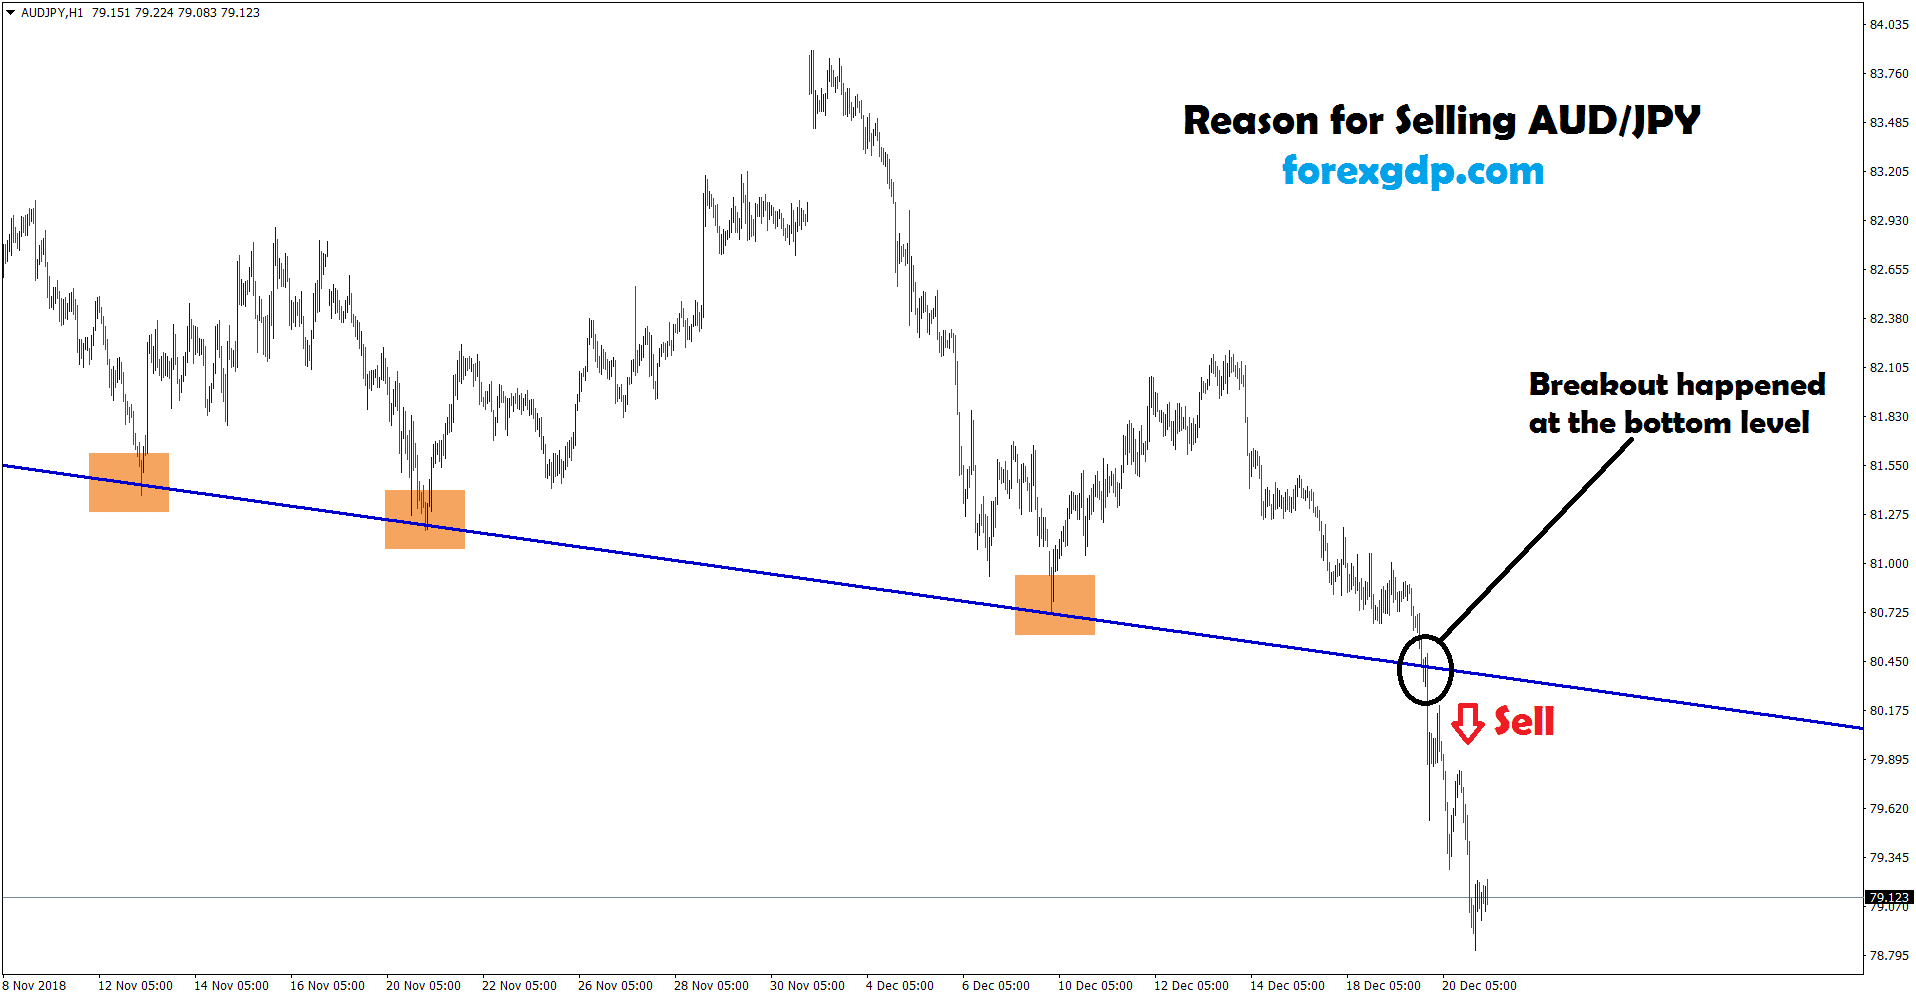
Reason for Selling AUD/JPY : 1. AUD/JPY was moving up and down between the ranges. 2. After breakout happened at…
-
+758 Points Reached in EUR/GBP Buy Signal
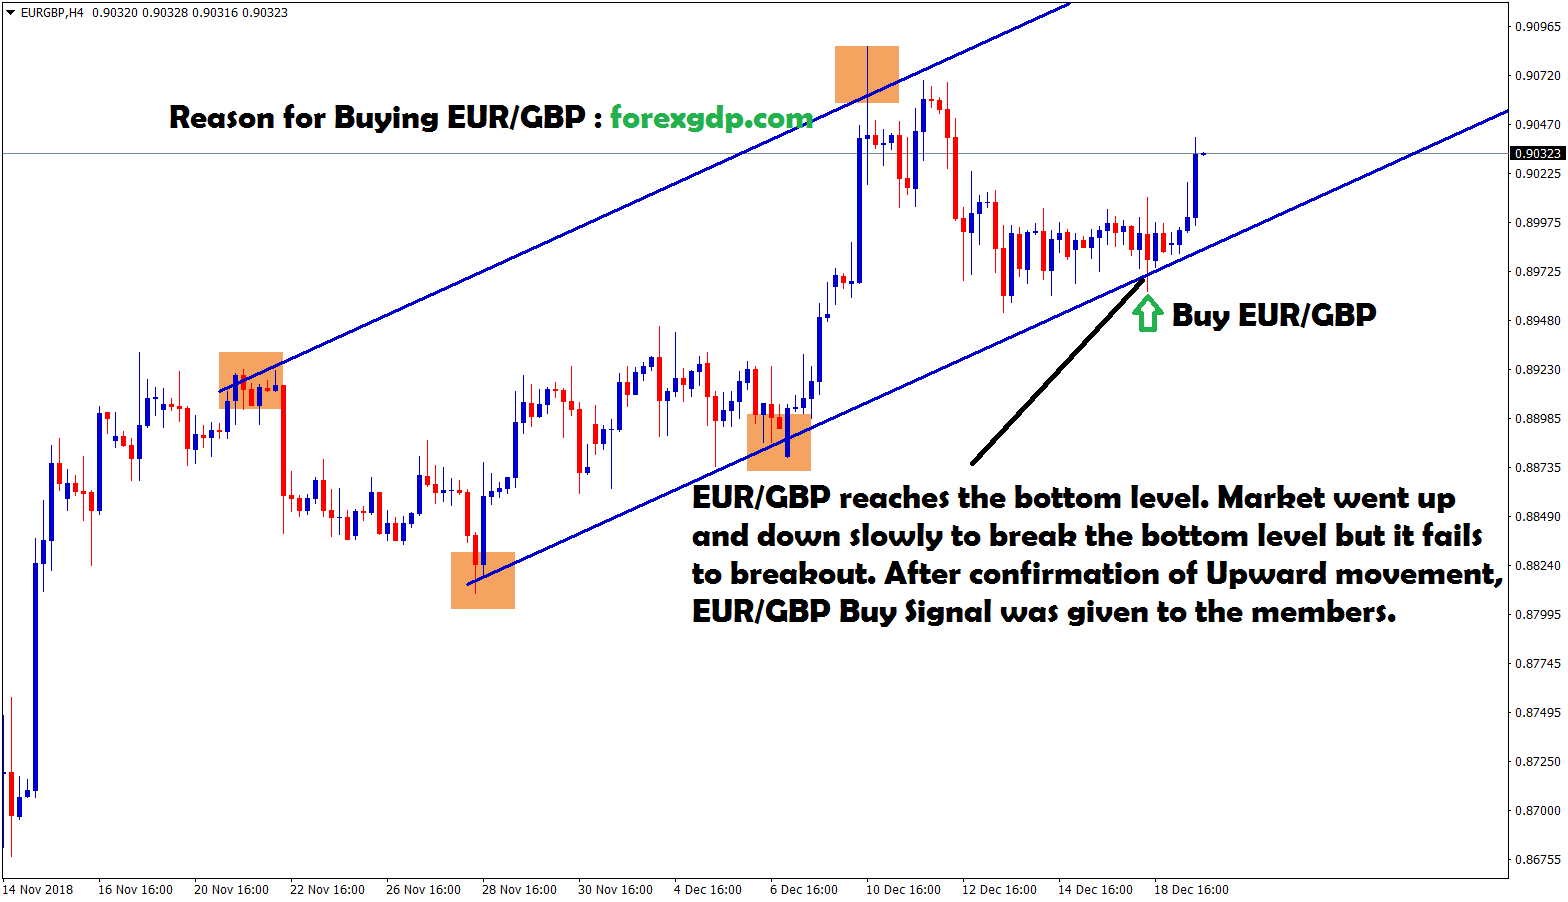
Reason for Buying EUR/GBP : 1. EUR/GBP is moving in an uptrend by forming Higher Highs and Higher Lows in…