Short Term Trade Analysis
Short Term Trade Analysis on all Forex Currency pairs, Commodities, Metals, CFD’s, stocks and shares. Short term trade analysis like scalping, intraday forex signals are given at best trade setup. Check latest short term analysis setups now. Click here to join Free.
-
+587 Points Profit Reached Successfully in NZD/USD Sell Signal
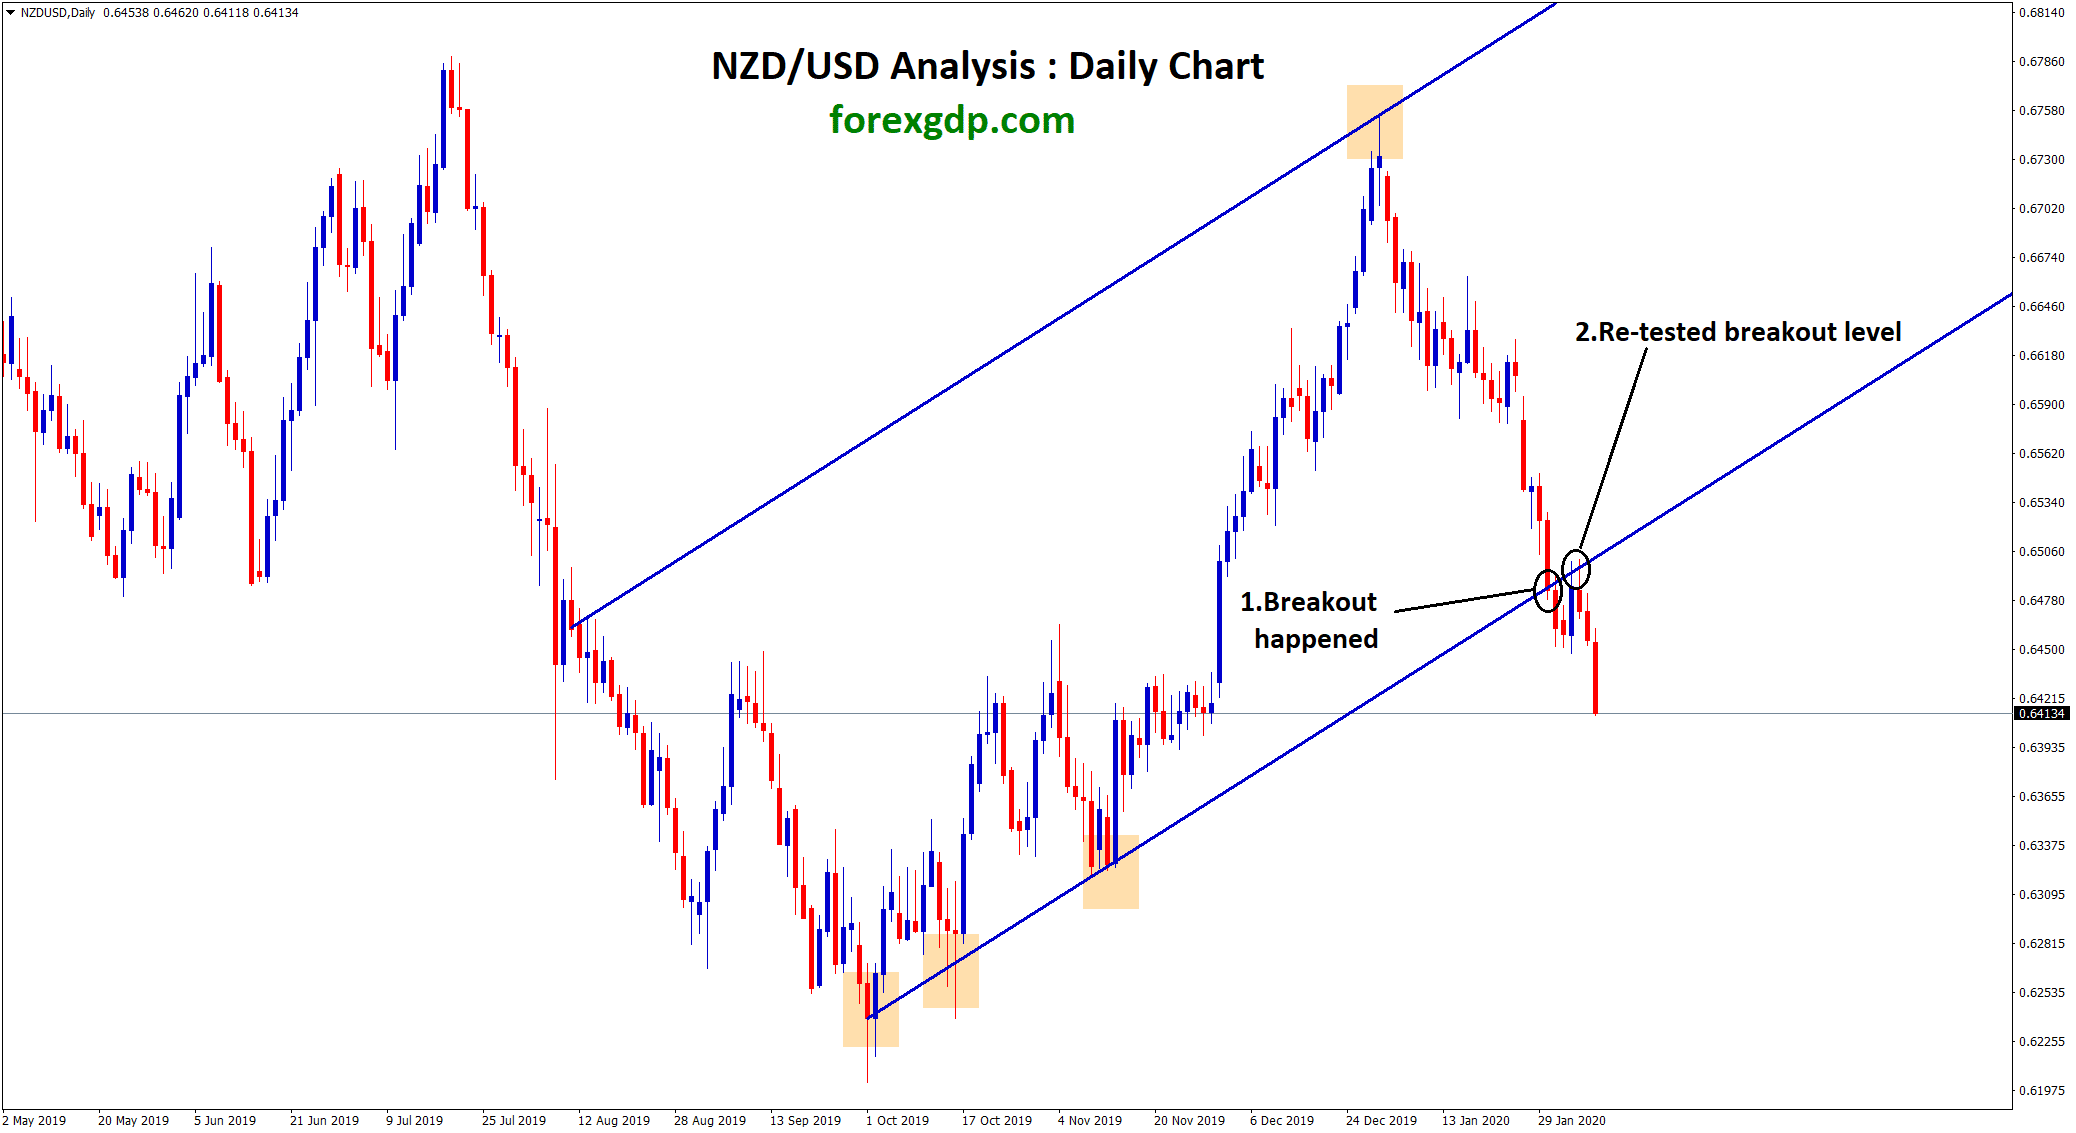
NZD/USD Analysis : NZD/USD was moving in an Uptrend range by forming Higher Highs and Higher Lows in Daily chart.…
-
AUD/JPY broken the bottom, Re-tested the broken level and starts to fall now
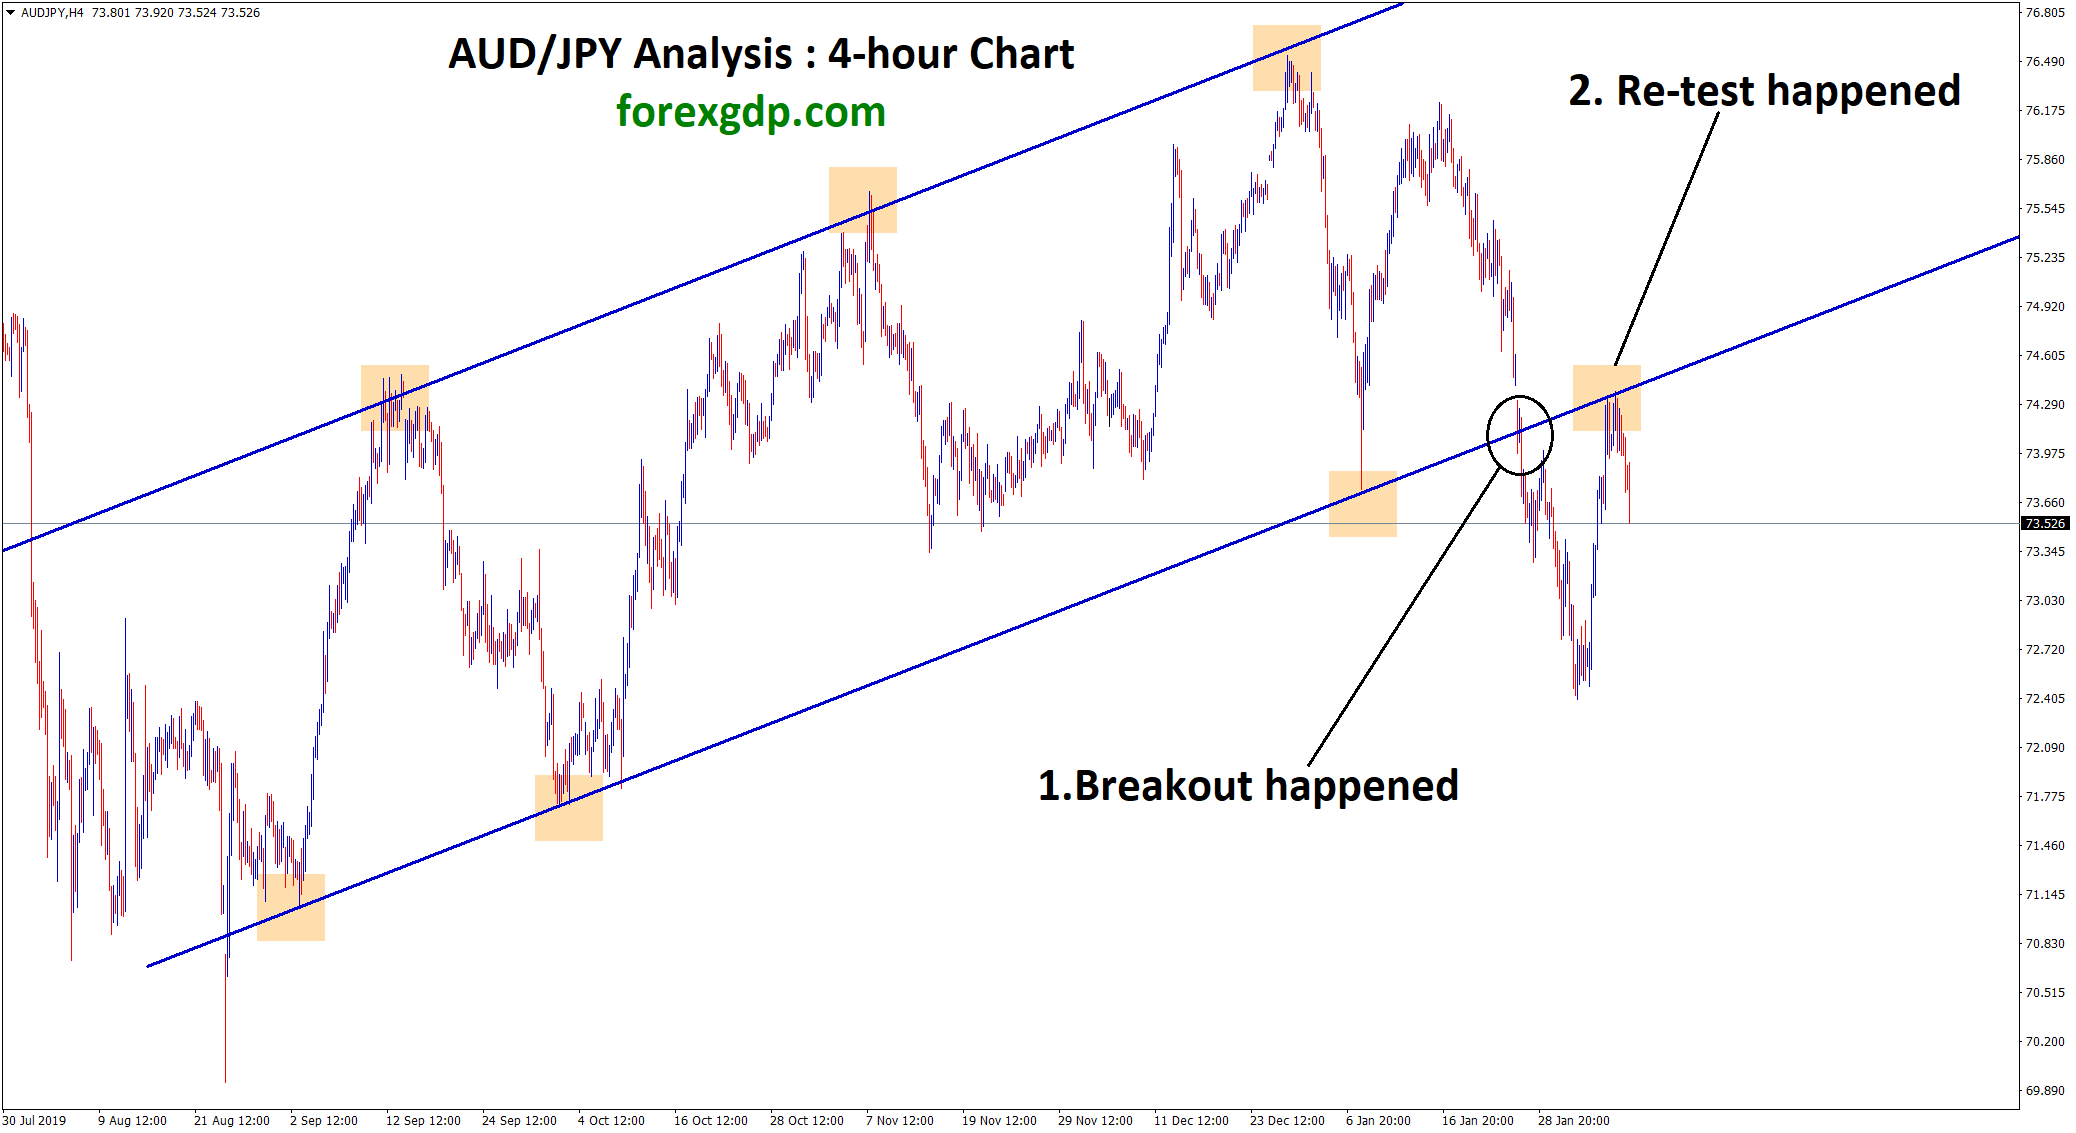
AUD/JPY Analysis : AUD/JPY broken the bottom zone of the uptrend range in 4 hour chart. After breakout, market re-tested…
-
+400 Points Reached in USD/JPY Buy Signal
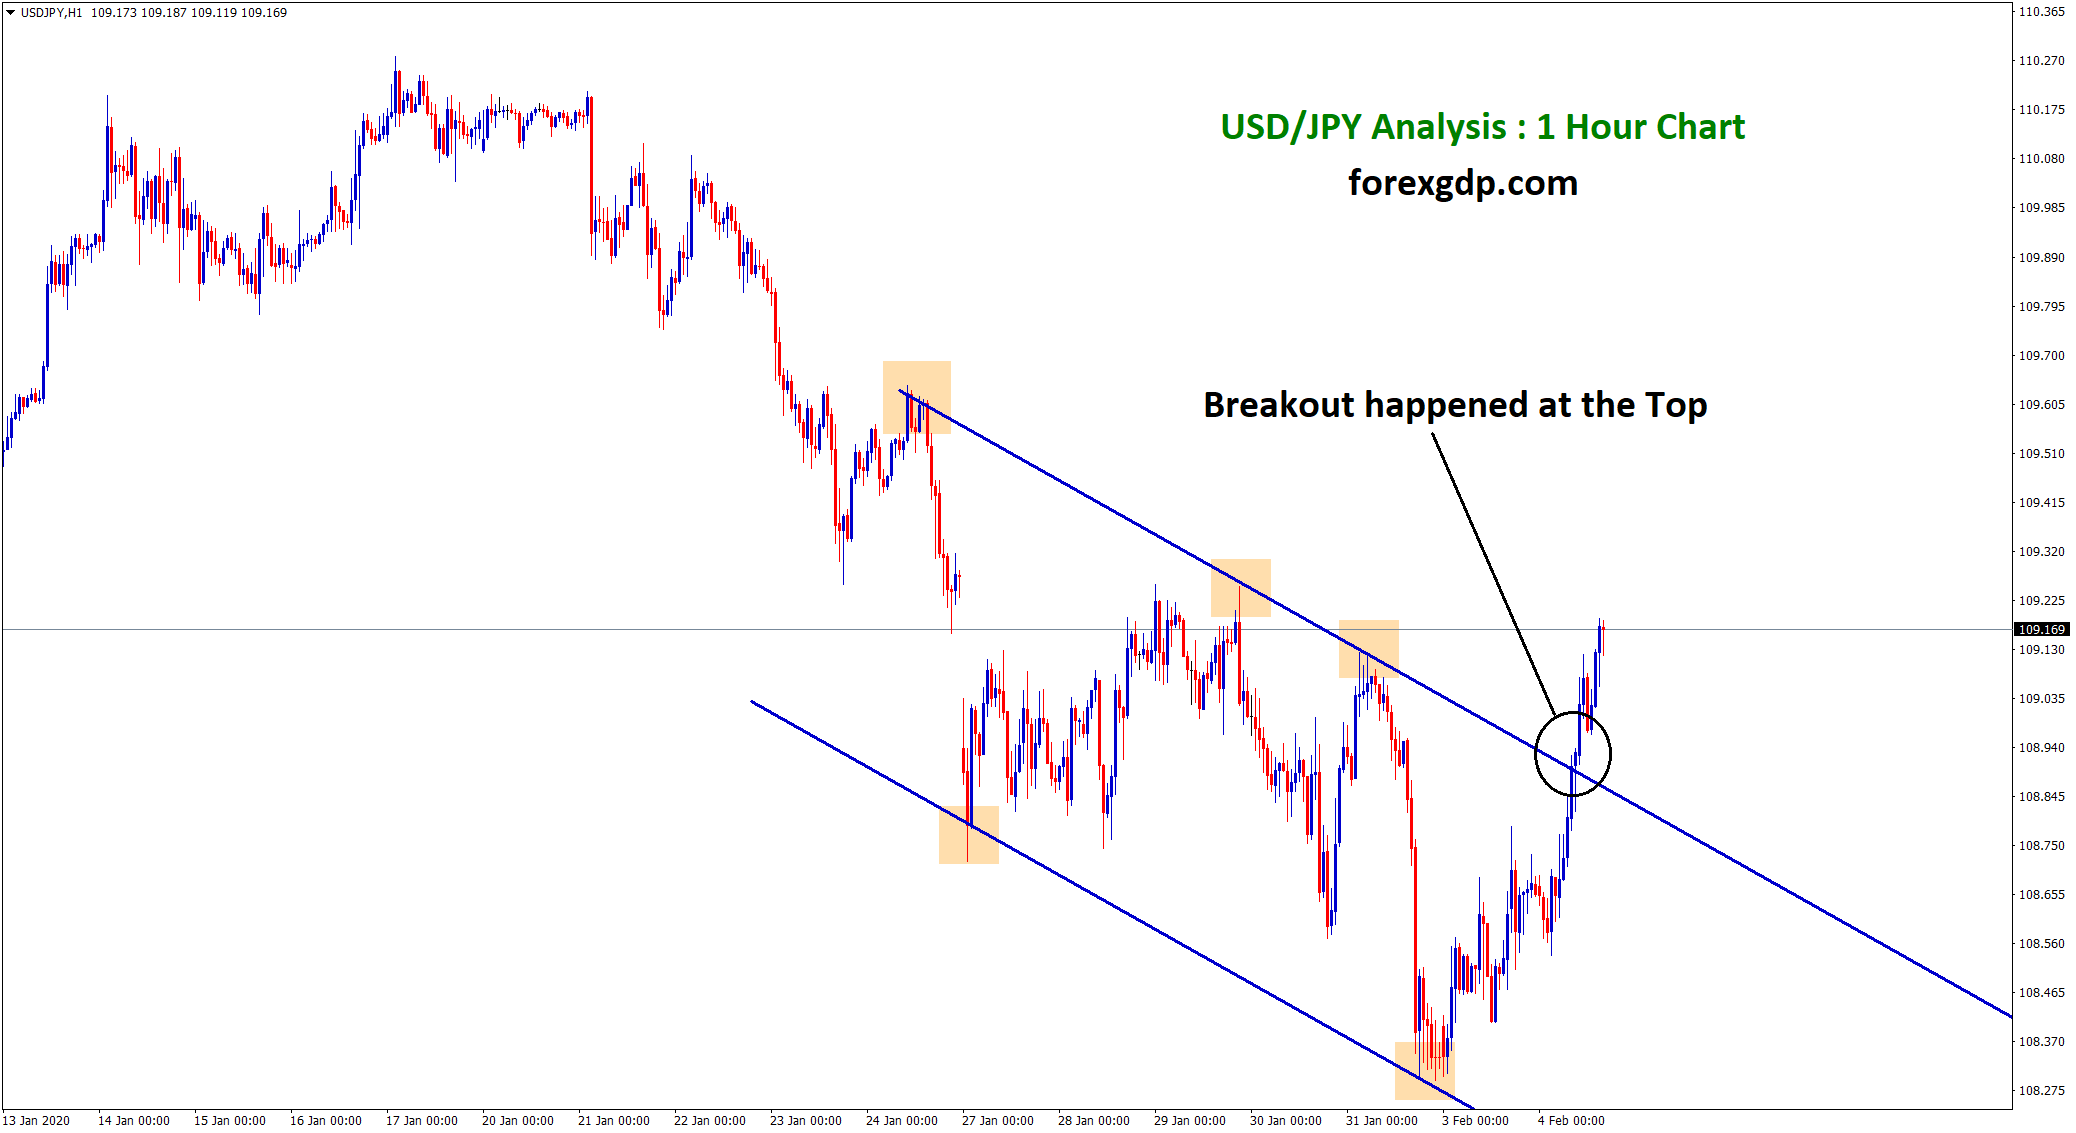
USD/JPY Analysis : USD/JPY broken the top zone of the range and starts to move up. After the confirmation of…
-
+638 Points Reached in CHF/JPY Buy Signal
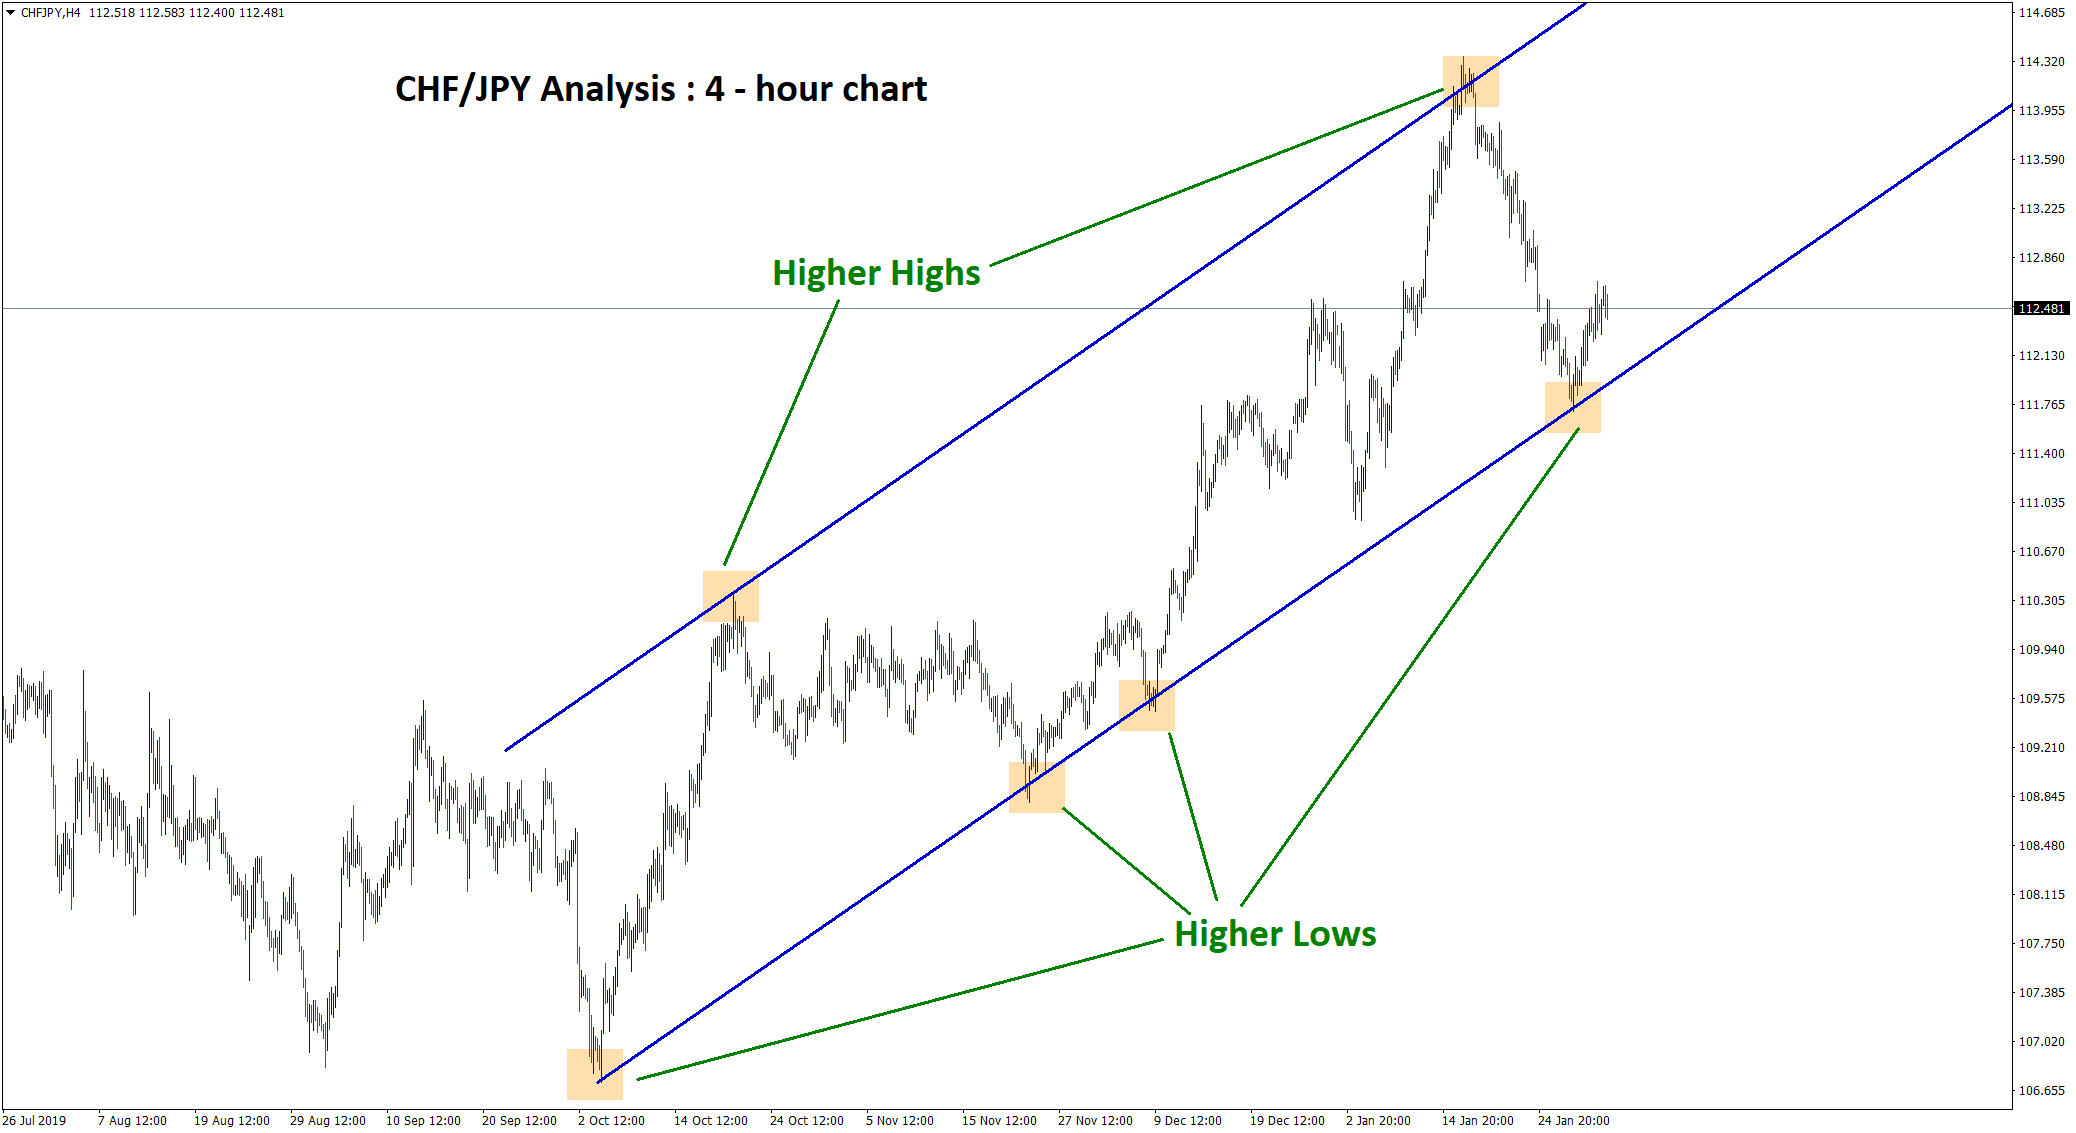
CHF/JPY Analysis : CHF/JPY is moving in an uptrend by forming Higher Highs, Higher Lows in 4 hour chart. Market…
-
EUR/USD is moving in a downtrend range
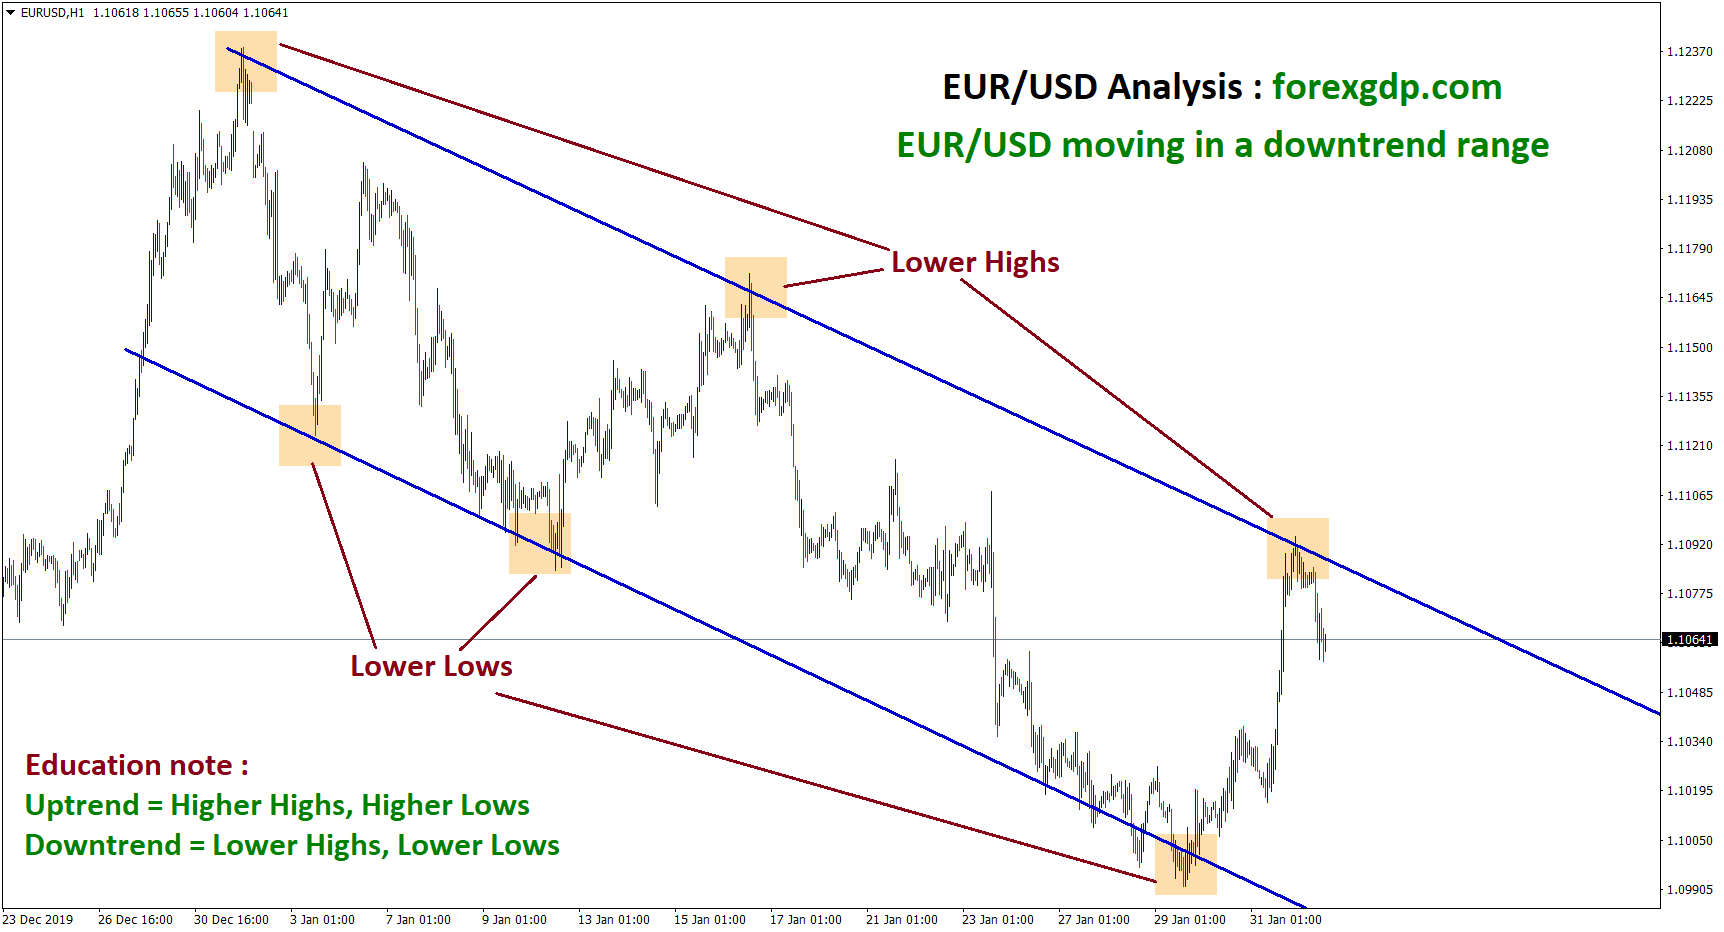
EUR/USD Analysis : EUR/USD is moving in a downtrend range for long time. Let's wait for the confirmation of breakout…
-
EUR/GBP reached the top zone, Wait for Breakout or Reversal
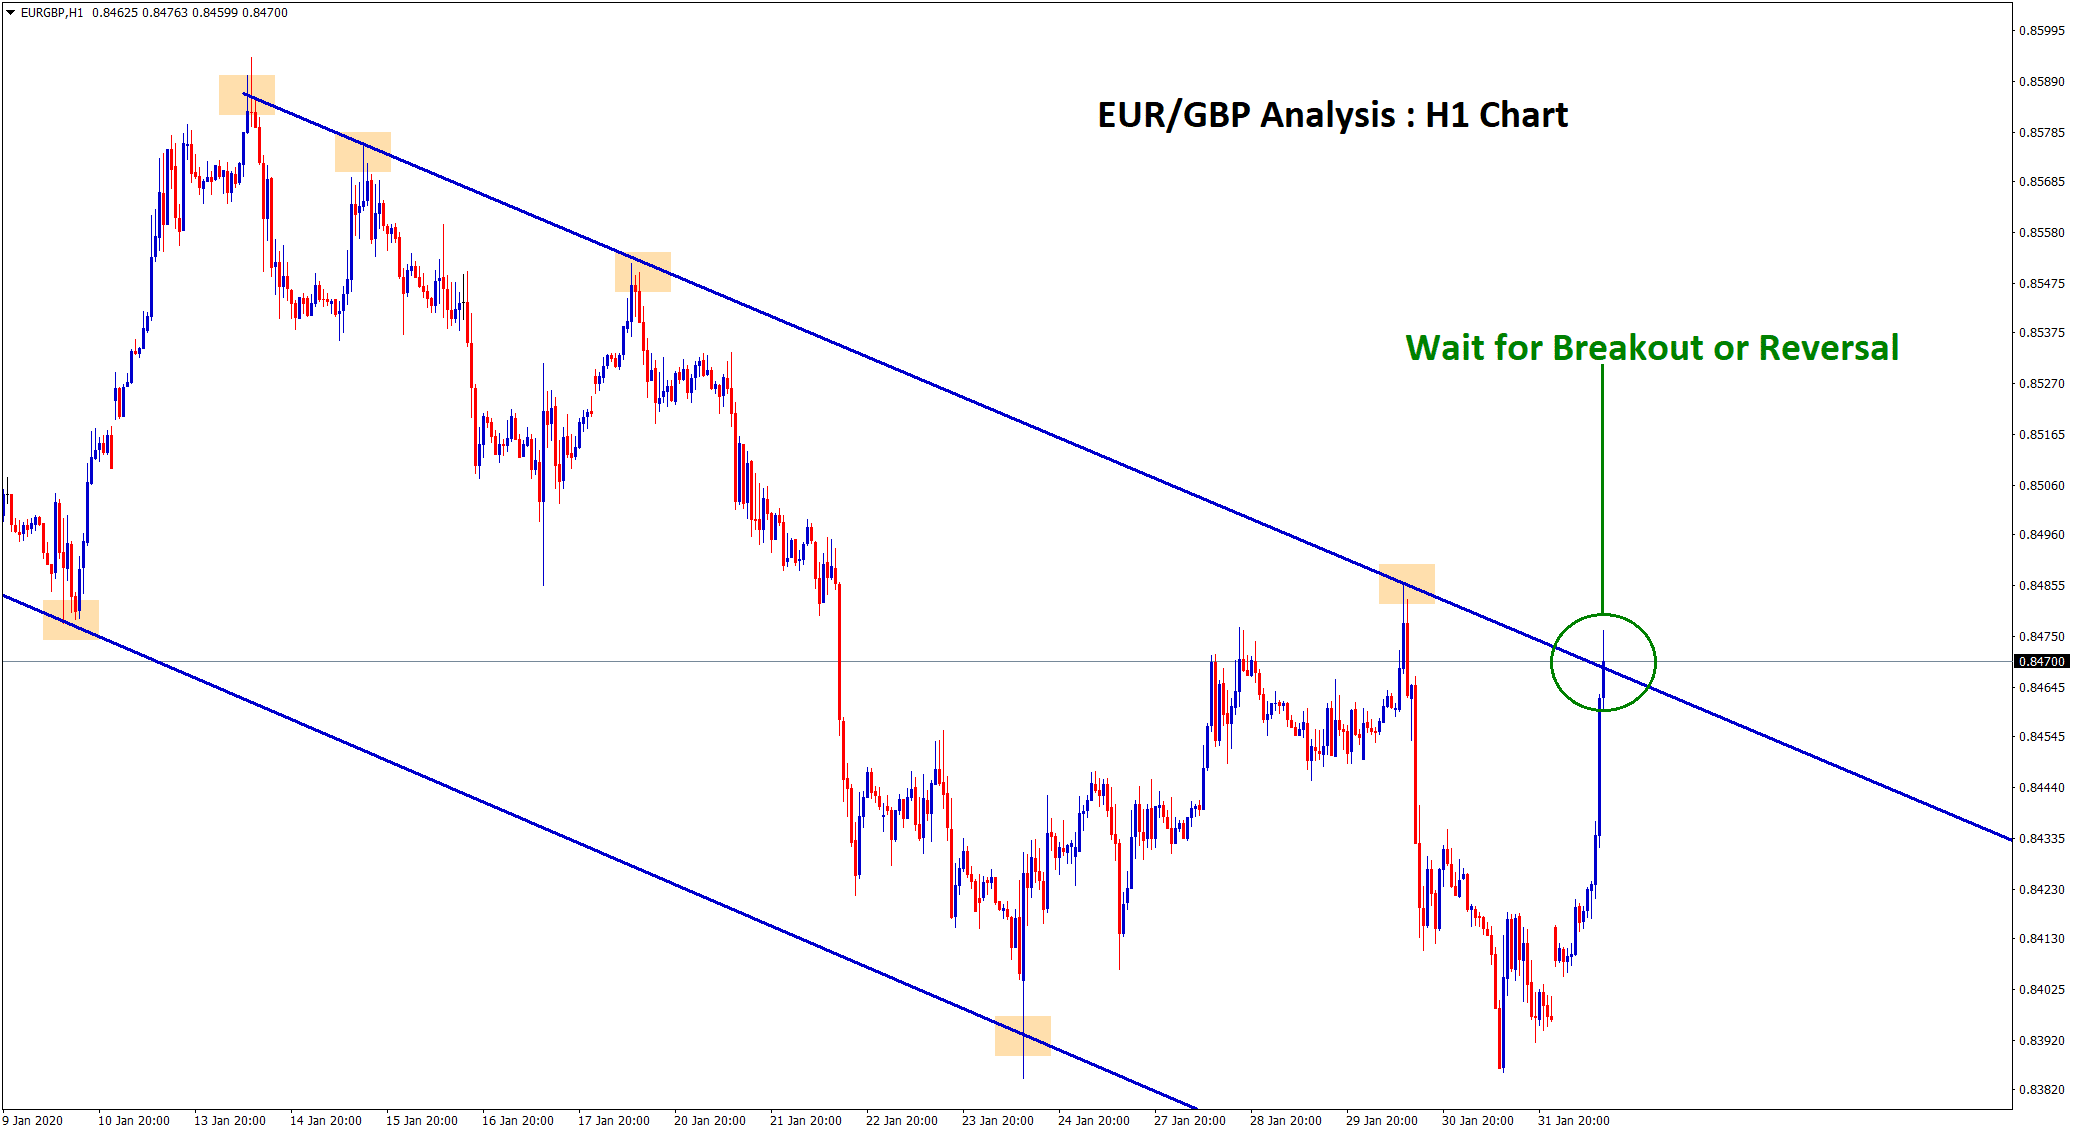
EUR/GBP Analysis : EUR/GBP reached the top zone of the range in H1 Chart. Let's wait for the confirmation of…
-
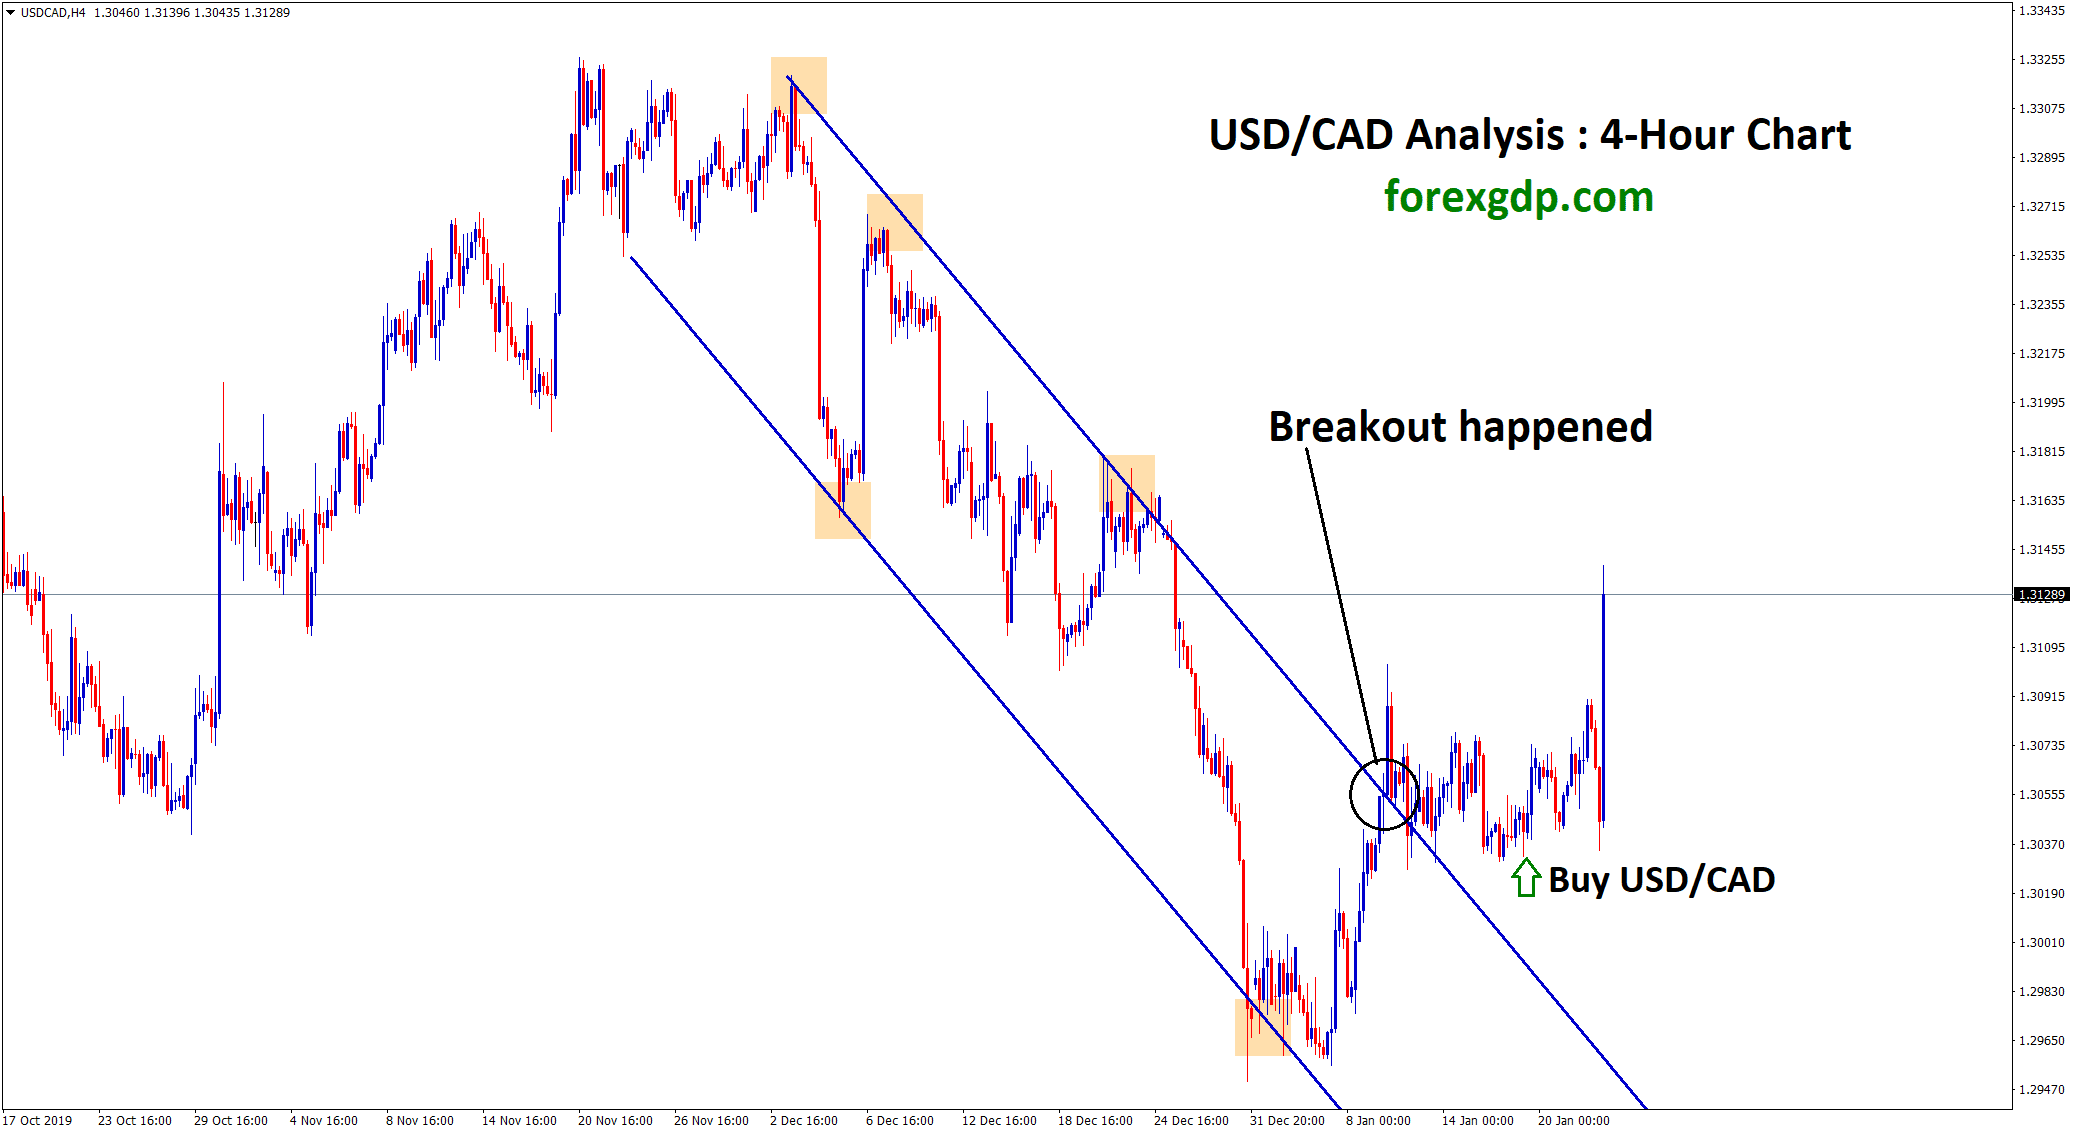
+700 Points Profit Reached in USD/CAD Buy Signal
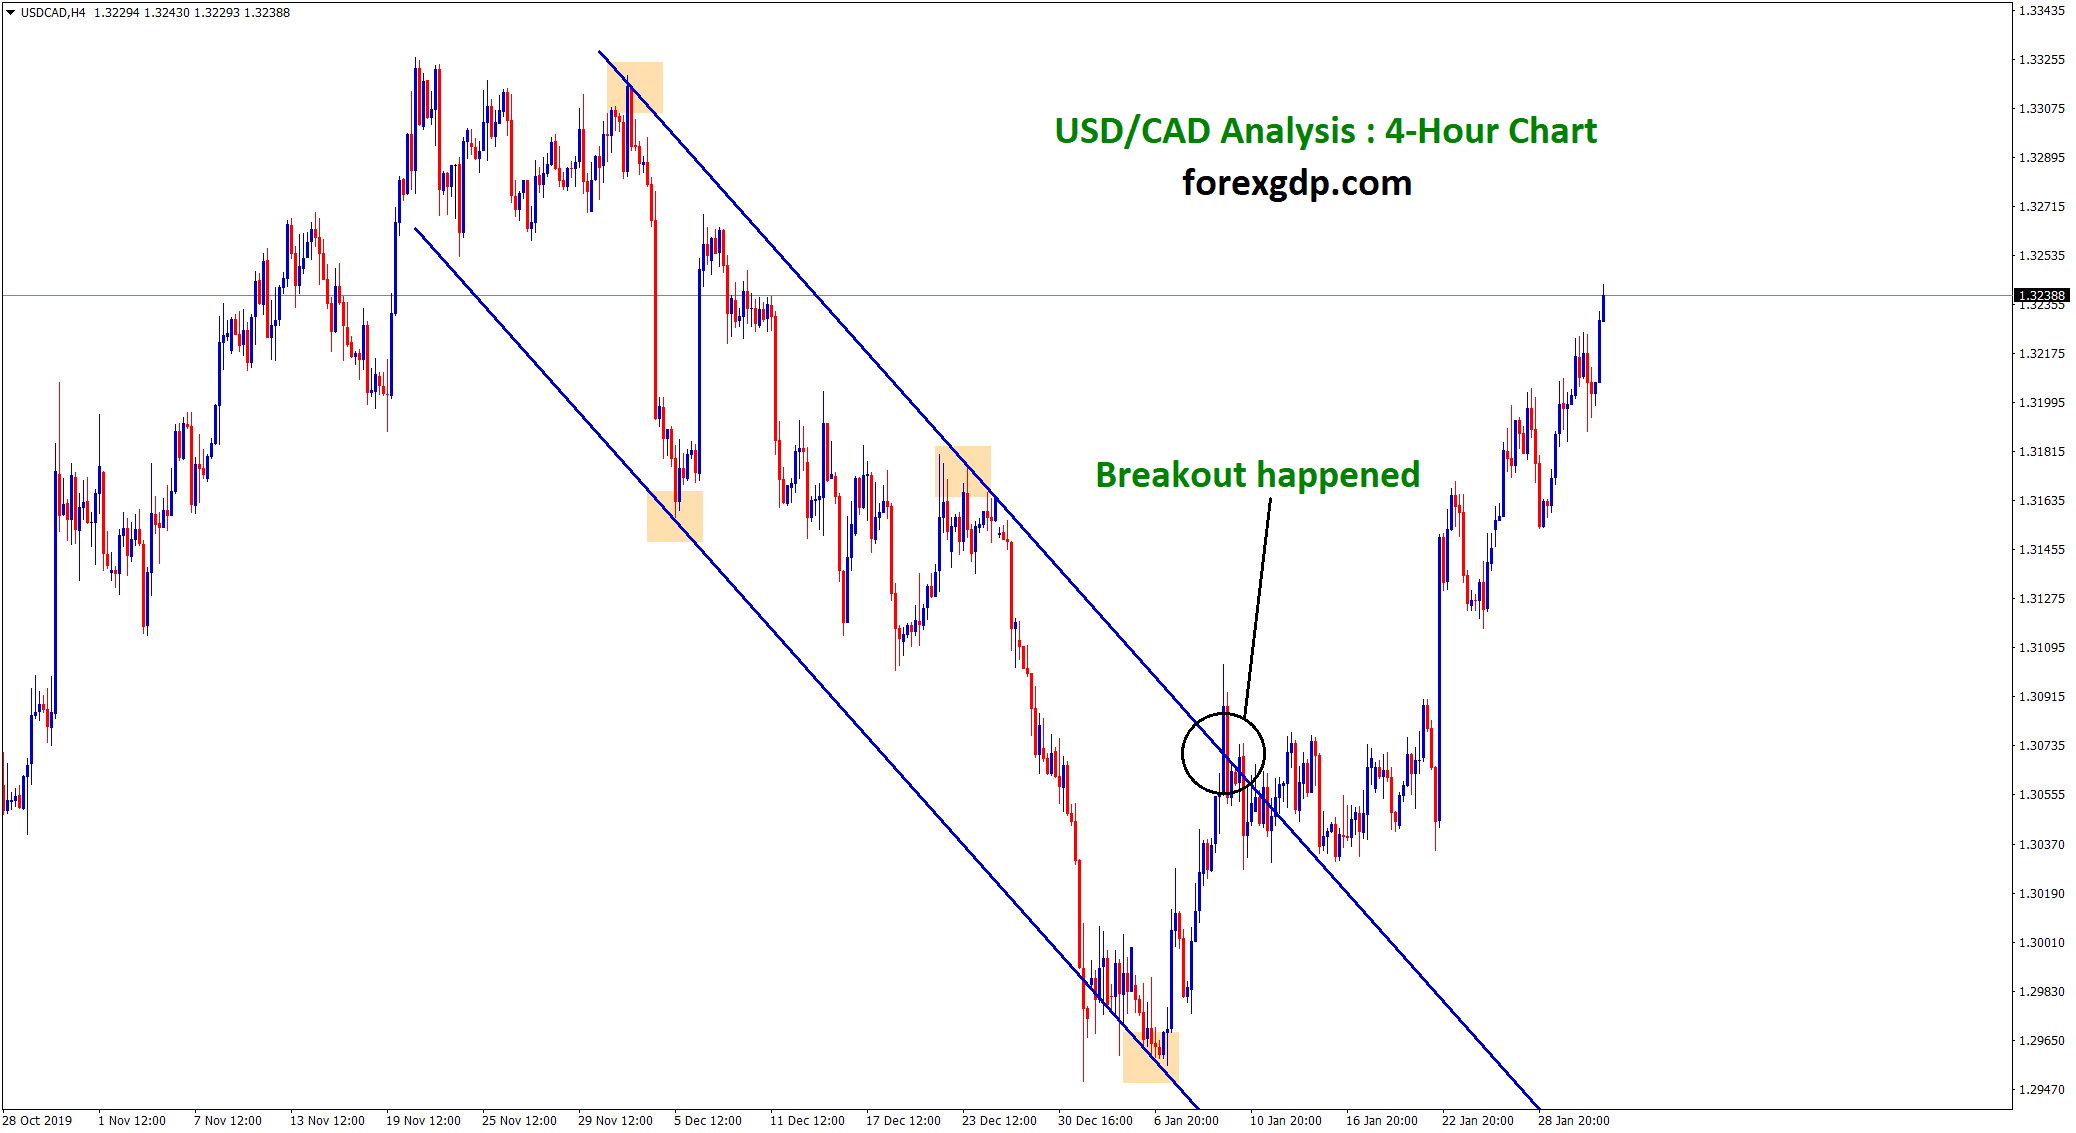
USD/CAD Analysis : In 4-hour chart, Breakout happened at the downtrend range and market starts to move up. In 30…
-
AUD/CAD reached the bottom after long time.
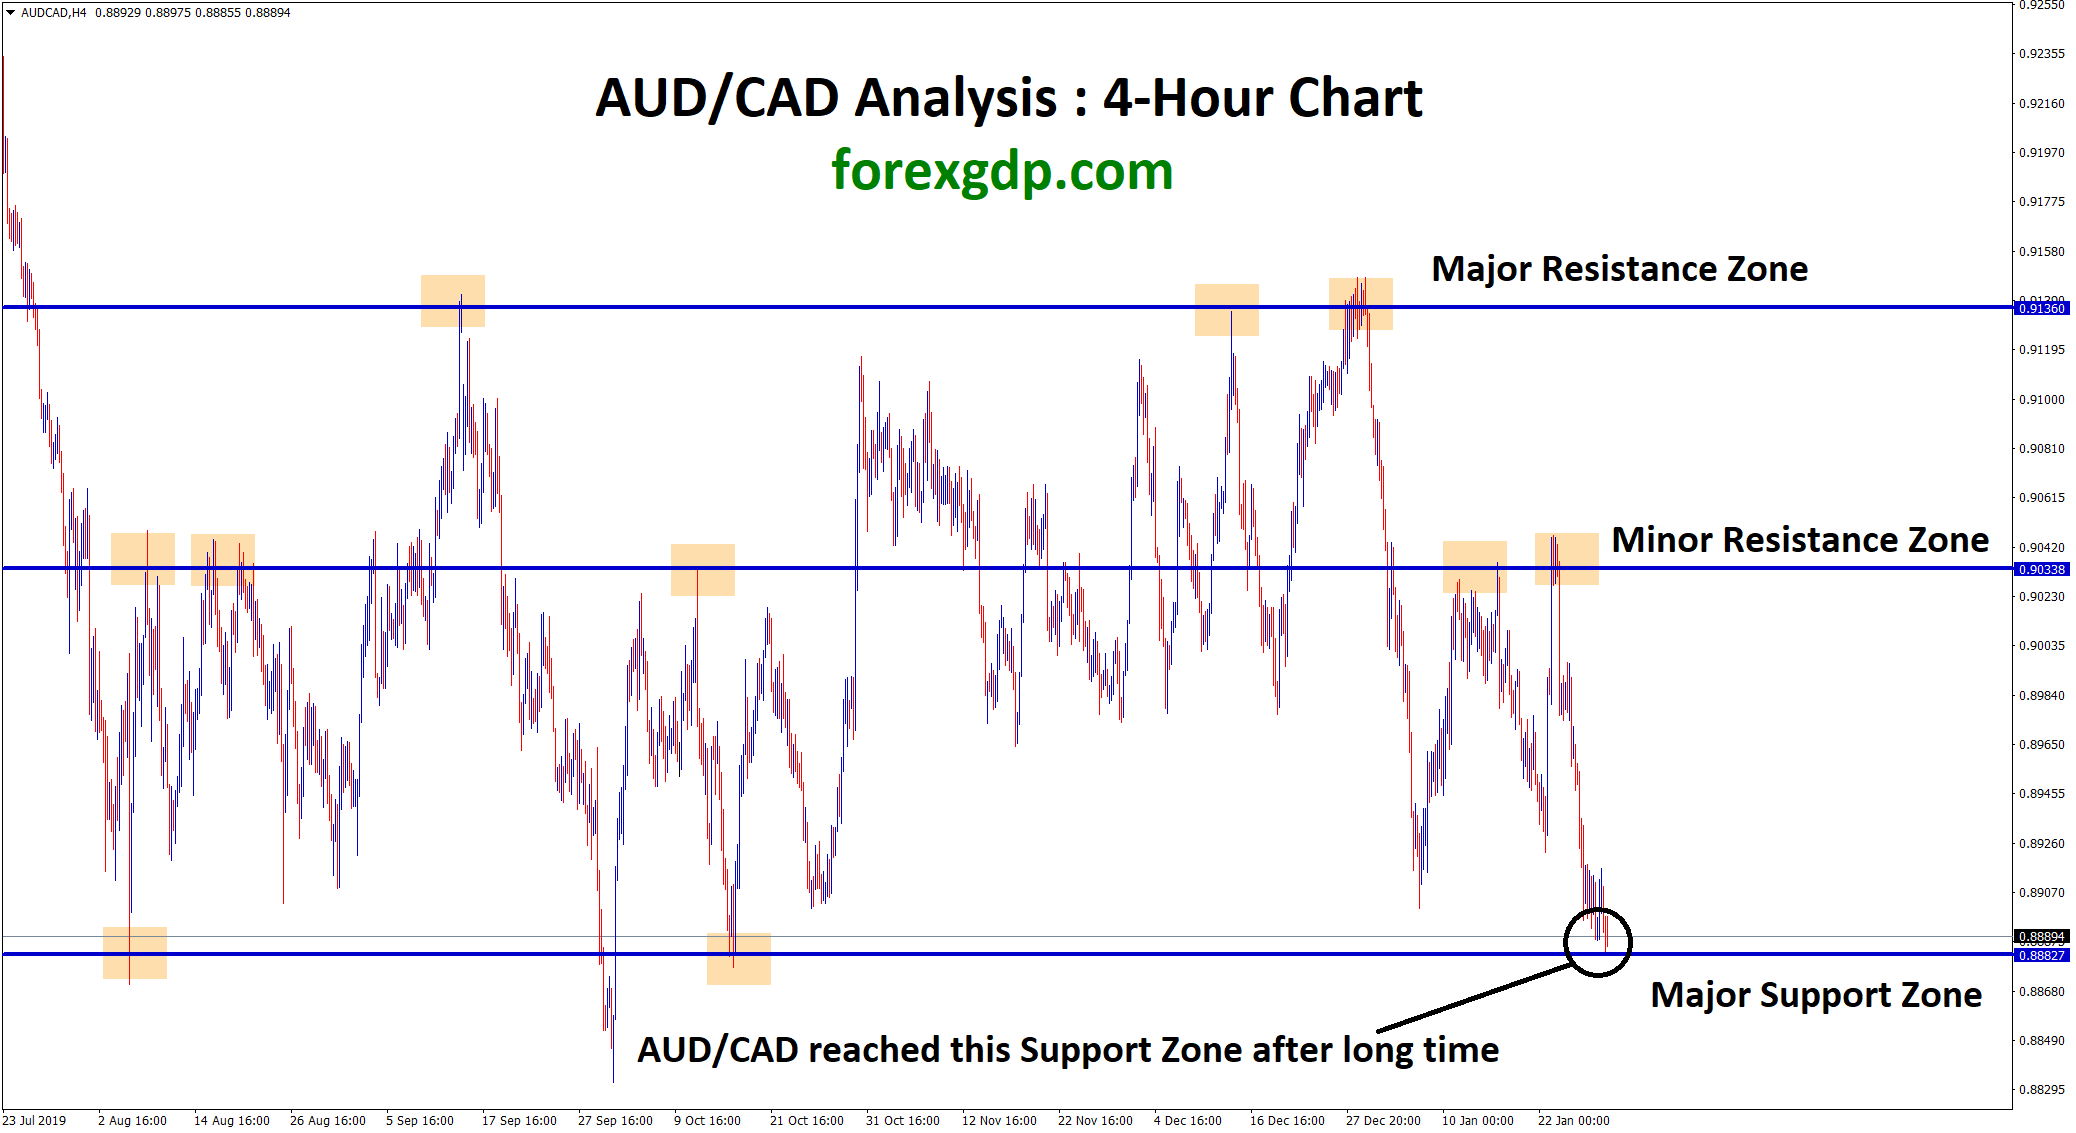
AUD/CAD Analysis : AUD/CAD has reached the bottom zone after long time in H4 Chart. Let's wait for the confirmation…
-
+1320 Points Reached in EUR/GBP Sell Signal
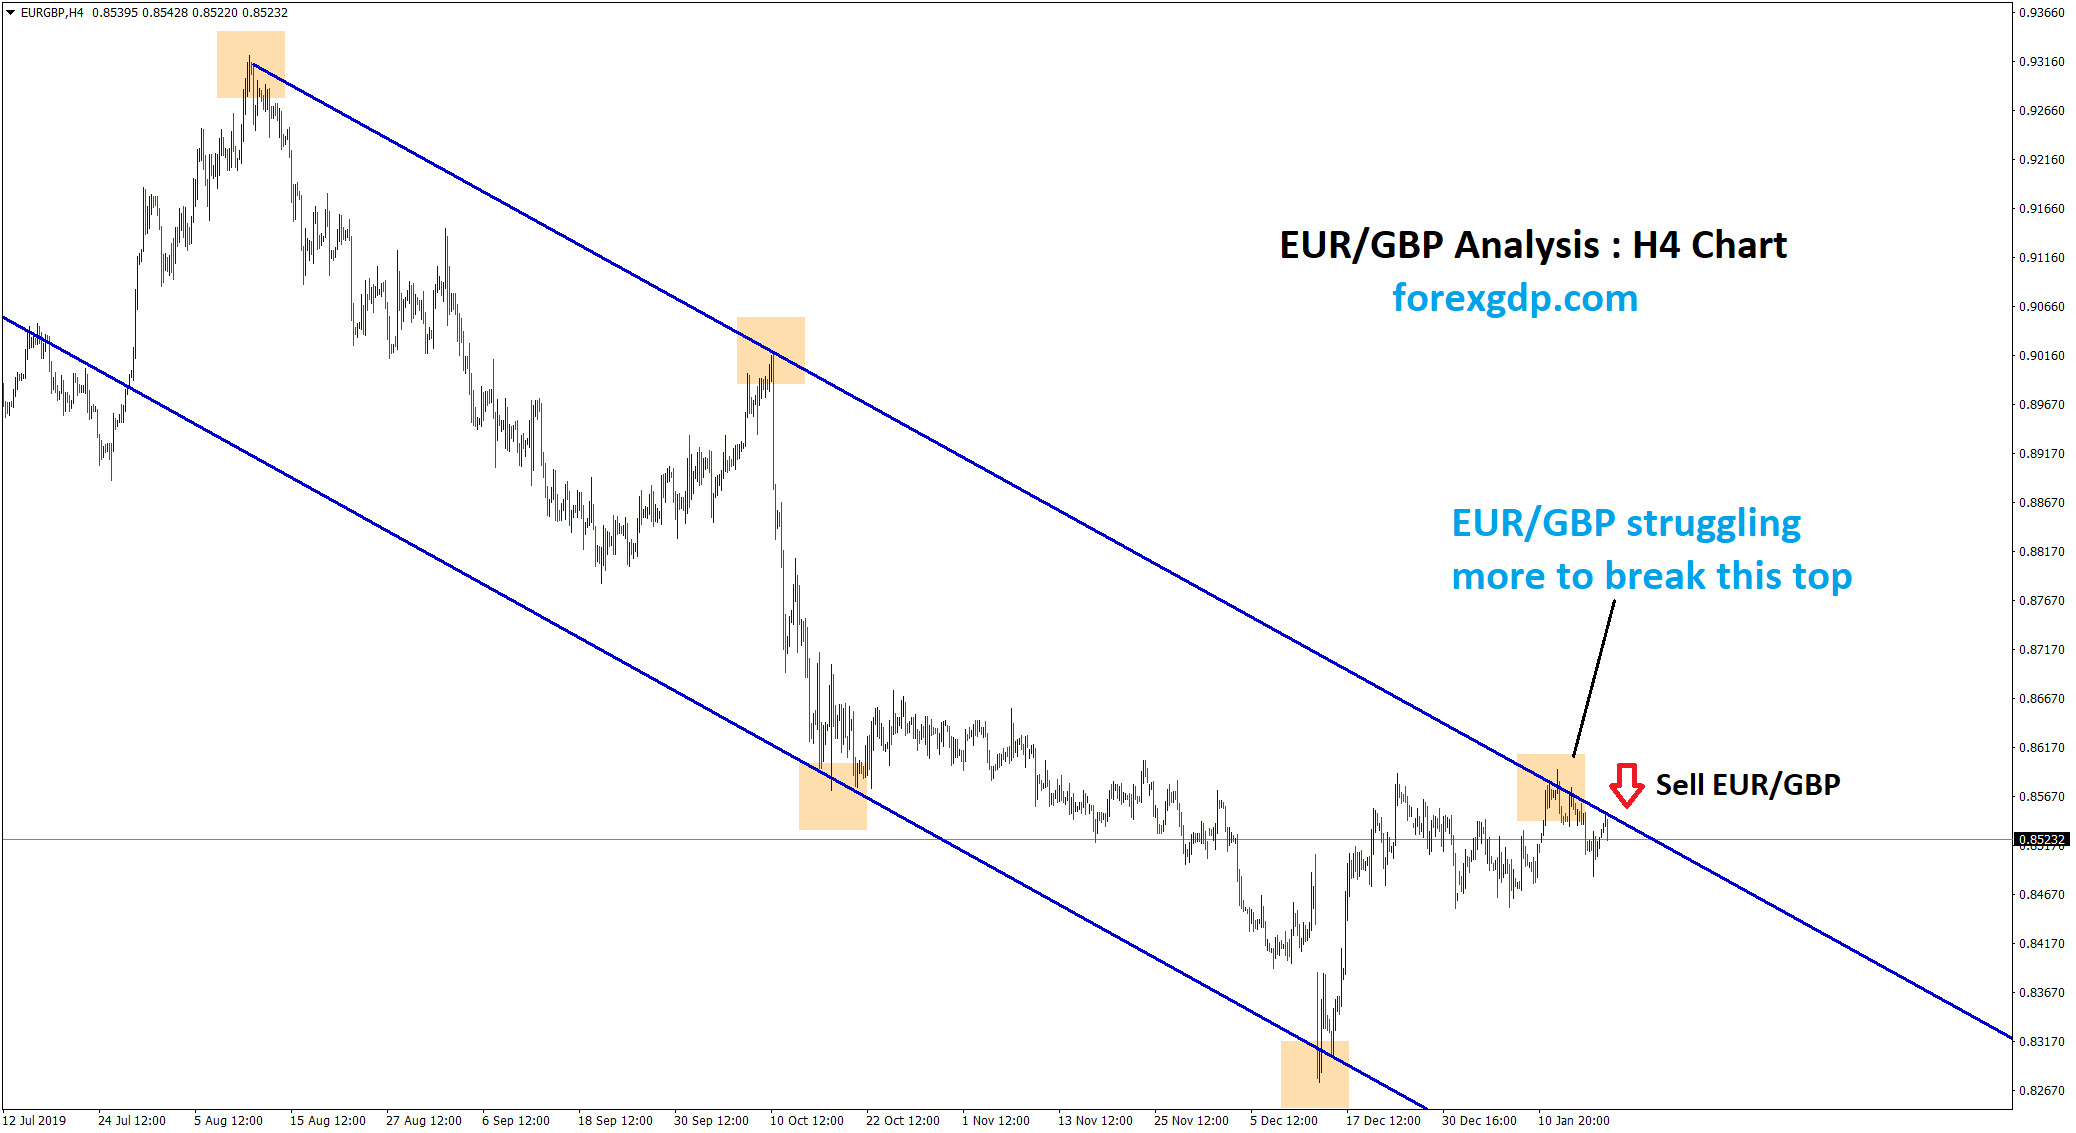
EUR/GBP Analysis : EUR/GBP is moving in a downtrend by forming Lower Highs and Lower Lows. EUR/GBP struggled more to…
-
+1650 Points Profit Reached in AUD/JPY Sell Signal
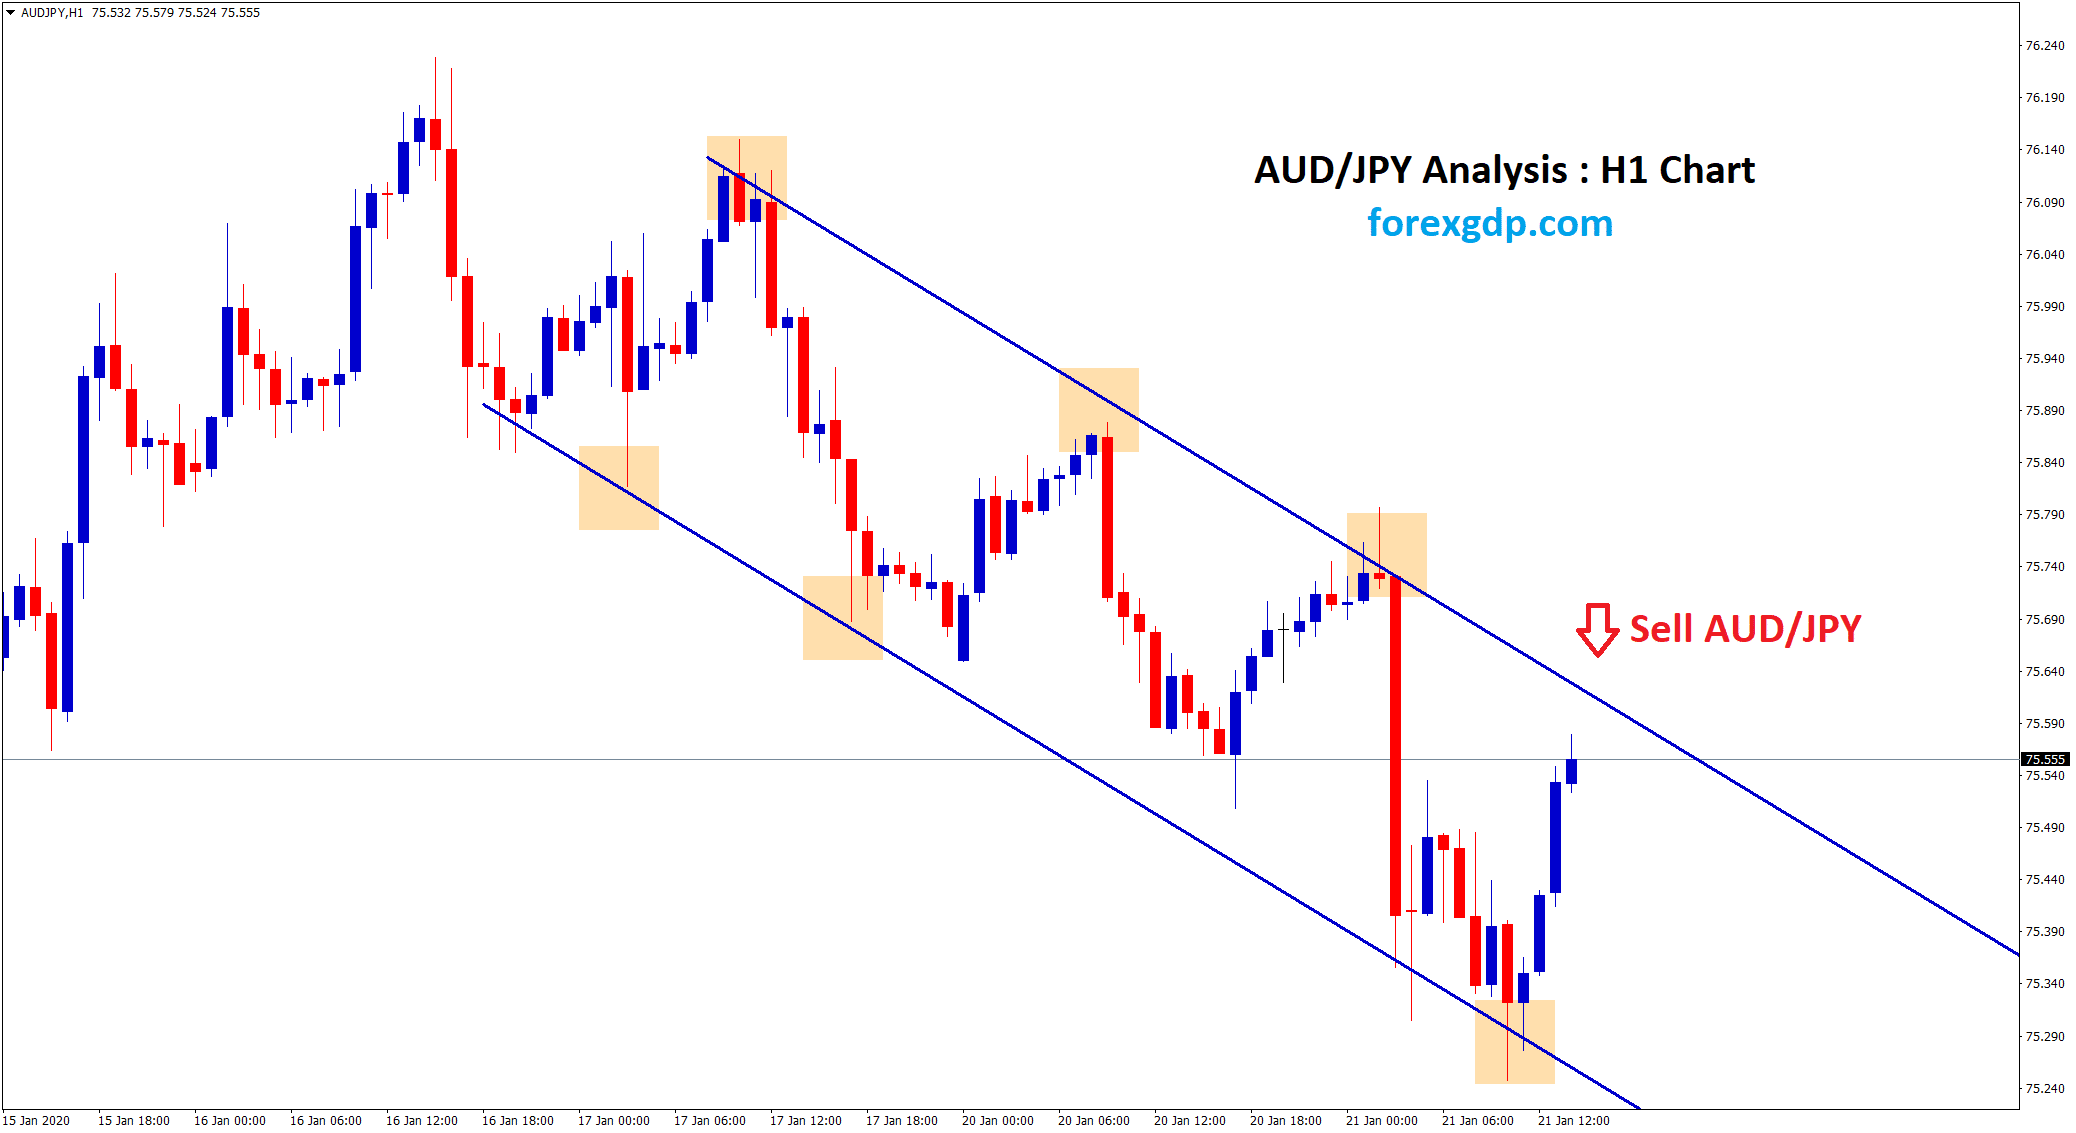
AUD/JPY Analysis : AUD/JPY is moving in a downtrend in H1 Chart. After market reaching the top zone, AUD/JPY Sell…
-
-550 Points Reached in AUD/USD Buy Signal
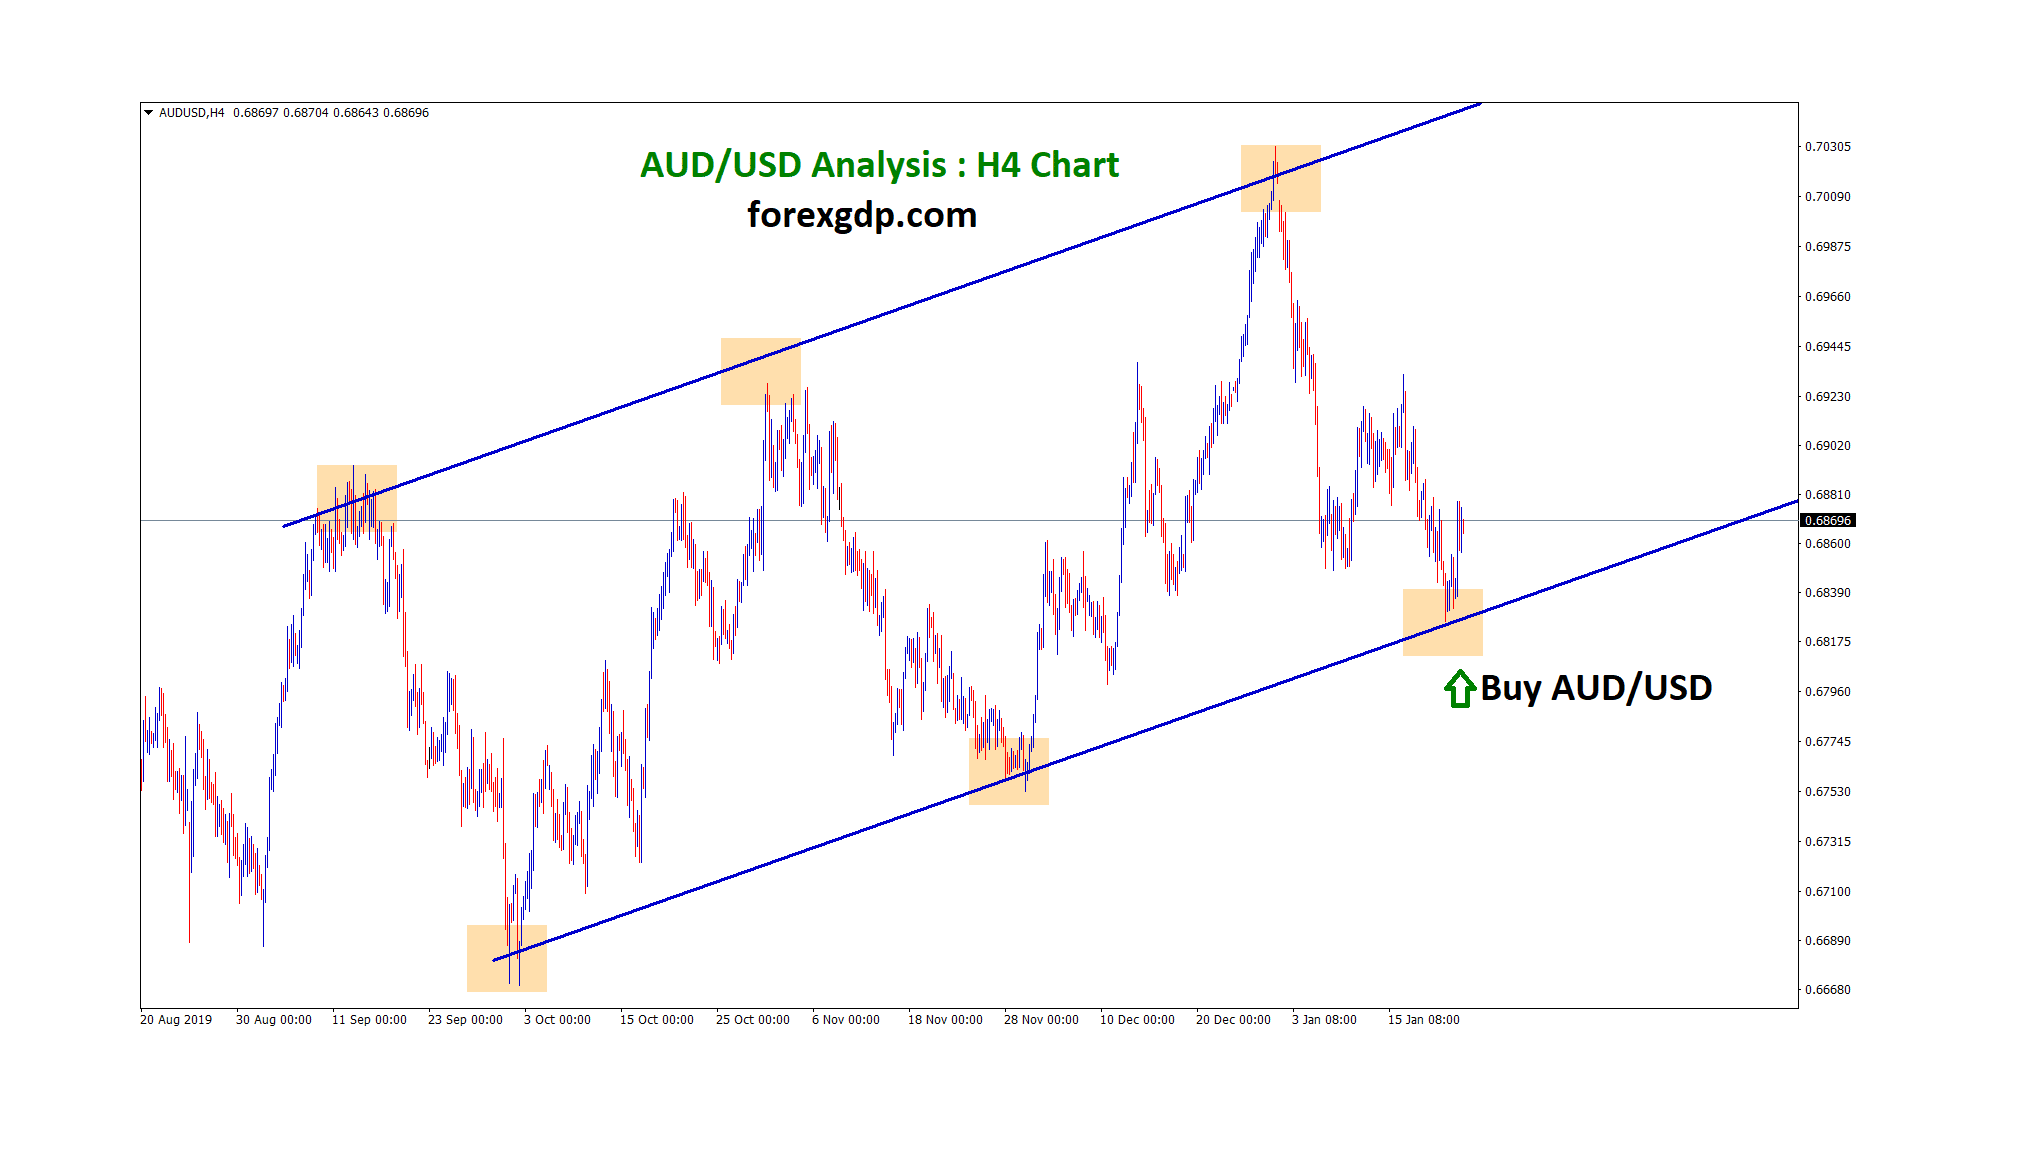
AUD/USD Analysis : AUD/USD broken the top zone of the downtrend ranges in Daily Chart. After breakout, Market re-tested the…
-
+1385 Points Reached in USD/CAD Buy Signal
USD/CAD Analysis : USD/CAD broken the top zone of the downtrend range. After the confirmation of breakout. we wait for…