usdcad short term
-
USDCAD breakout and Retest trade made +580 Points
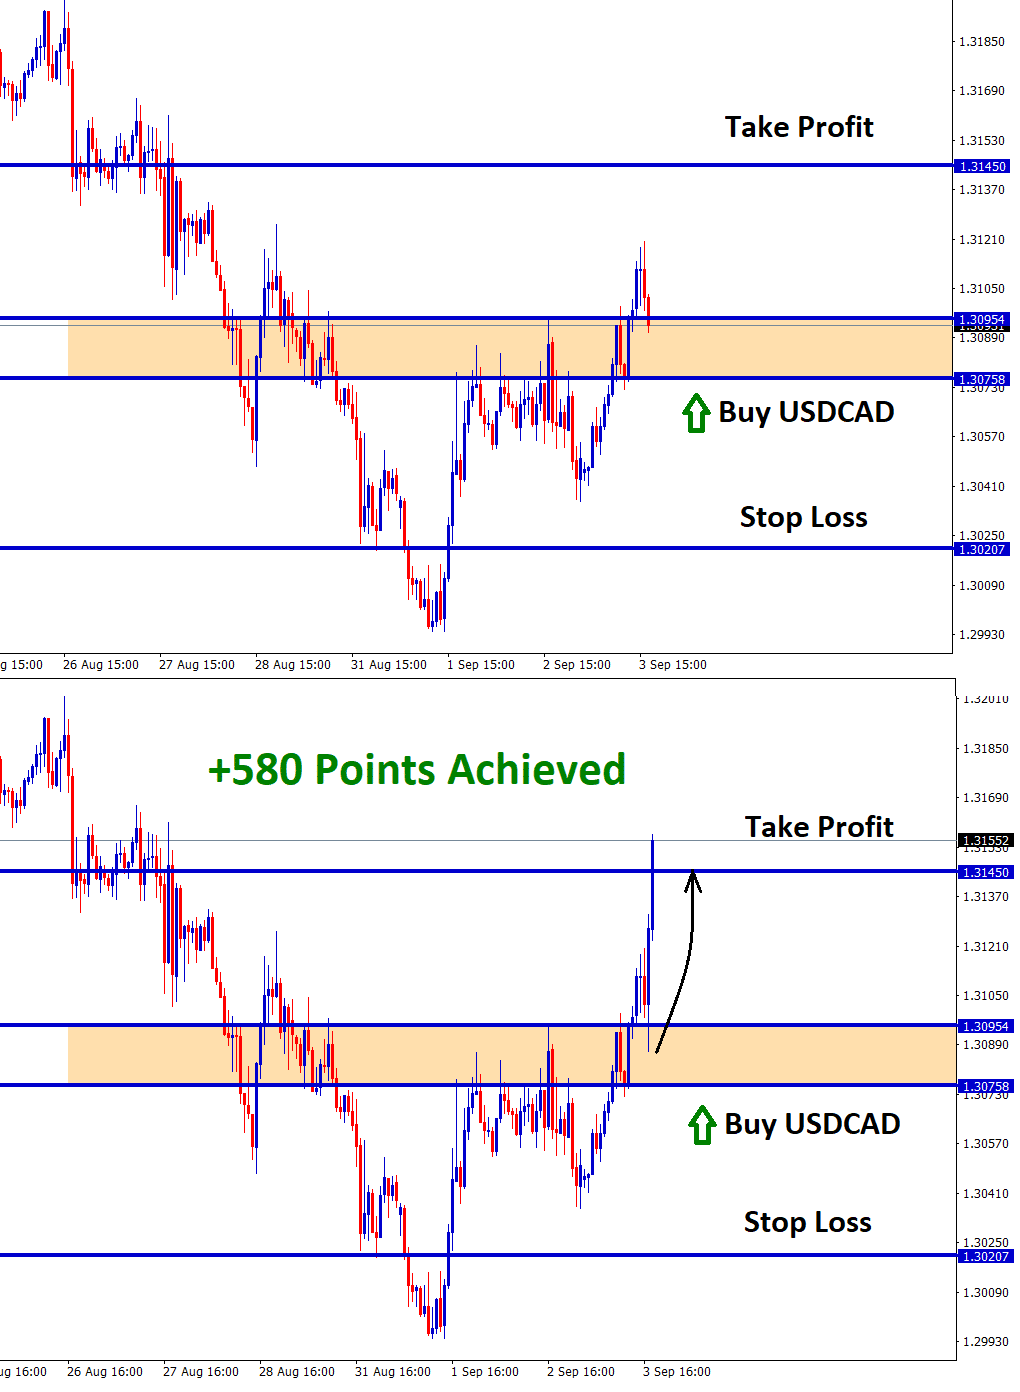
USDCAD has broken the top level of the down trend line. After the breakout, market retested the breakout level and…
-
Correlation Analysis: CADCHF, USDCAD, USDCHF at key levels
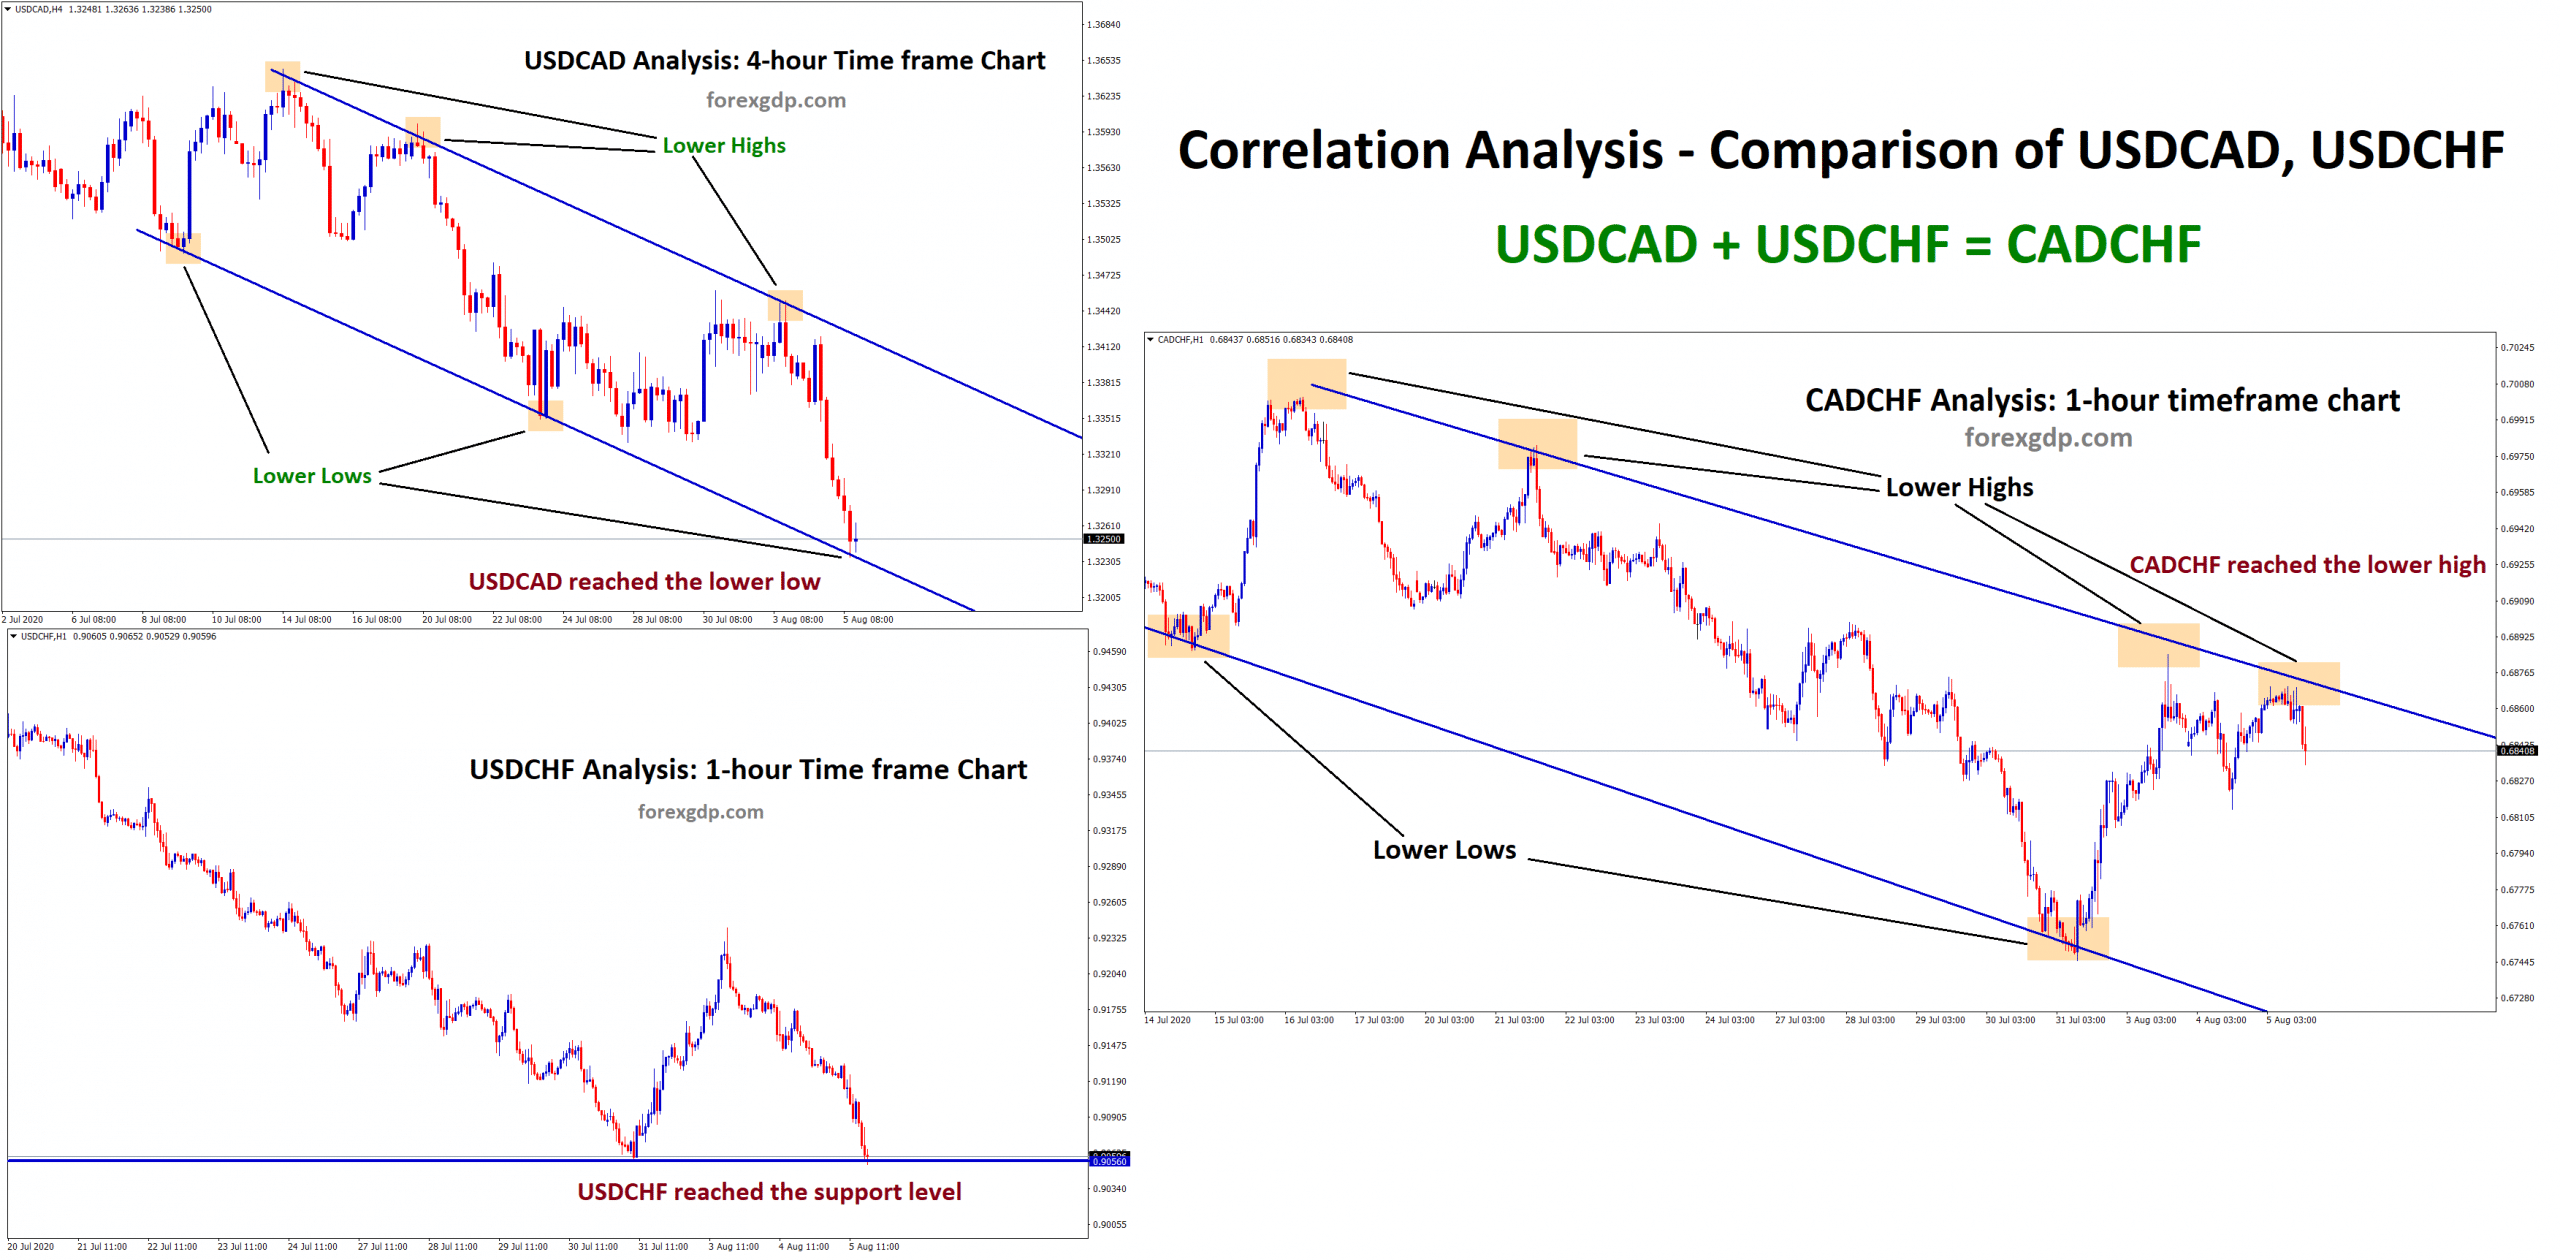
Correlation Analysis: USDCAD + USDCHF = CADCHF CADCHF is moving in a downtrend forming lower highs, lower lows in 1-hour…
-
USDCAD starts to fall from the top zone of down trend
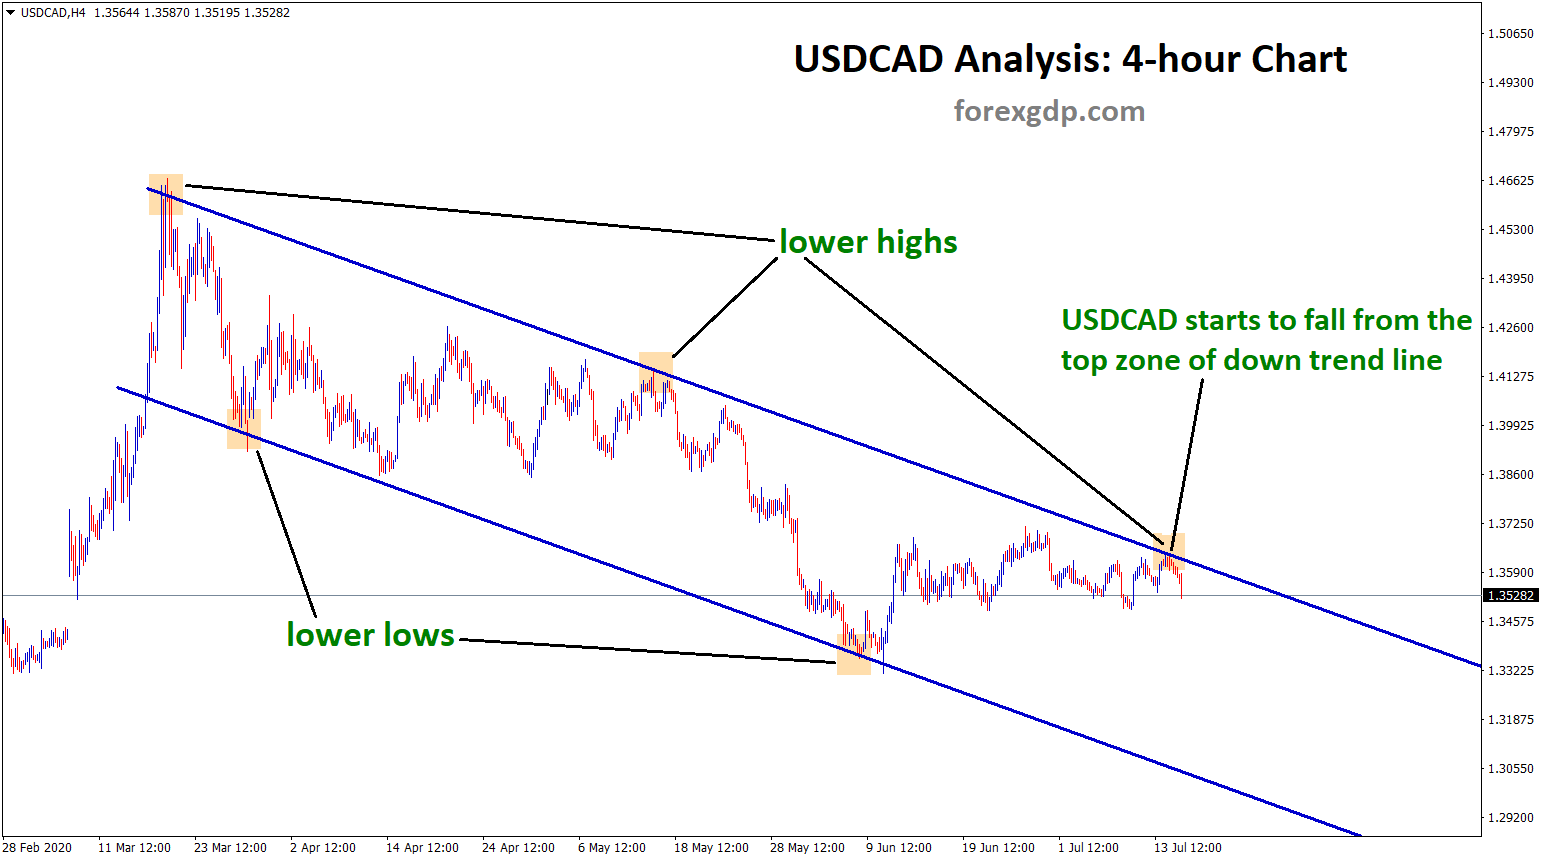
USDCAD Downtrend Analysis USDCAD is moving in a downtrend line for a long time by forming lower highs, lower lows…
-
+900 points achieved in USDCAD Sell trade
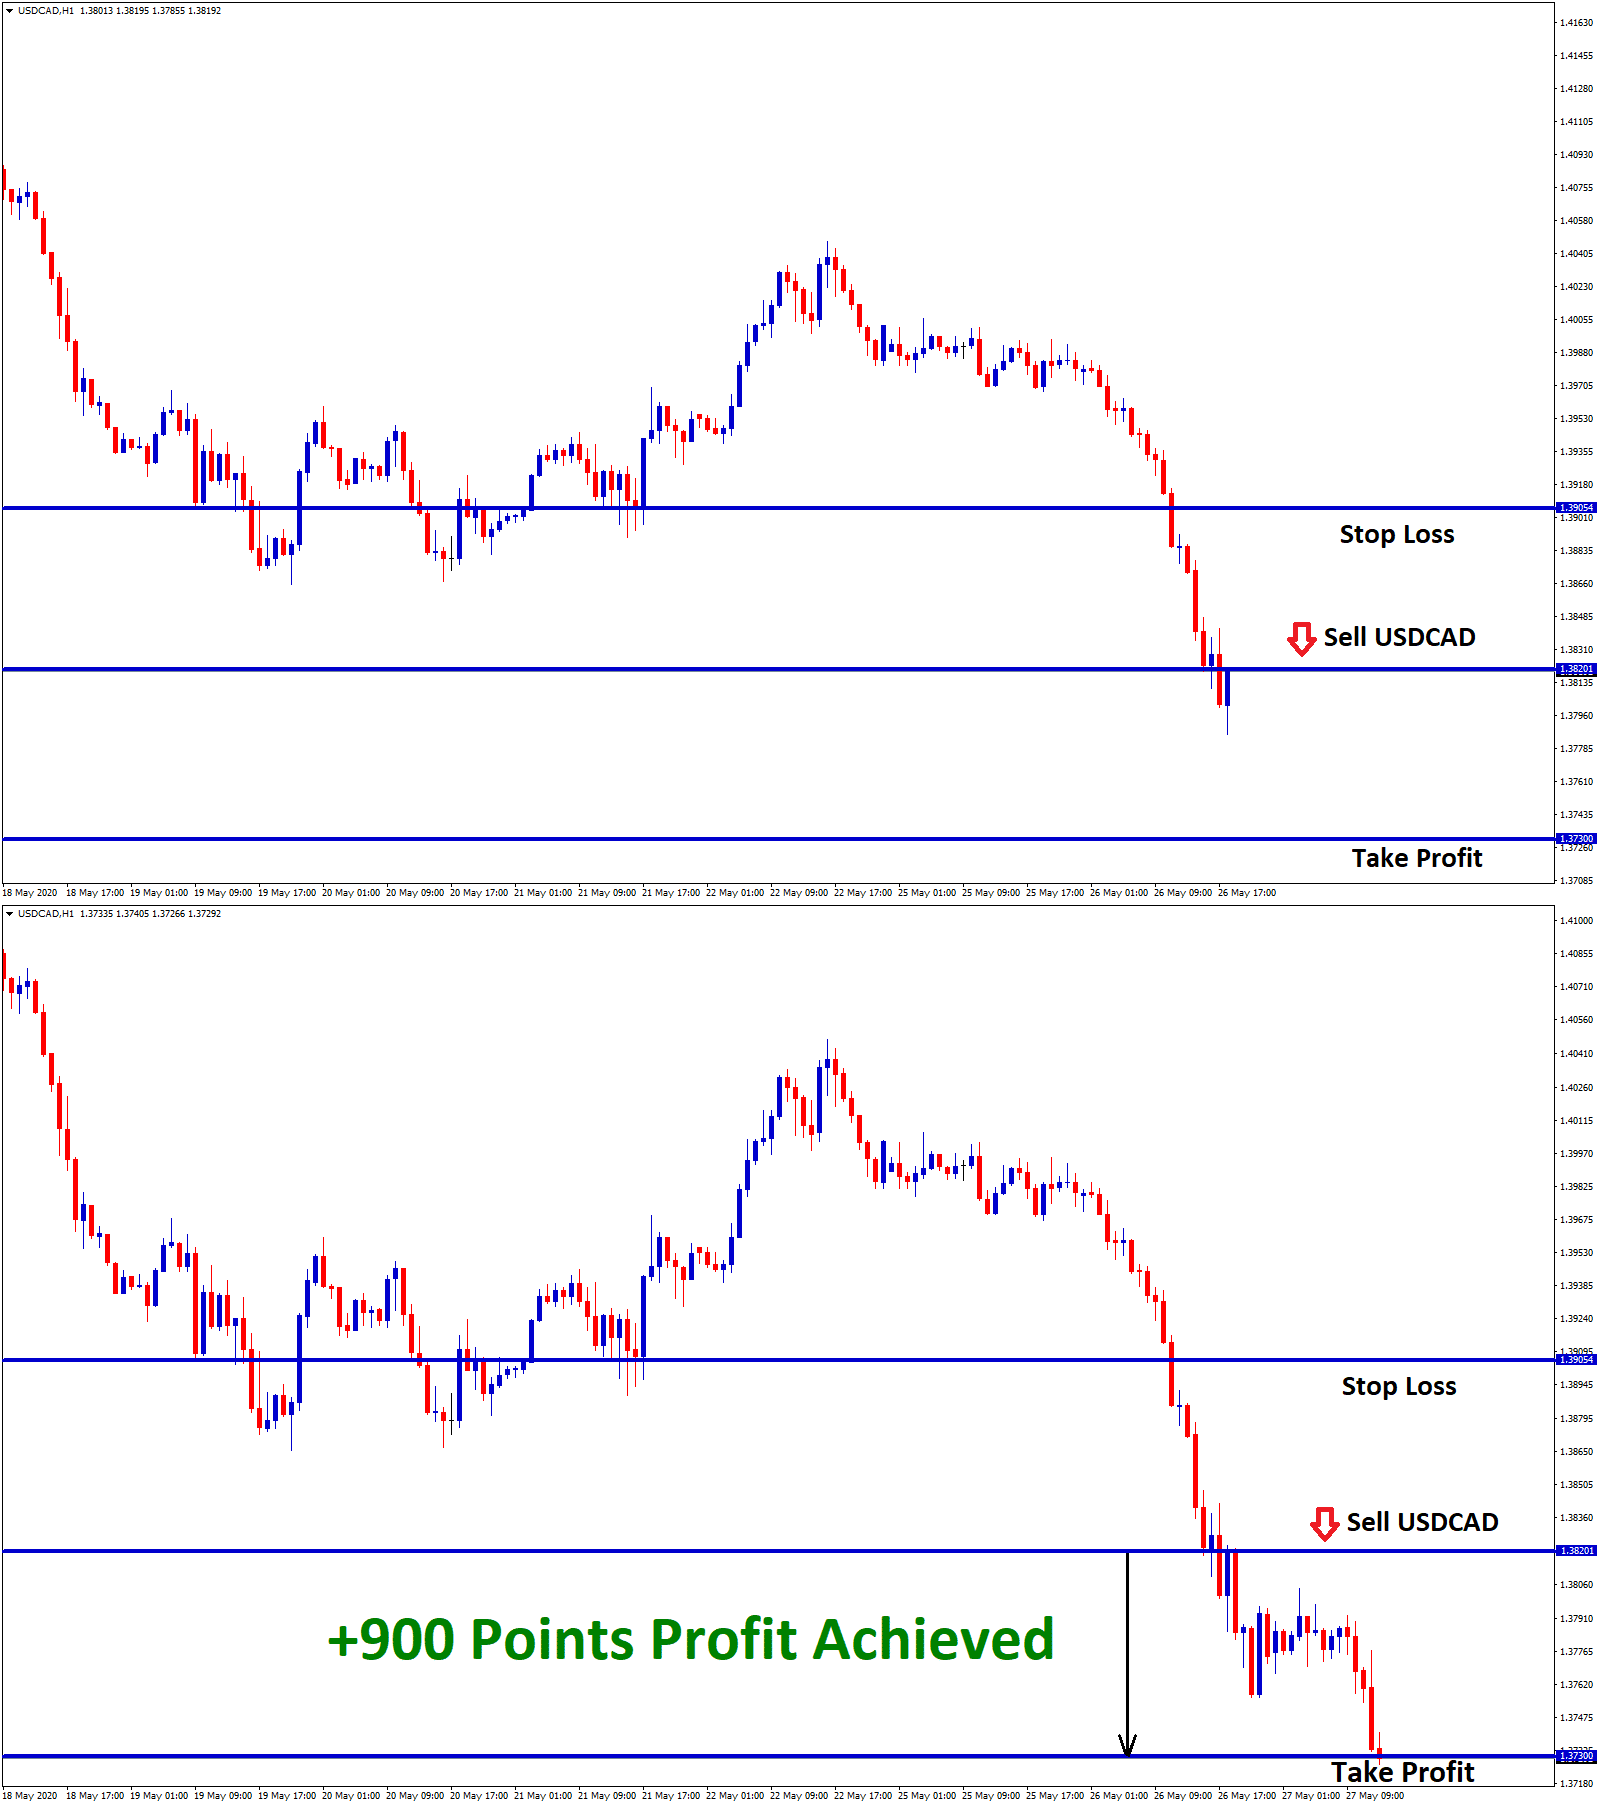
USDCAD Sell signal after Descending Triangle breakout Yesterday, we notified our users to sell USDCAD after the confirmation of breakout…
-
Descending Triangle Support broken on USDCAD 4hr chart
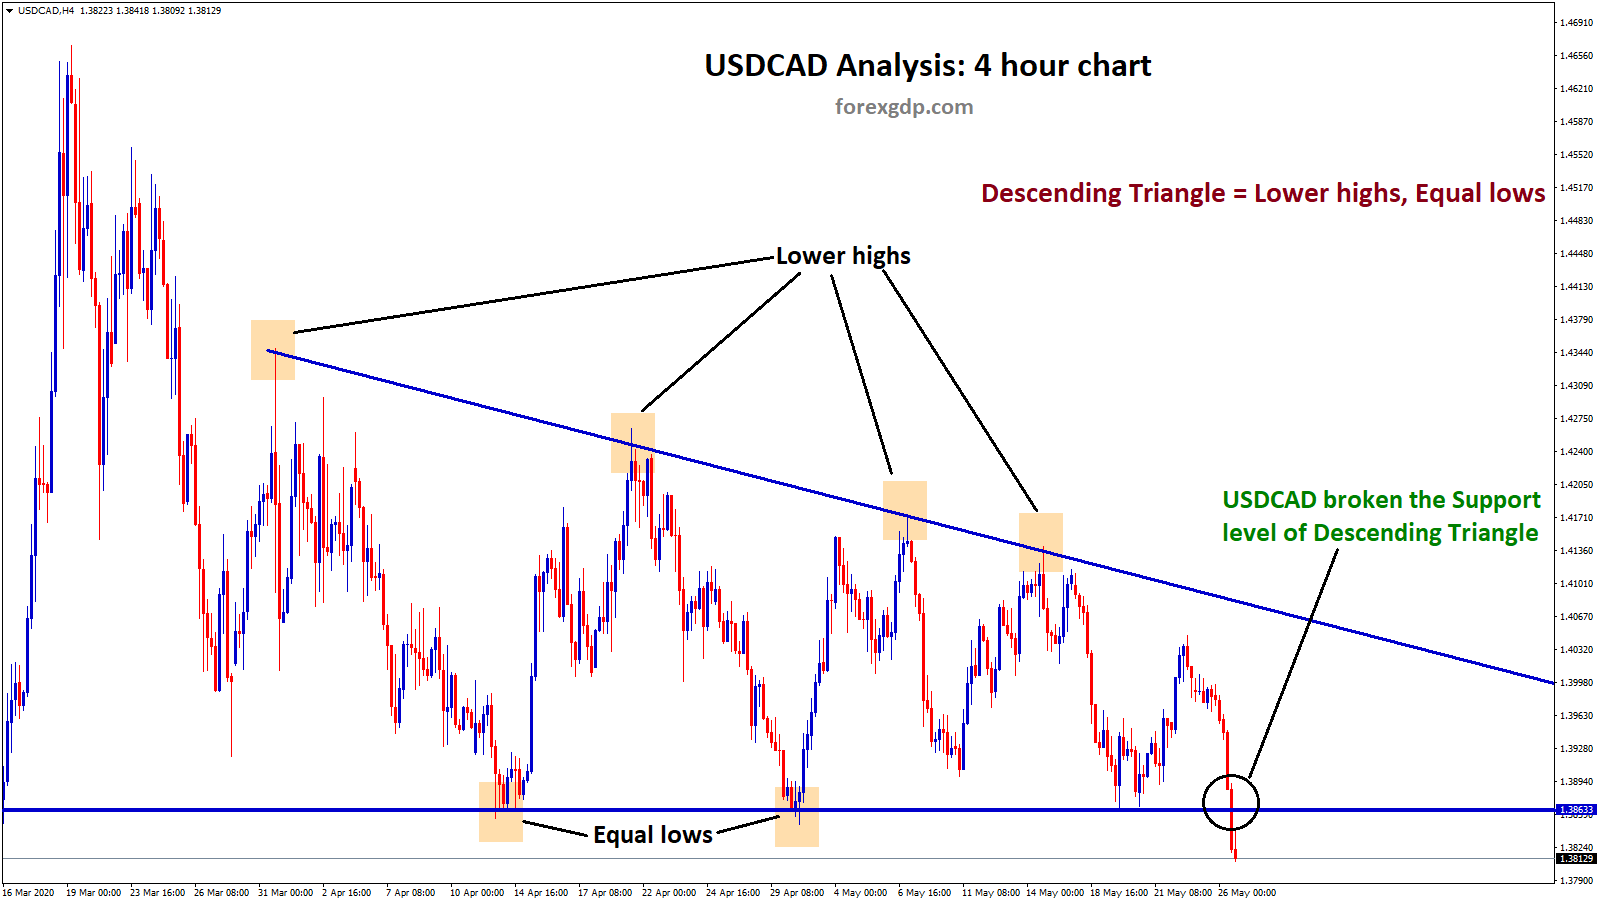
USDCAD Descending Traingle Analysis USDCAD formed lower highs, equal lows which creates a descending triangle pattern. Today, Market broken the…
-
USDCAD soared +229 pips in last 24 hours
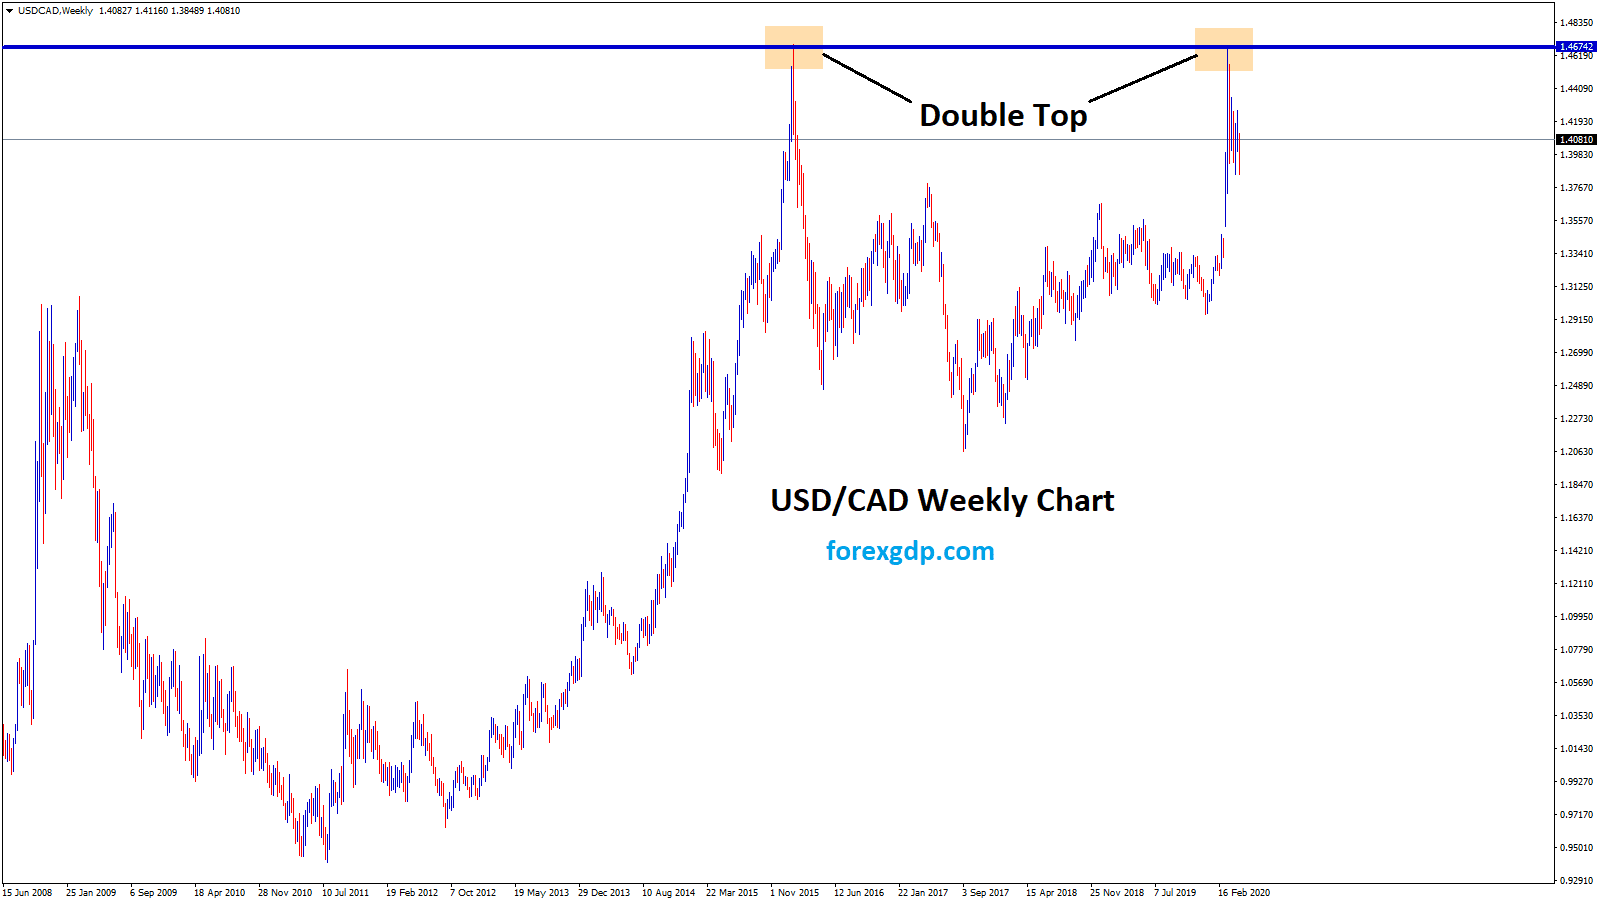
USDCAD Price forecast from the support Before 24 hours, we have updated that "USDCAD landed in the support zone" check…
-
USDCAD landed now in support zone
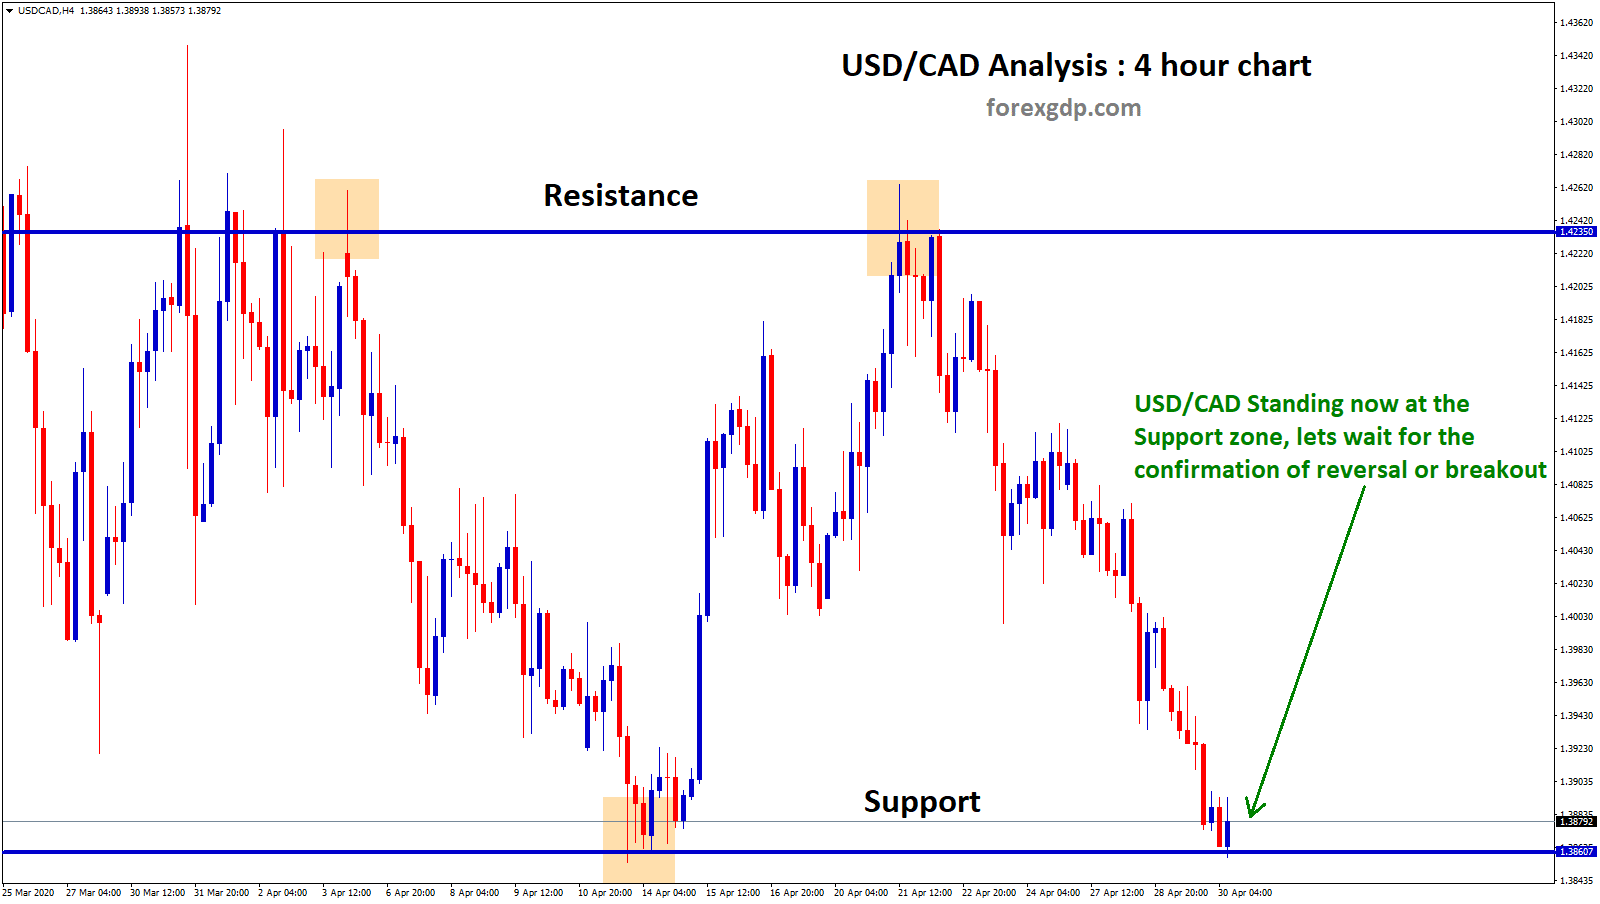
USDCAD Technical Support analysis Due to Oil price recovery, USDCAD fall down continuously and now USD CAD landed in support…
-
CAD currency getting strong due to crude oil recovery
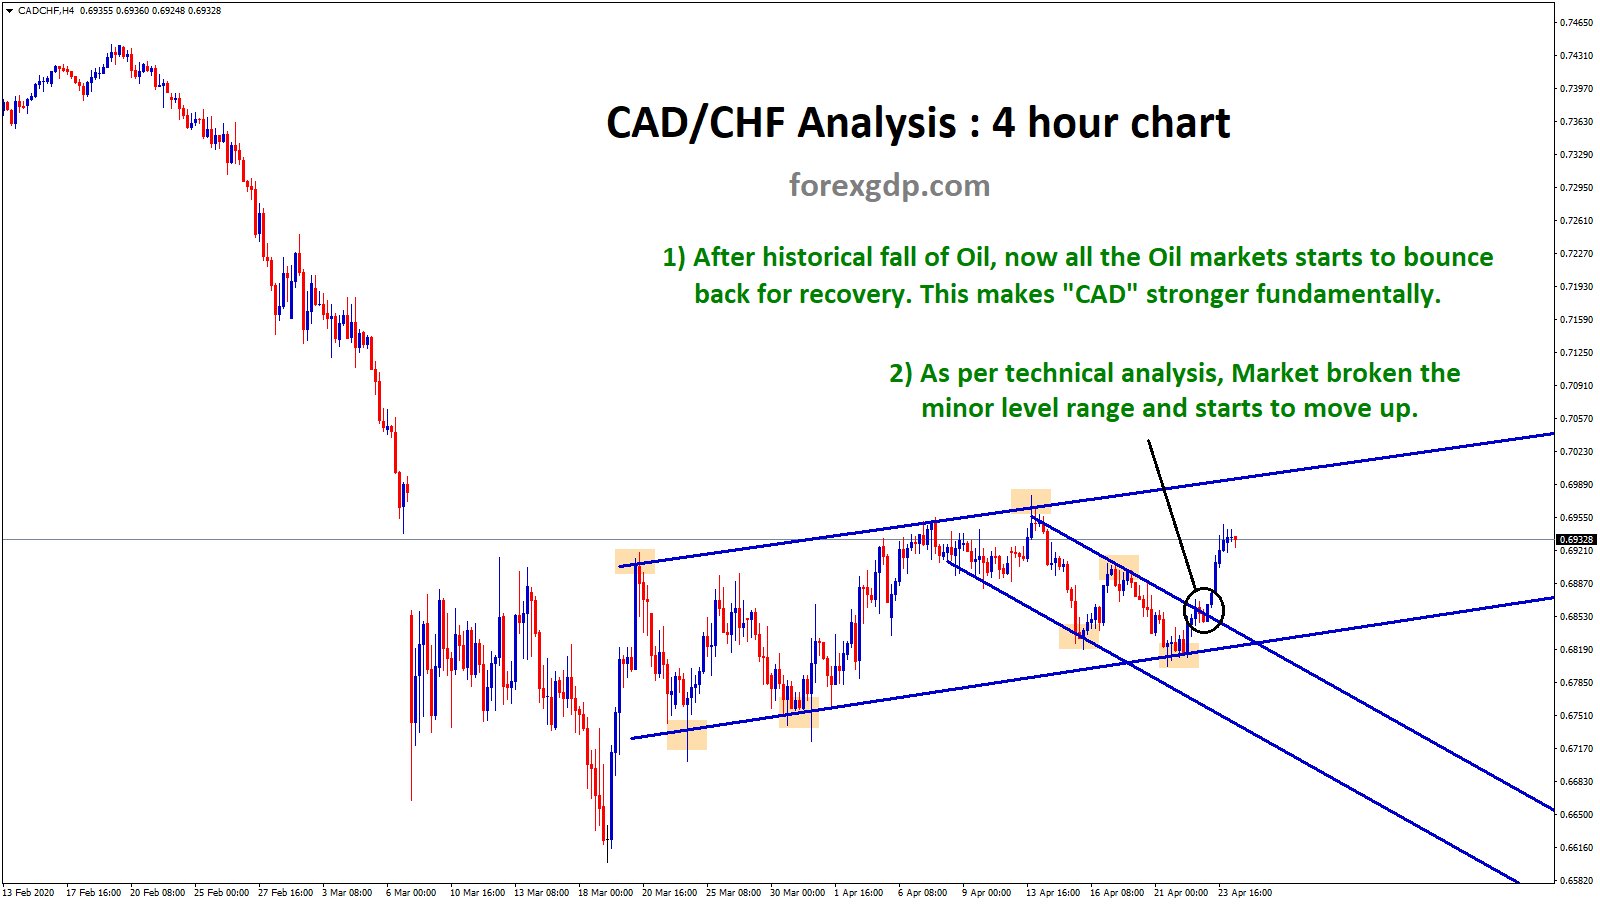
CAD Currency correlation analysis with Crude Oil markets After historical fall of Oil, now all the Crude oil markets starts…
-
USD/CAD touched both Downtrend and Horizontal Tops
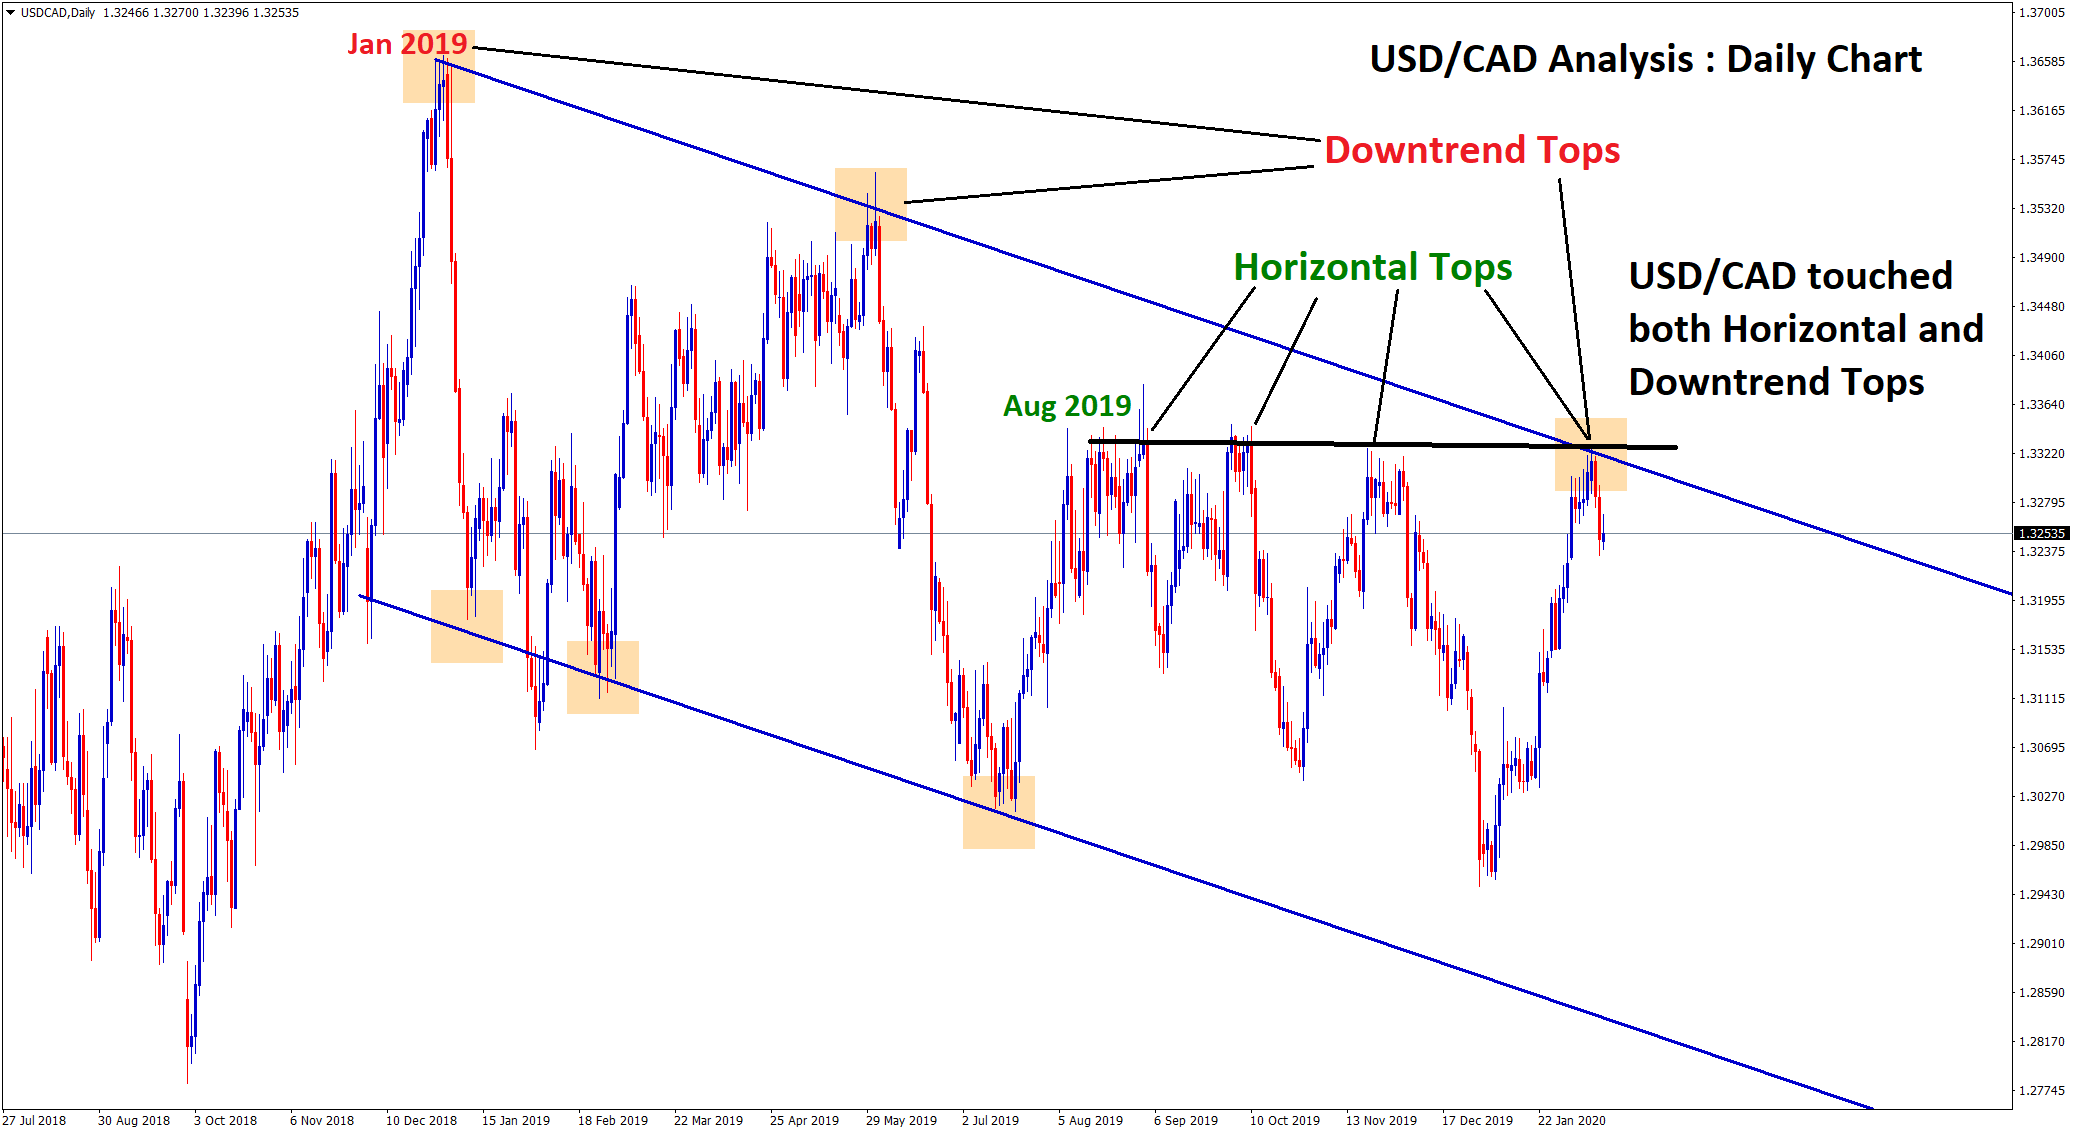
USD/CAD is moving in a downtrend from Jan 2019, now it has reached the top level for 3rd time. Since…
-
+700 Points Profit Reached in USD/CAD Buy Signal
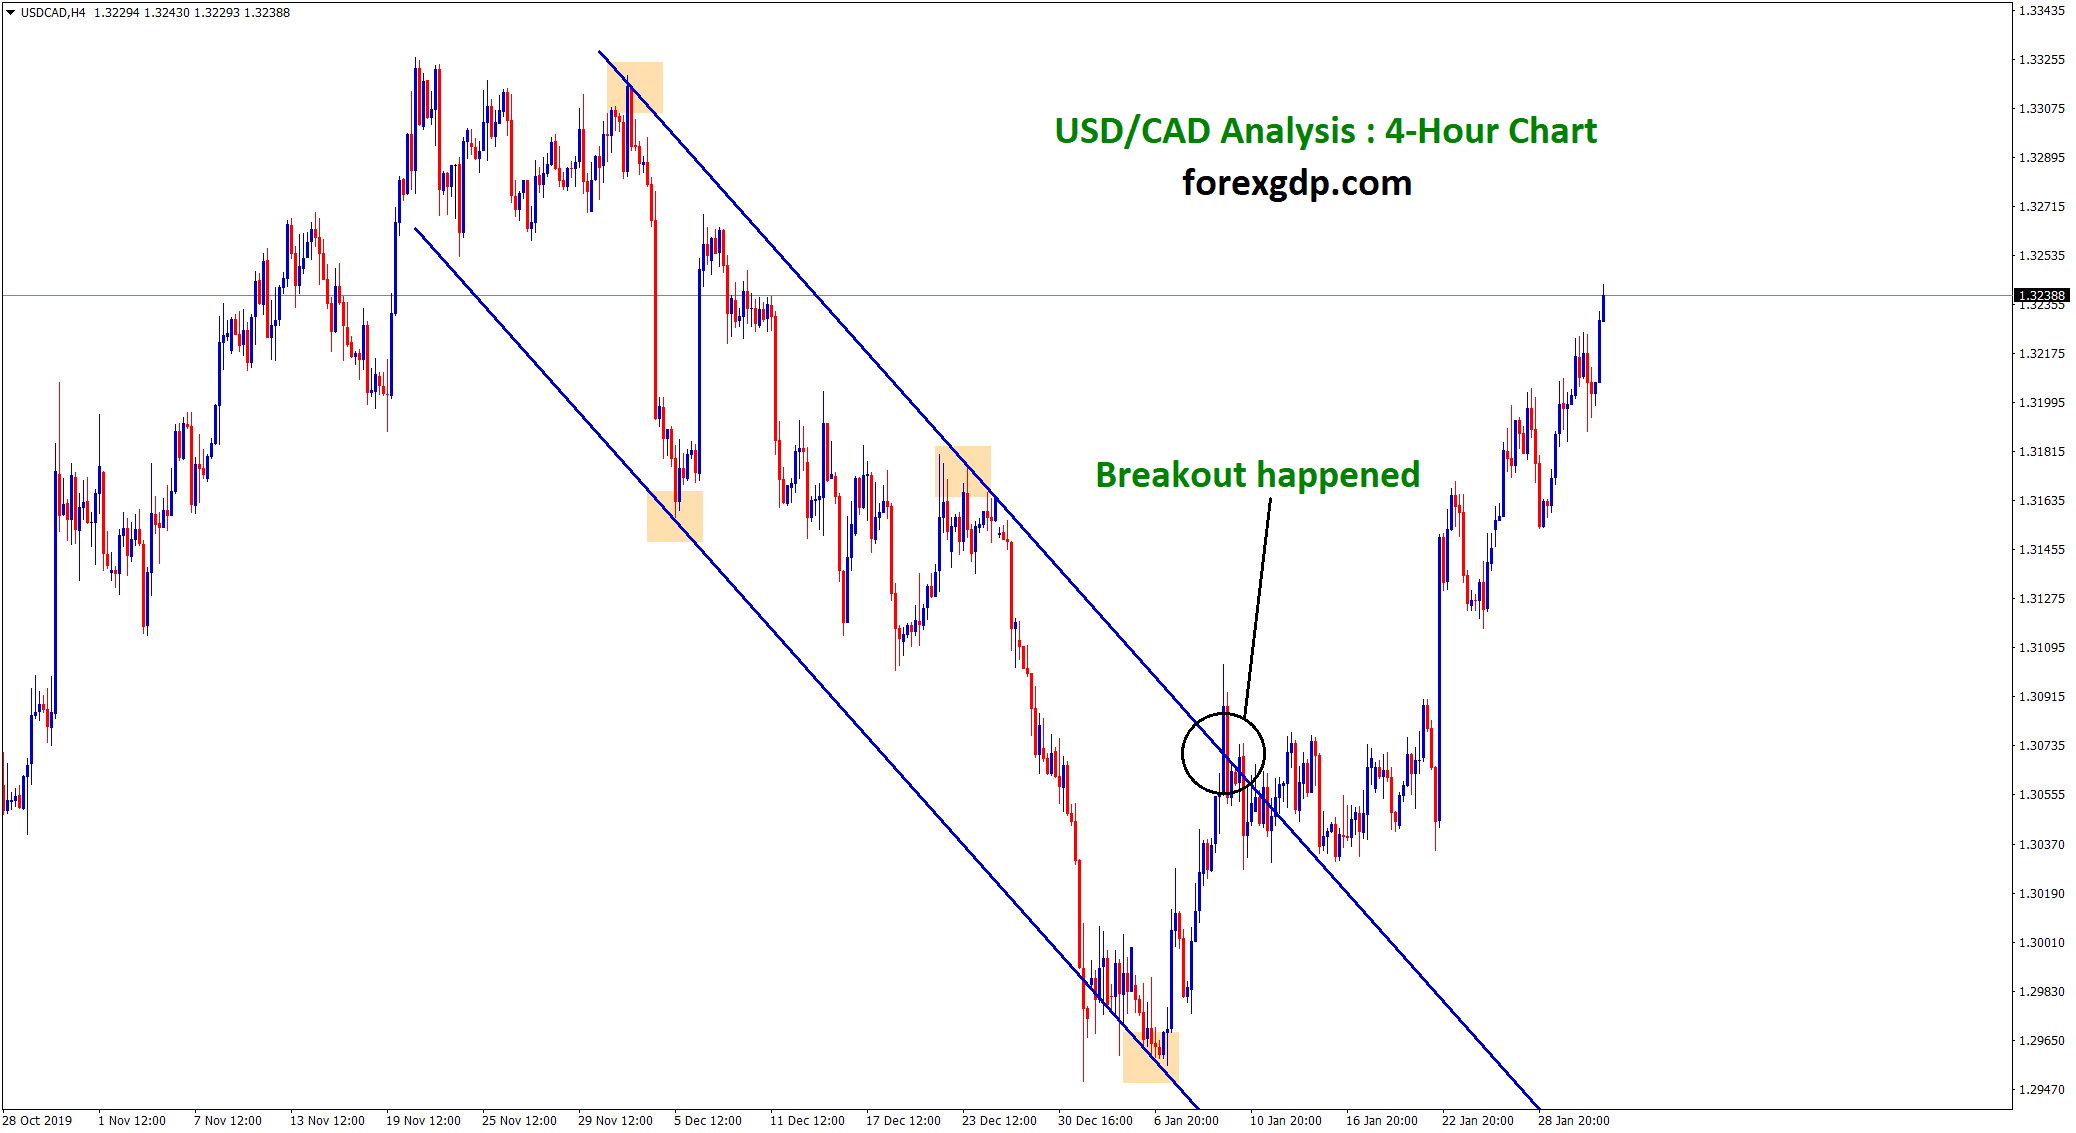
USD/CAD Analysis : In 4-hour chart, Breakout happened at the downtrend range and market starts to move up. In 30…
-
+1385 Points Reached in USD/CAD Buy Signal
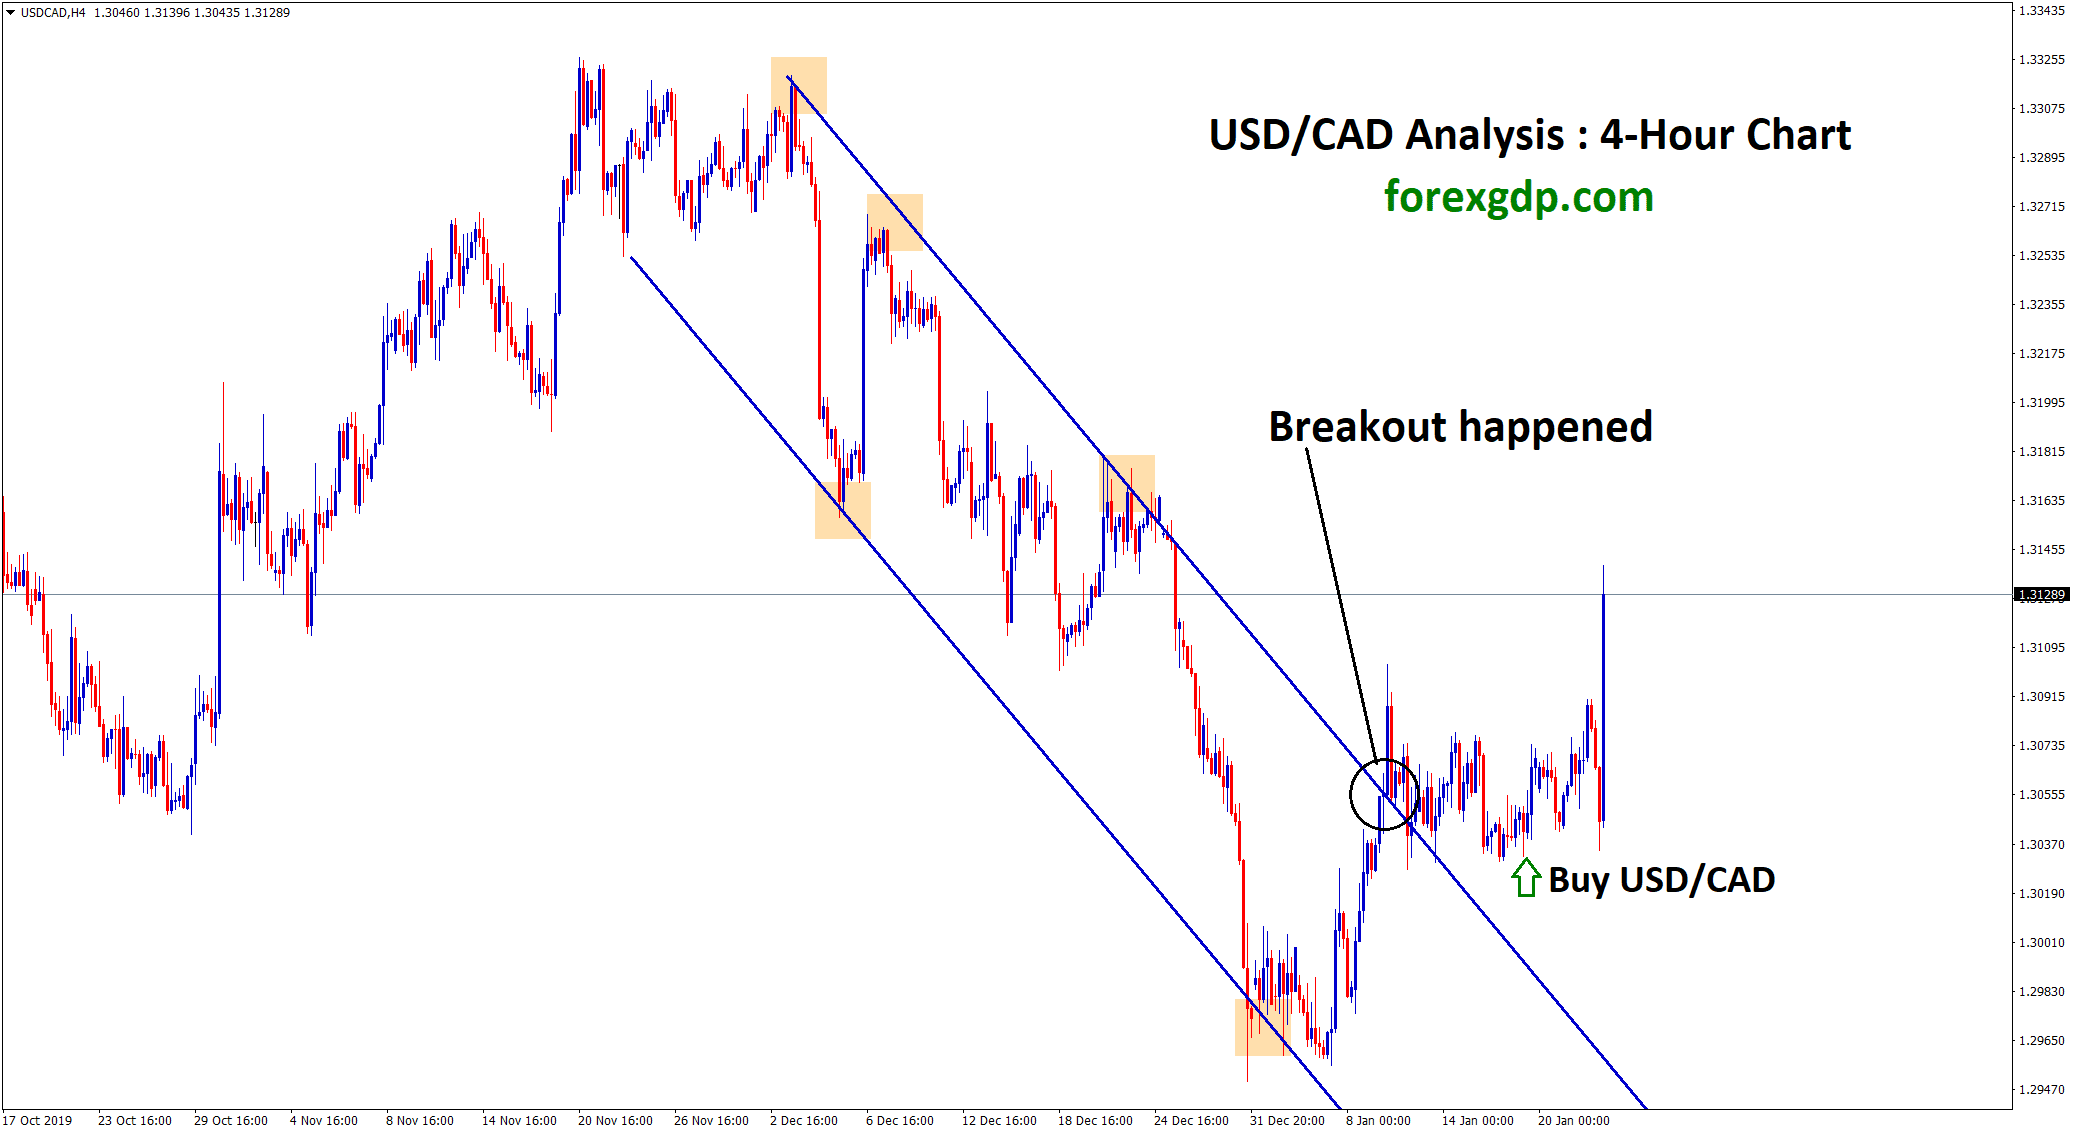
USD/CAD Analysis : USD/CAD broken the top zone of the downtrend range. After the confirmation of breakout. we wait for…
-
+685 Points Reached in USD/CAD Buy Signal

USD/CAD Analysis : USD/CAD broken the top zone of the downtrend range. After the confirmation of breakout. we wait for…
