usdchf short term
-
+600 Points reached after USDCHF reversed from the higher low
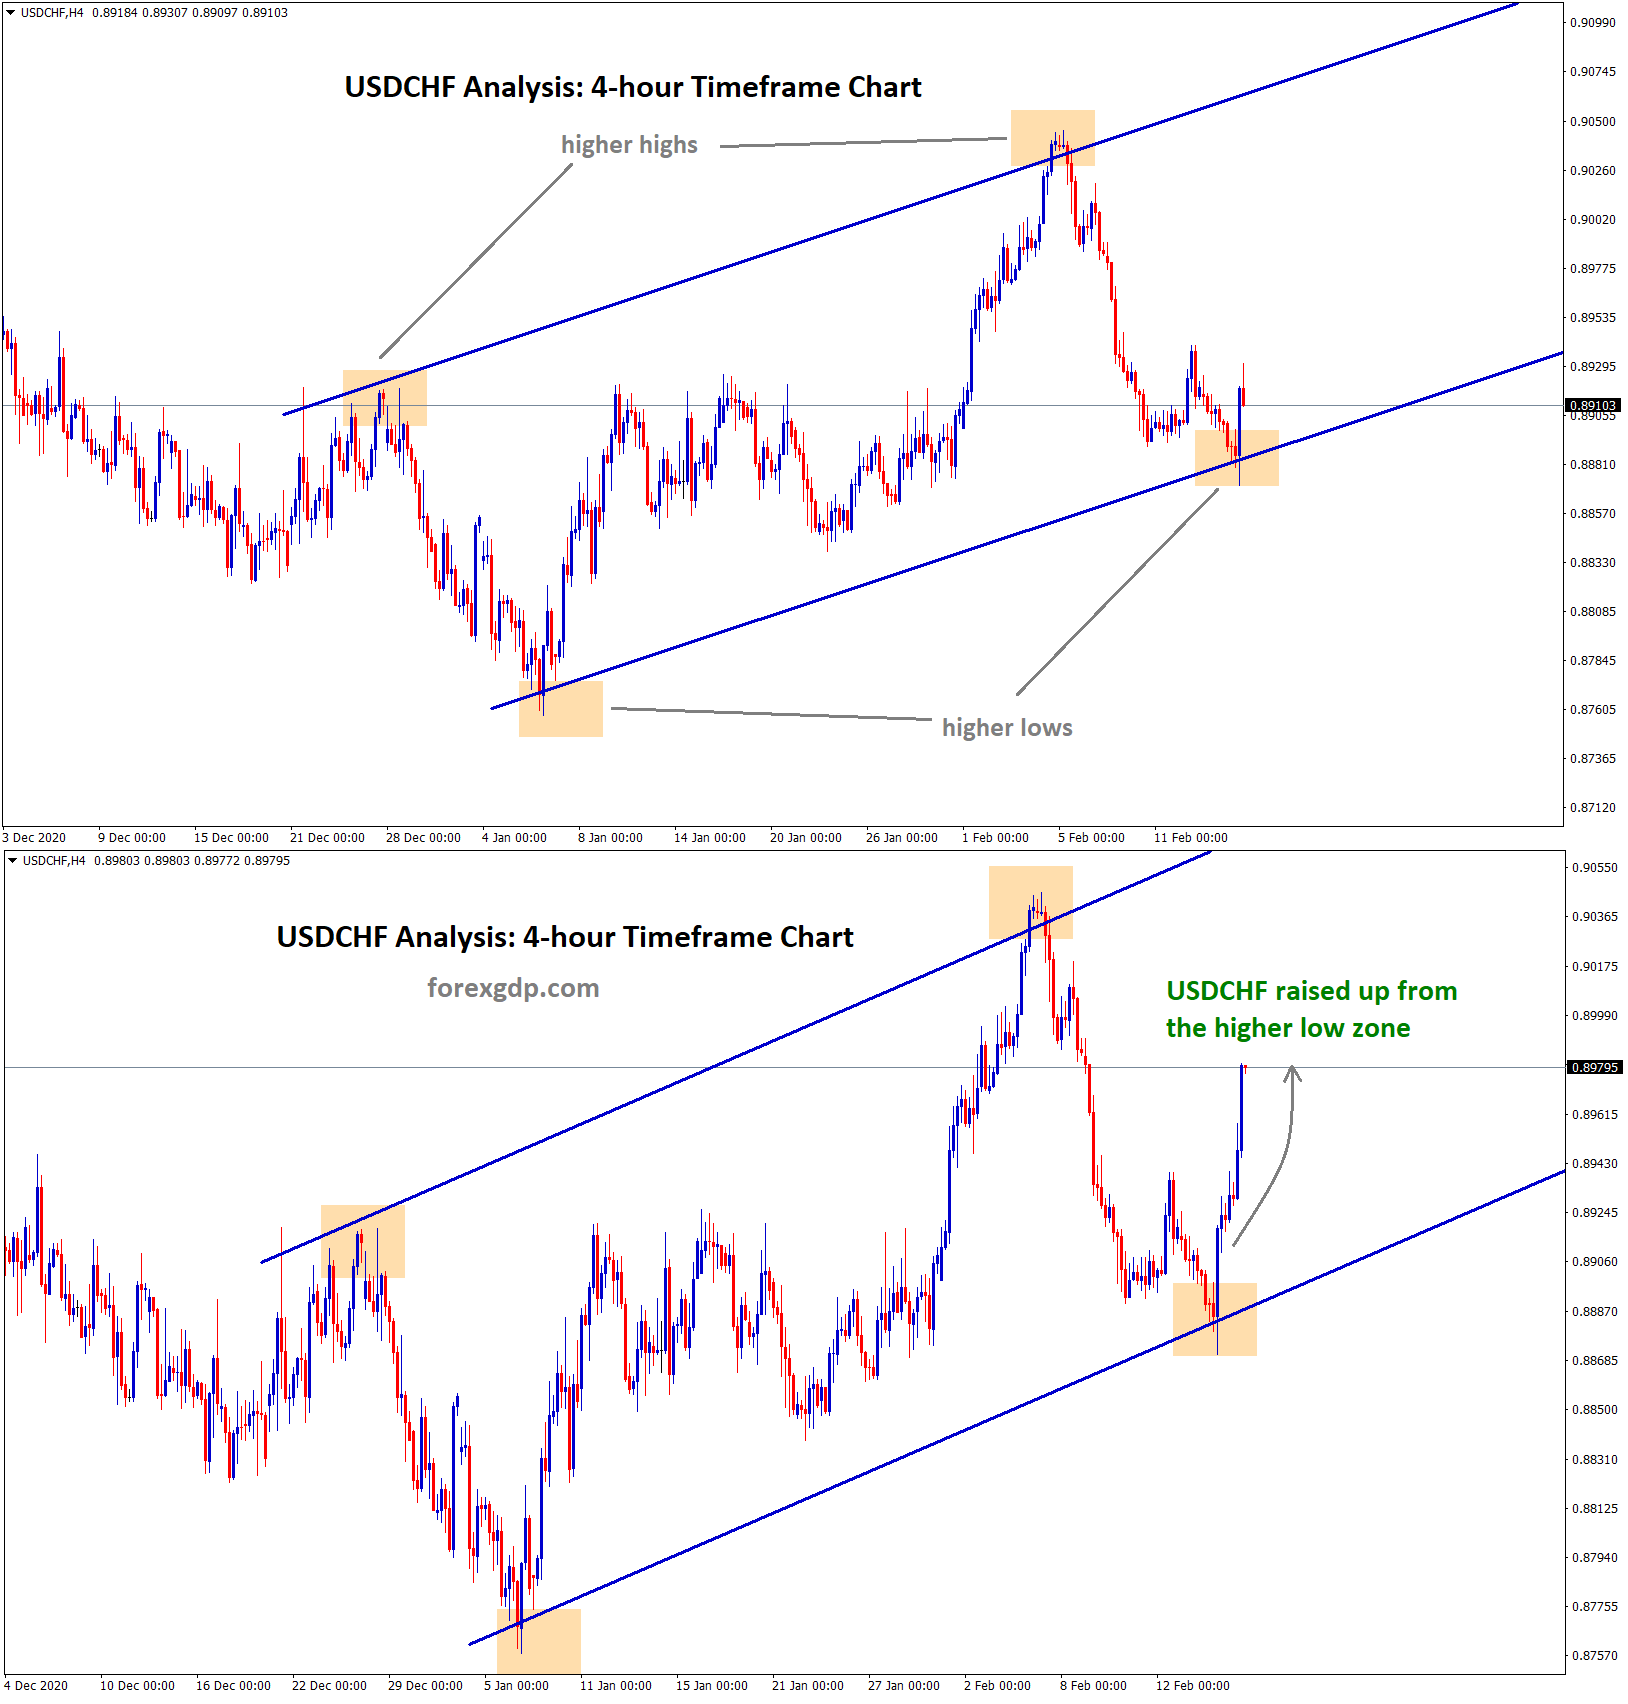
USDCHF Analysis USDCHF is moving in an uptrend range by forming higher highs and higher lows in the 4-hour Timeframe…
-
USDCHF is going to reach the higher low zone, wait for breakout or reversal
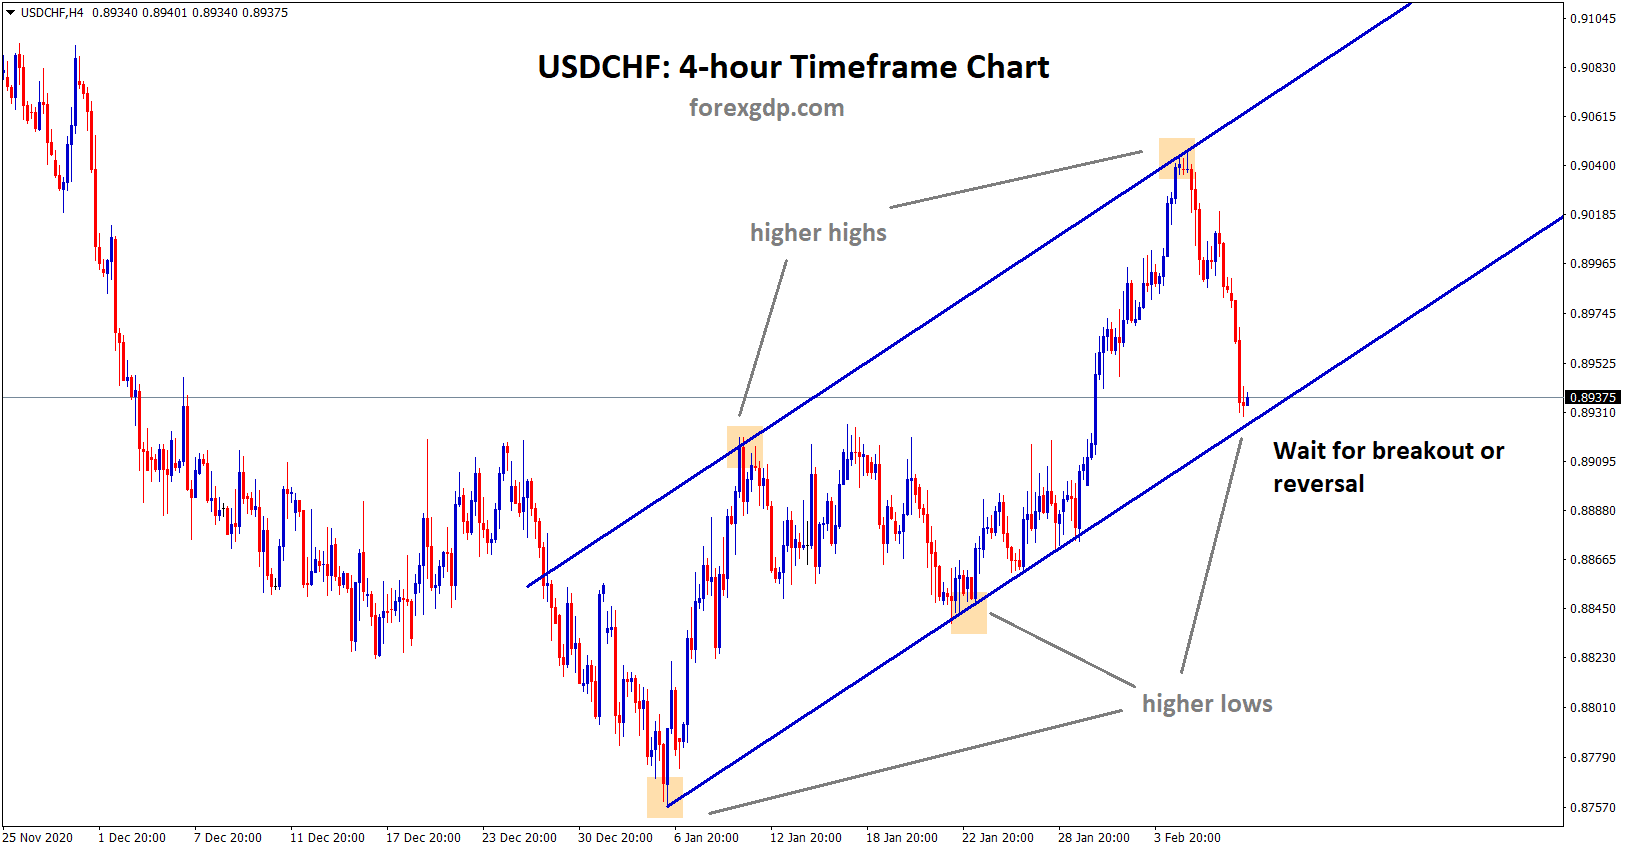
USDCHF Analysis USDCHF is moving in an Ascending channel by forming higher highs and higher lows in the 4-hour timeframe…
-
+630 Points reached in USDCHF Buy signal after triangle breakout
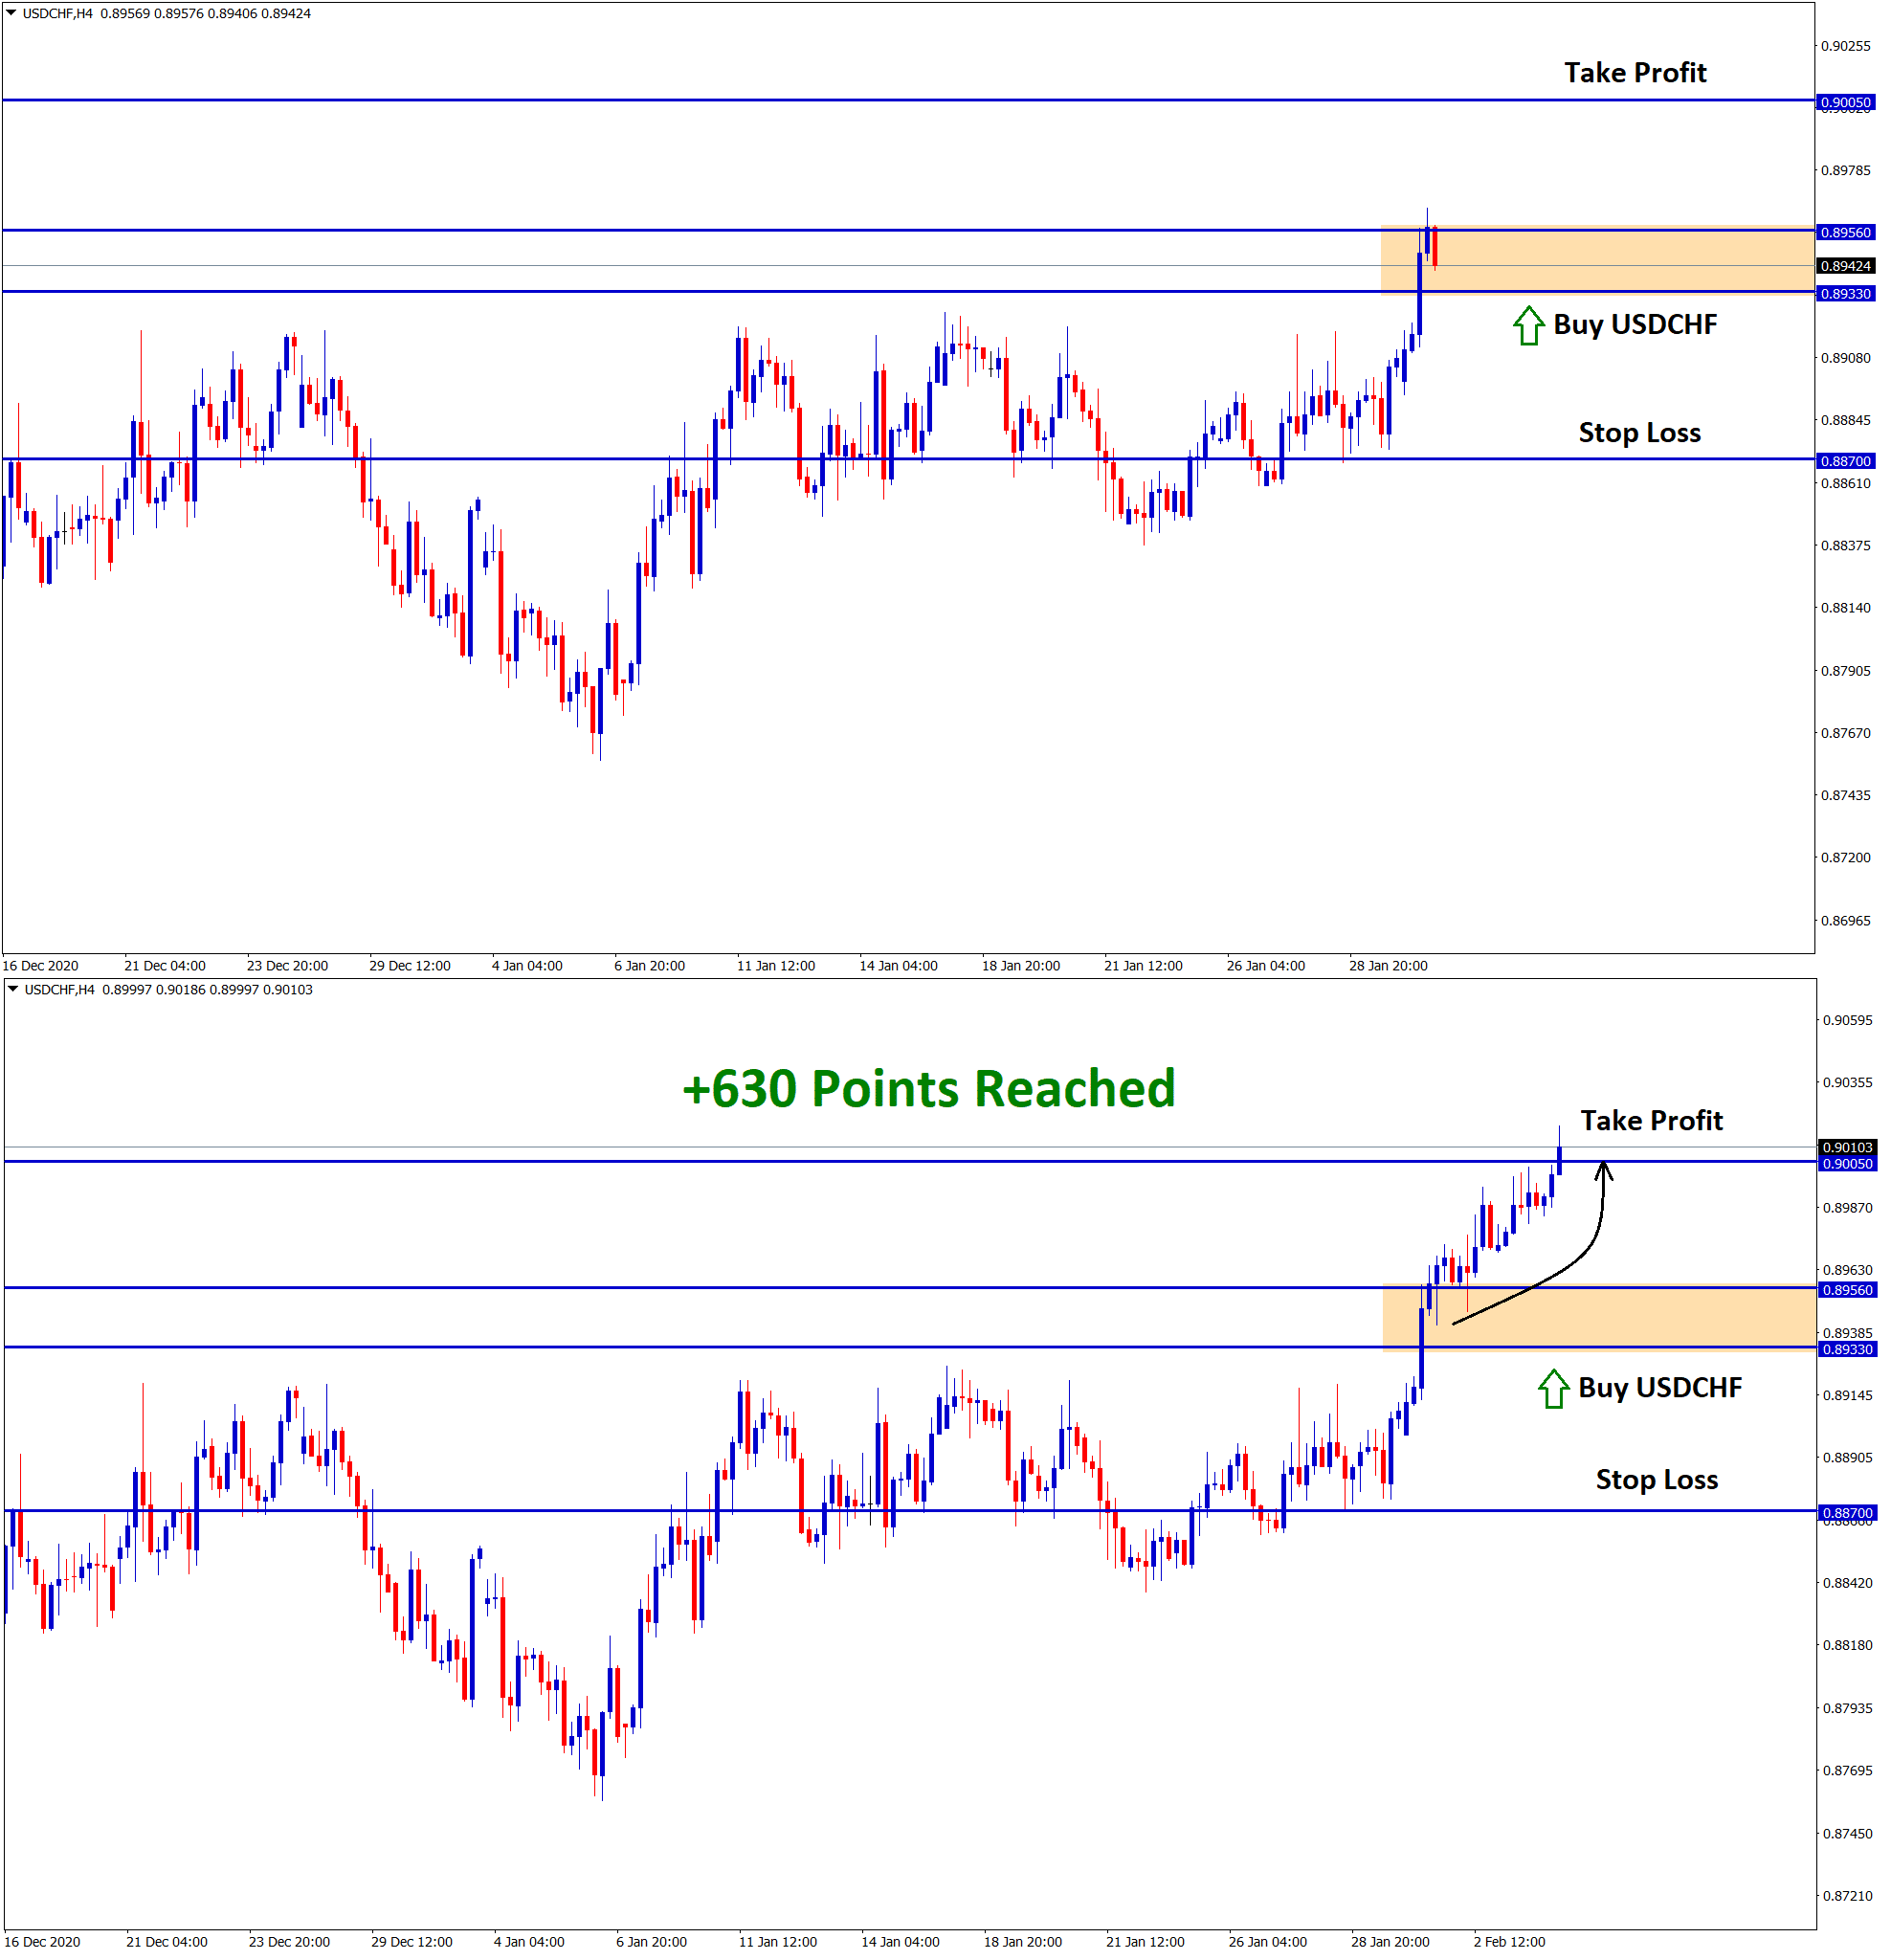
USDCHF Analysis On previous week, we recommend our users to wait for the breakout of this Ascending triangle pattern in…
-
Ascending Triangle Pattern going to break soon on USDCHF
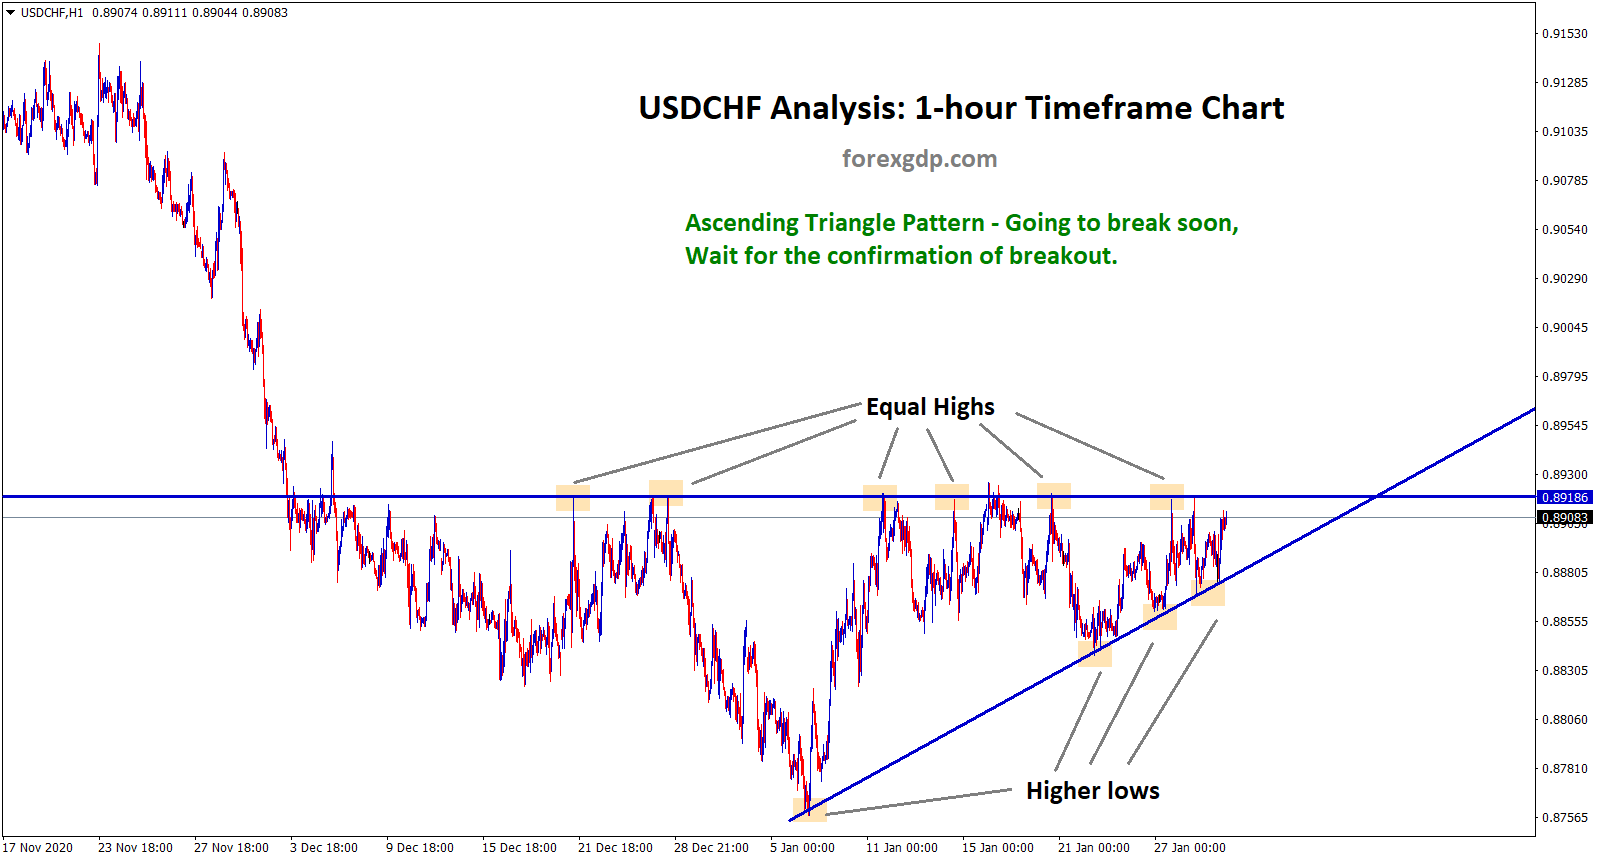
USDCHF Ascending Triangle Breakout Ascending Triangle pattern has formed in the USDCHF by creating Equal highs and higher lows. USDCHF…
-
+670 Points Reached in USDCHF Buy signal
USDCHF Analysis USDCHF has broken the top level of the downtrend range. After the breakout, the USDCHF has retested the…
-
USDCHF bouncing up from the broken level
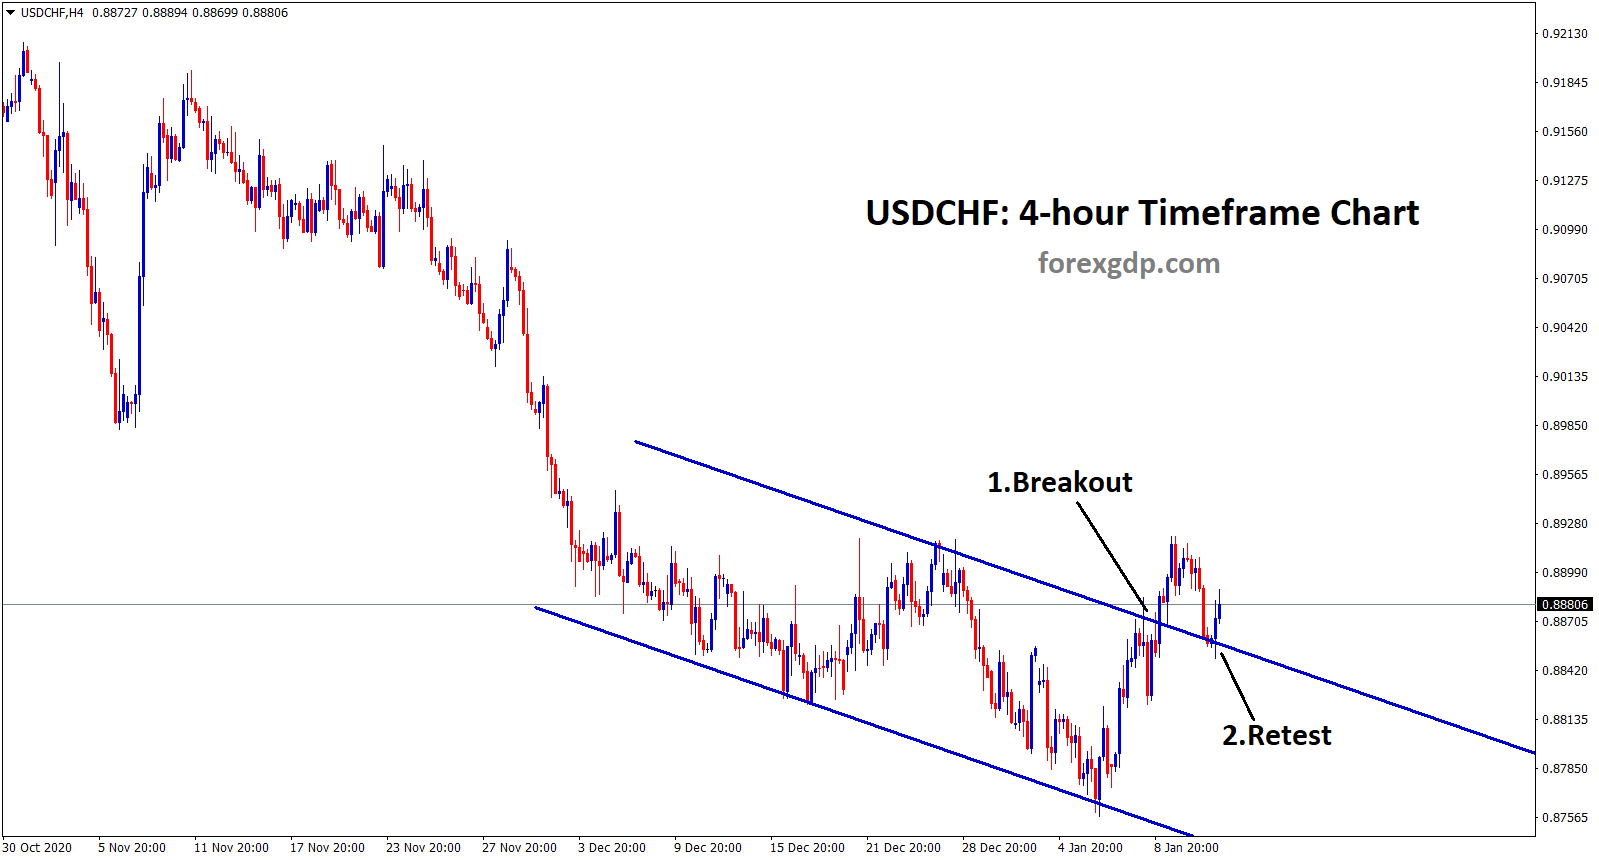
USDCHF Analysis USDCHF has broken the top level of the downtrend range. After the breakout, the USDCHF has retested the…
-
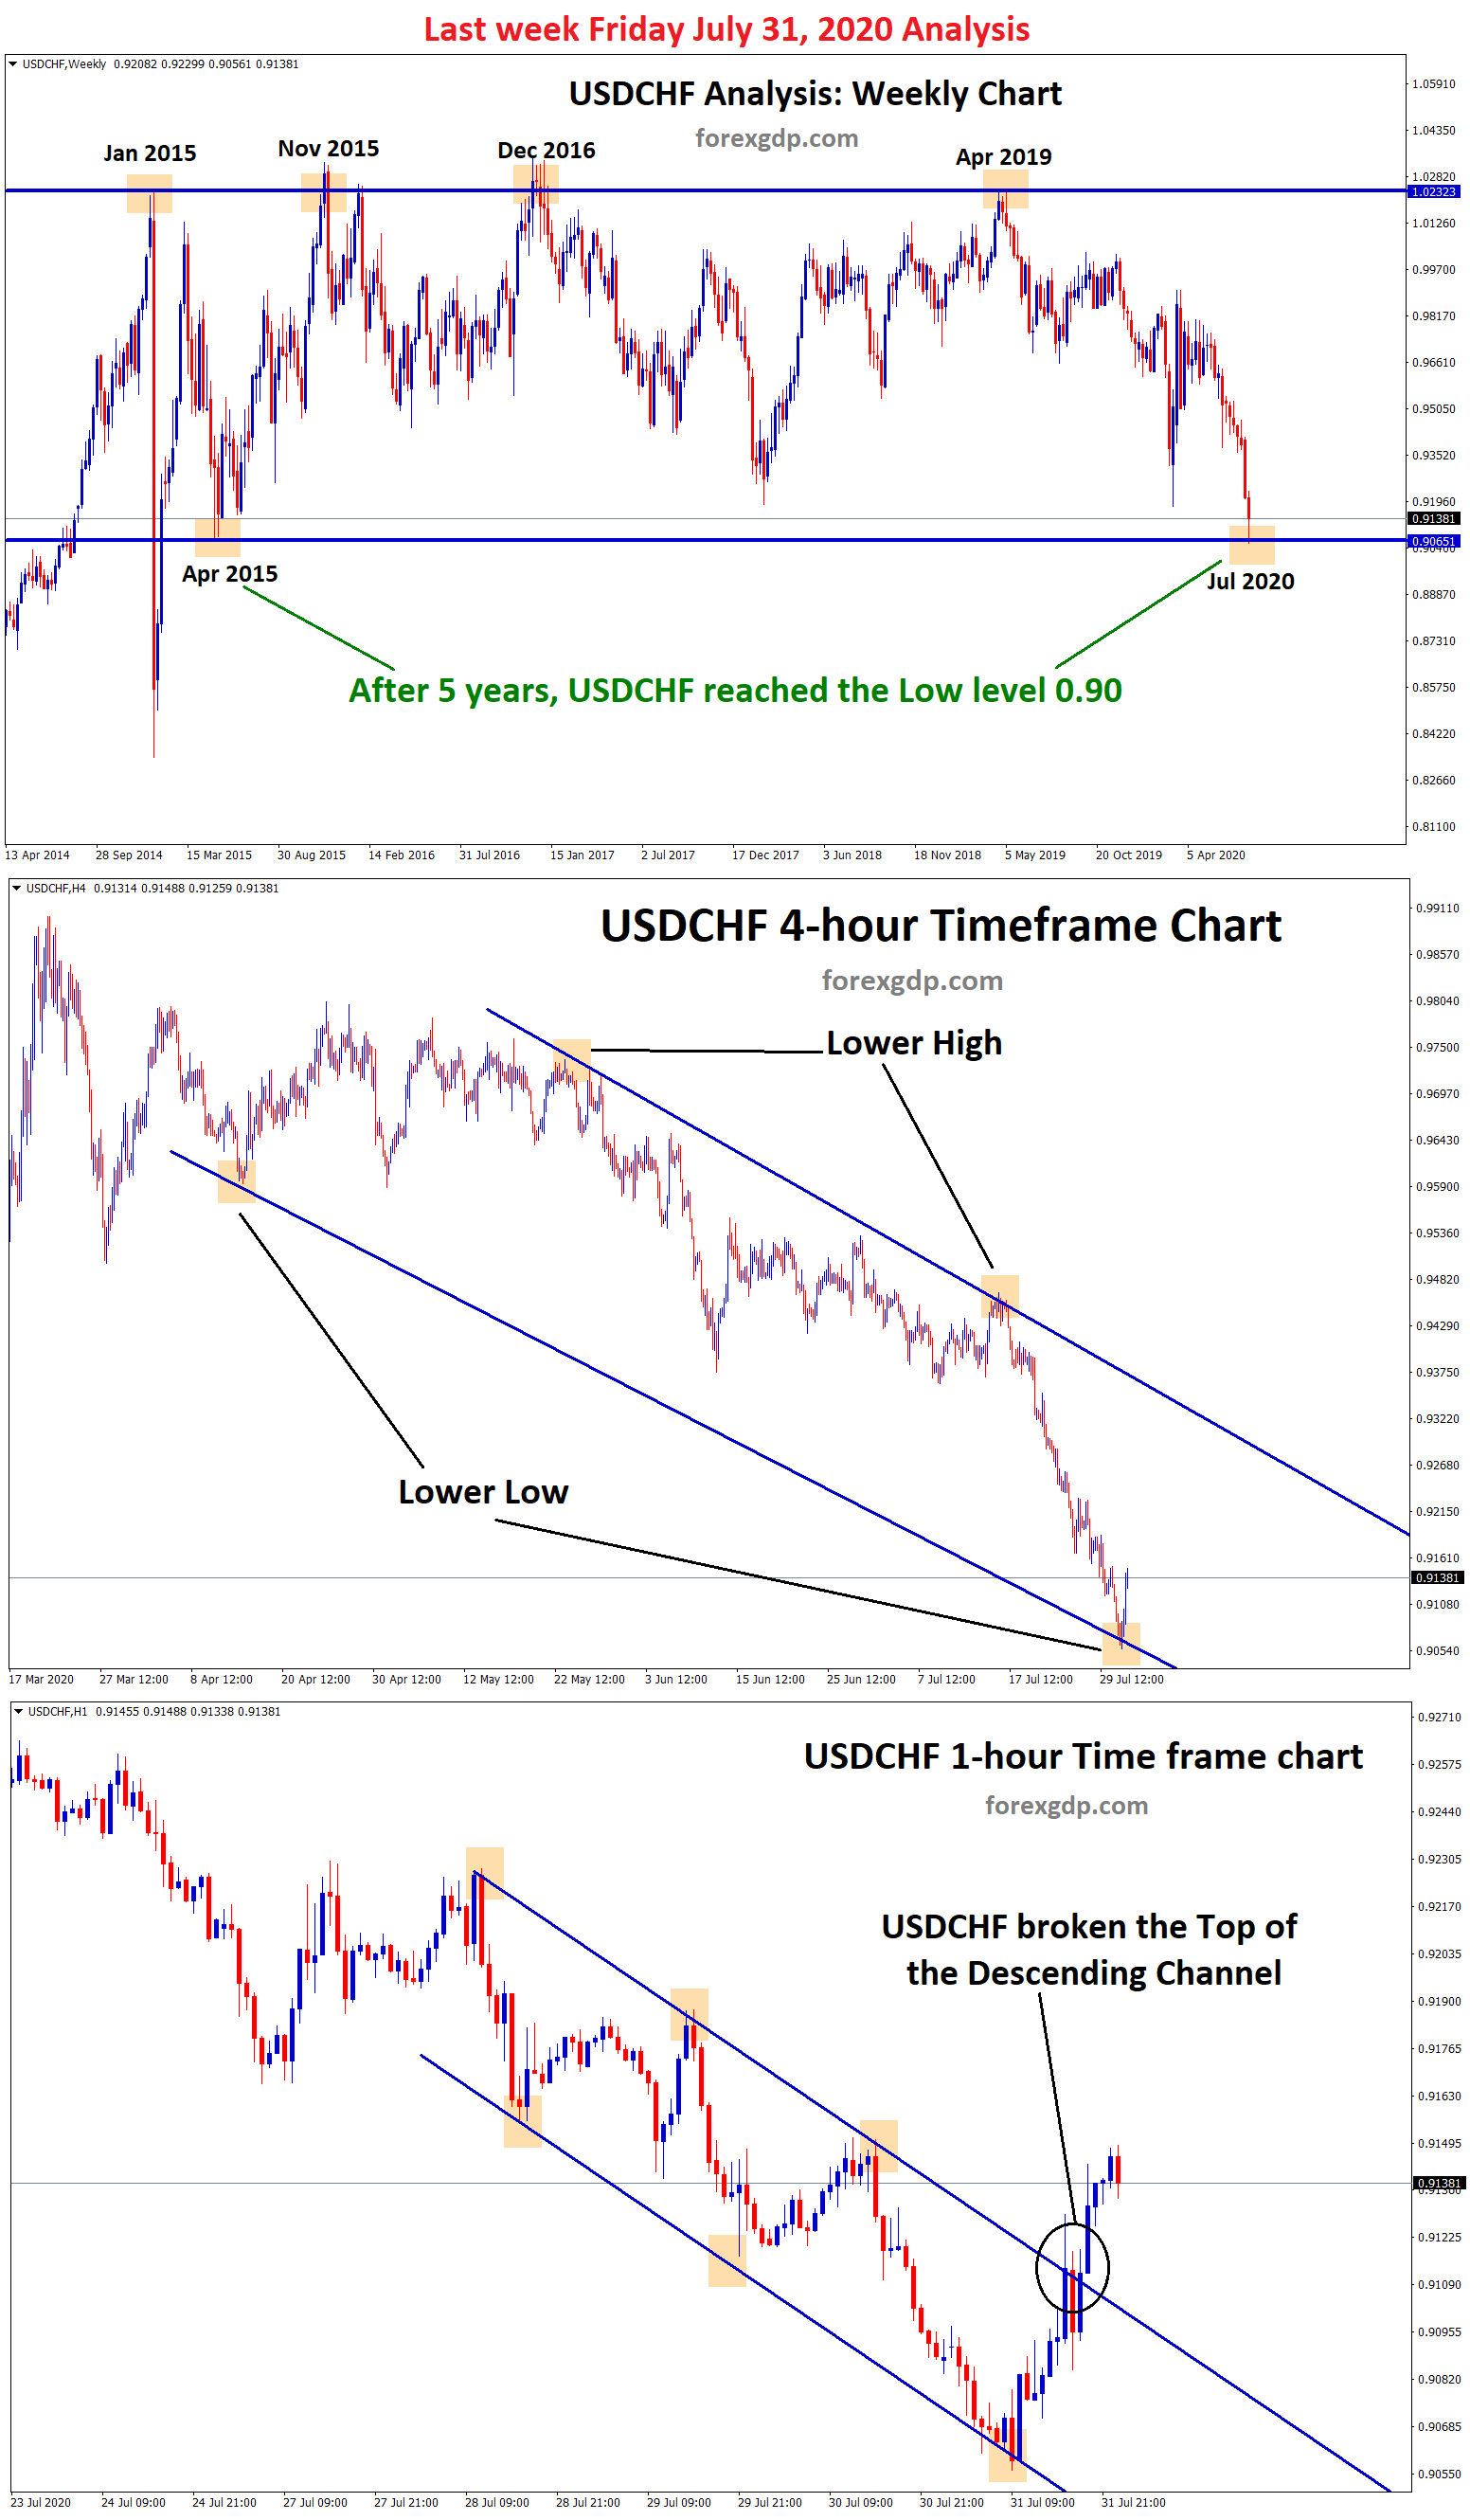
+495 Points Achieved in USDCHF after breaking the top level
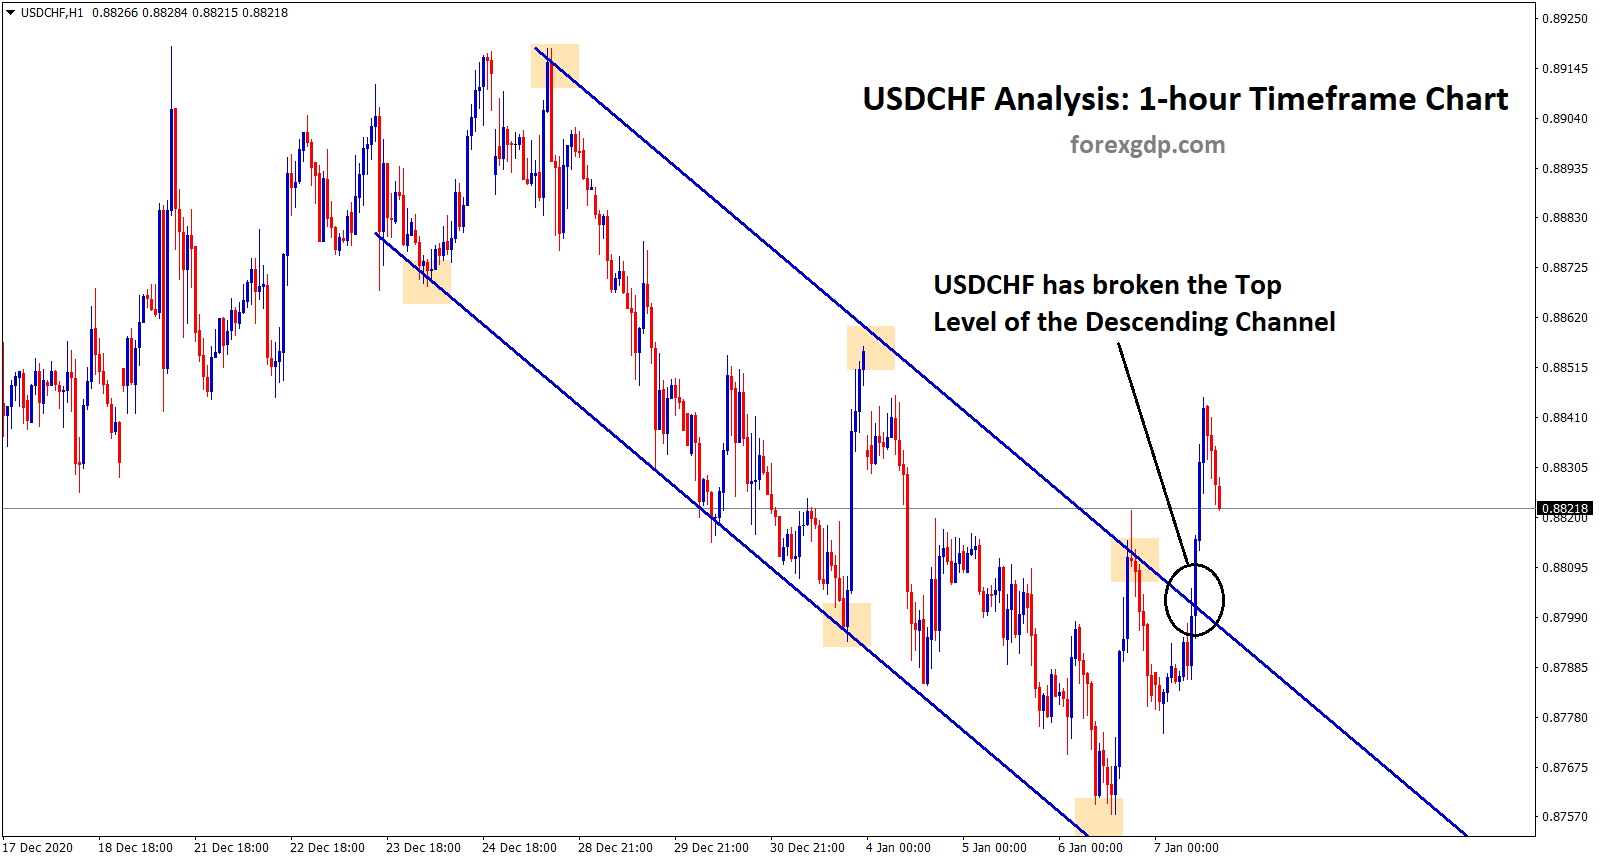
USDCHF Buy Analysis USDCHF has broken the top level of the descending channel in the 1-hour timeframe chart. In the…
-
USDCHF achieved 550 points after breaking the top channel
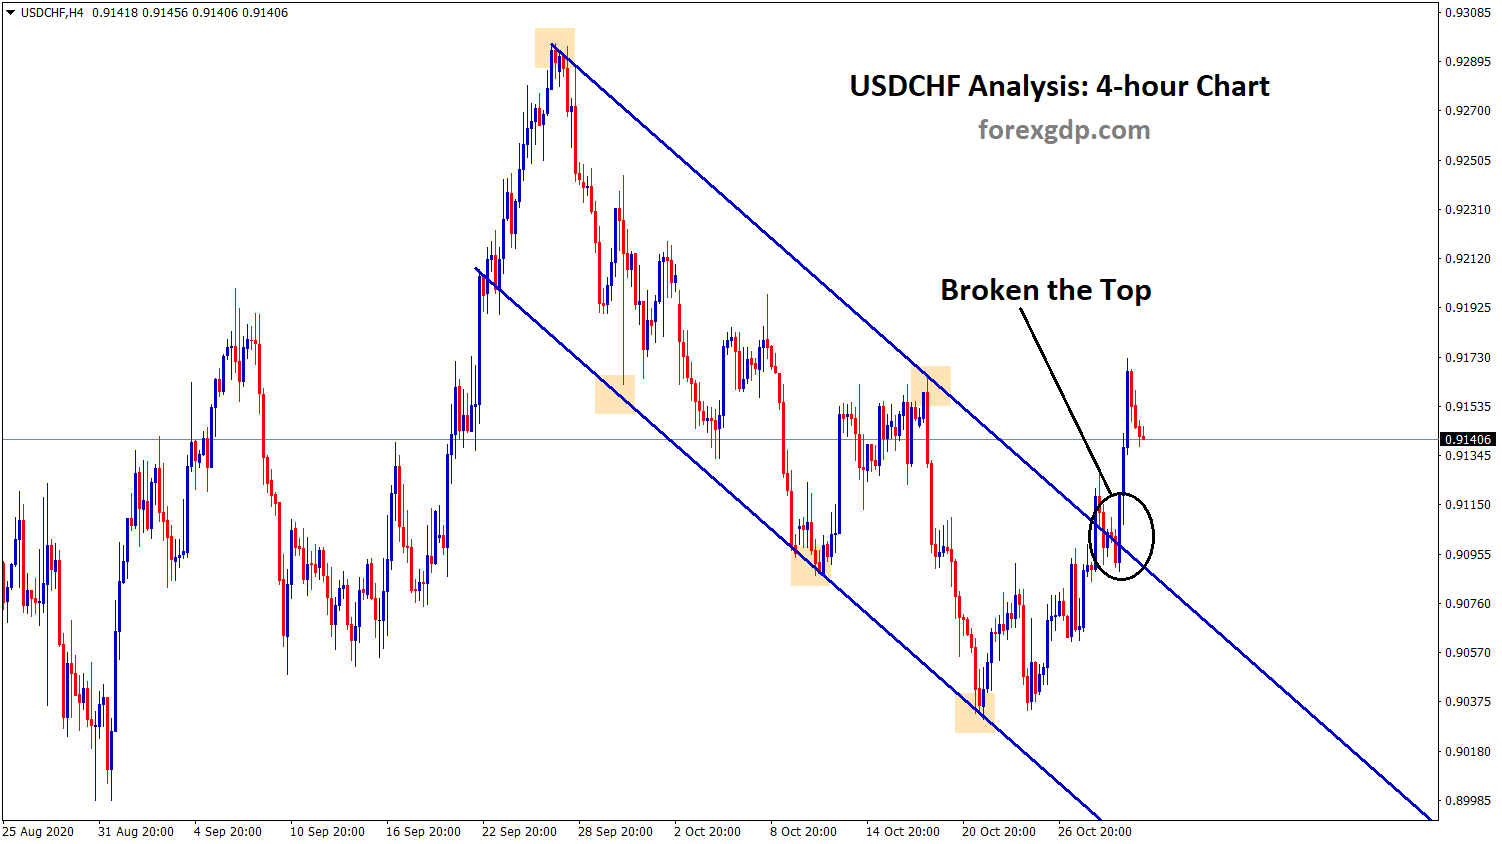
USDCHF Analysis USDCHF has broken the top zone of the Descending channel in the 4-hour timeframe chart. After the confirmation…
-
USDCHF reached +485 points after descending triangle breakout
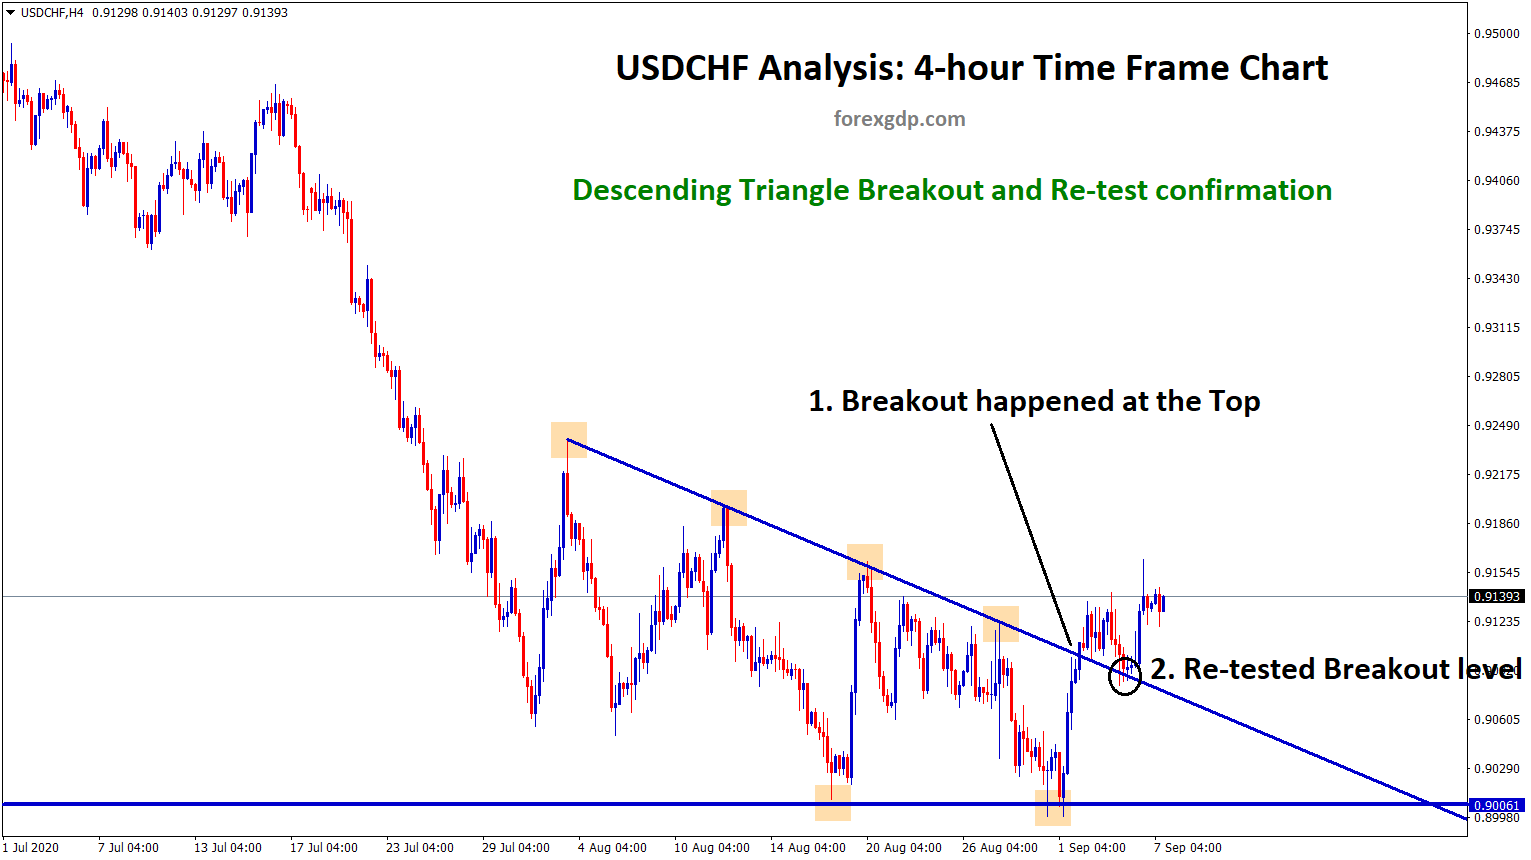
USDCHF Technical Analysis USDCHF has formed a Descending Triangle by creating lower highs and equal lows in the 4-hour time…
-
Channel Trading Opportunities on different currency pairs
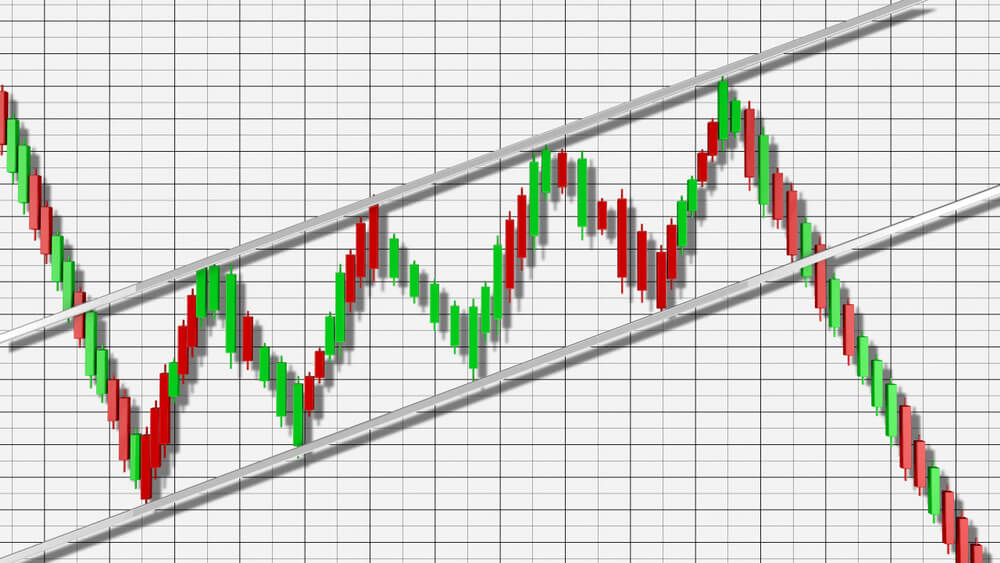
AUDUSD Analysis AUDUSD is moving in a strong uptrend by creating an Ascending Channel (higher highs, higher lows) in 4-hour…
-
Correlation Analysis: CADCHF, USDCAD, USDCHF at key levels
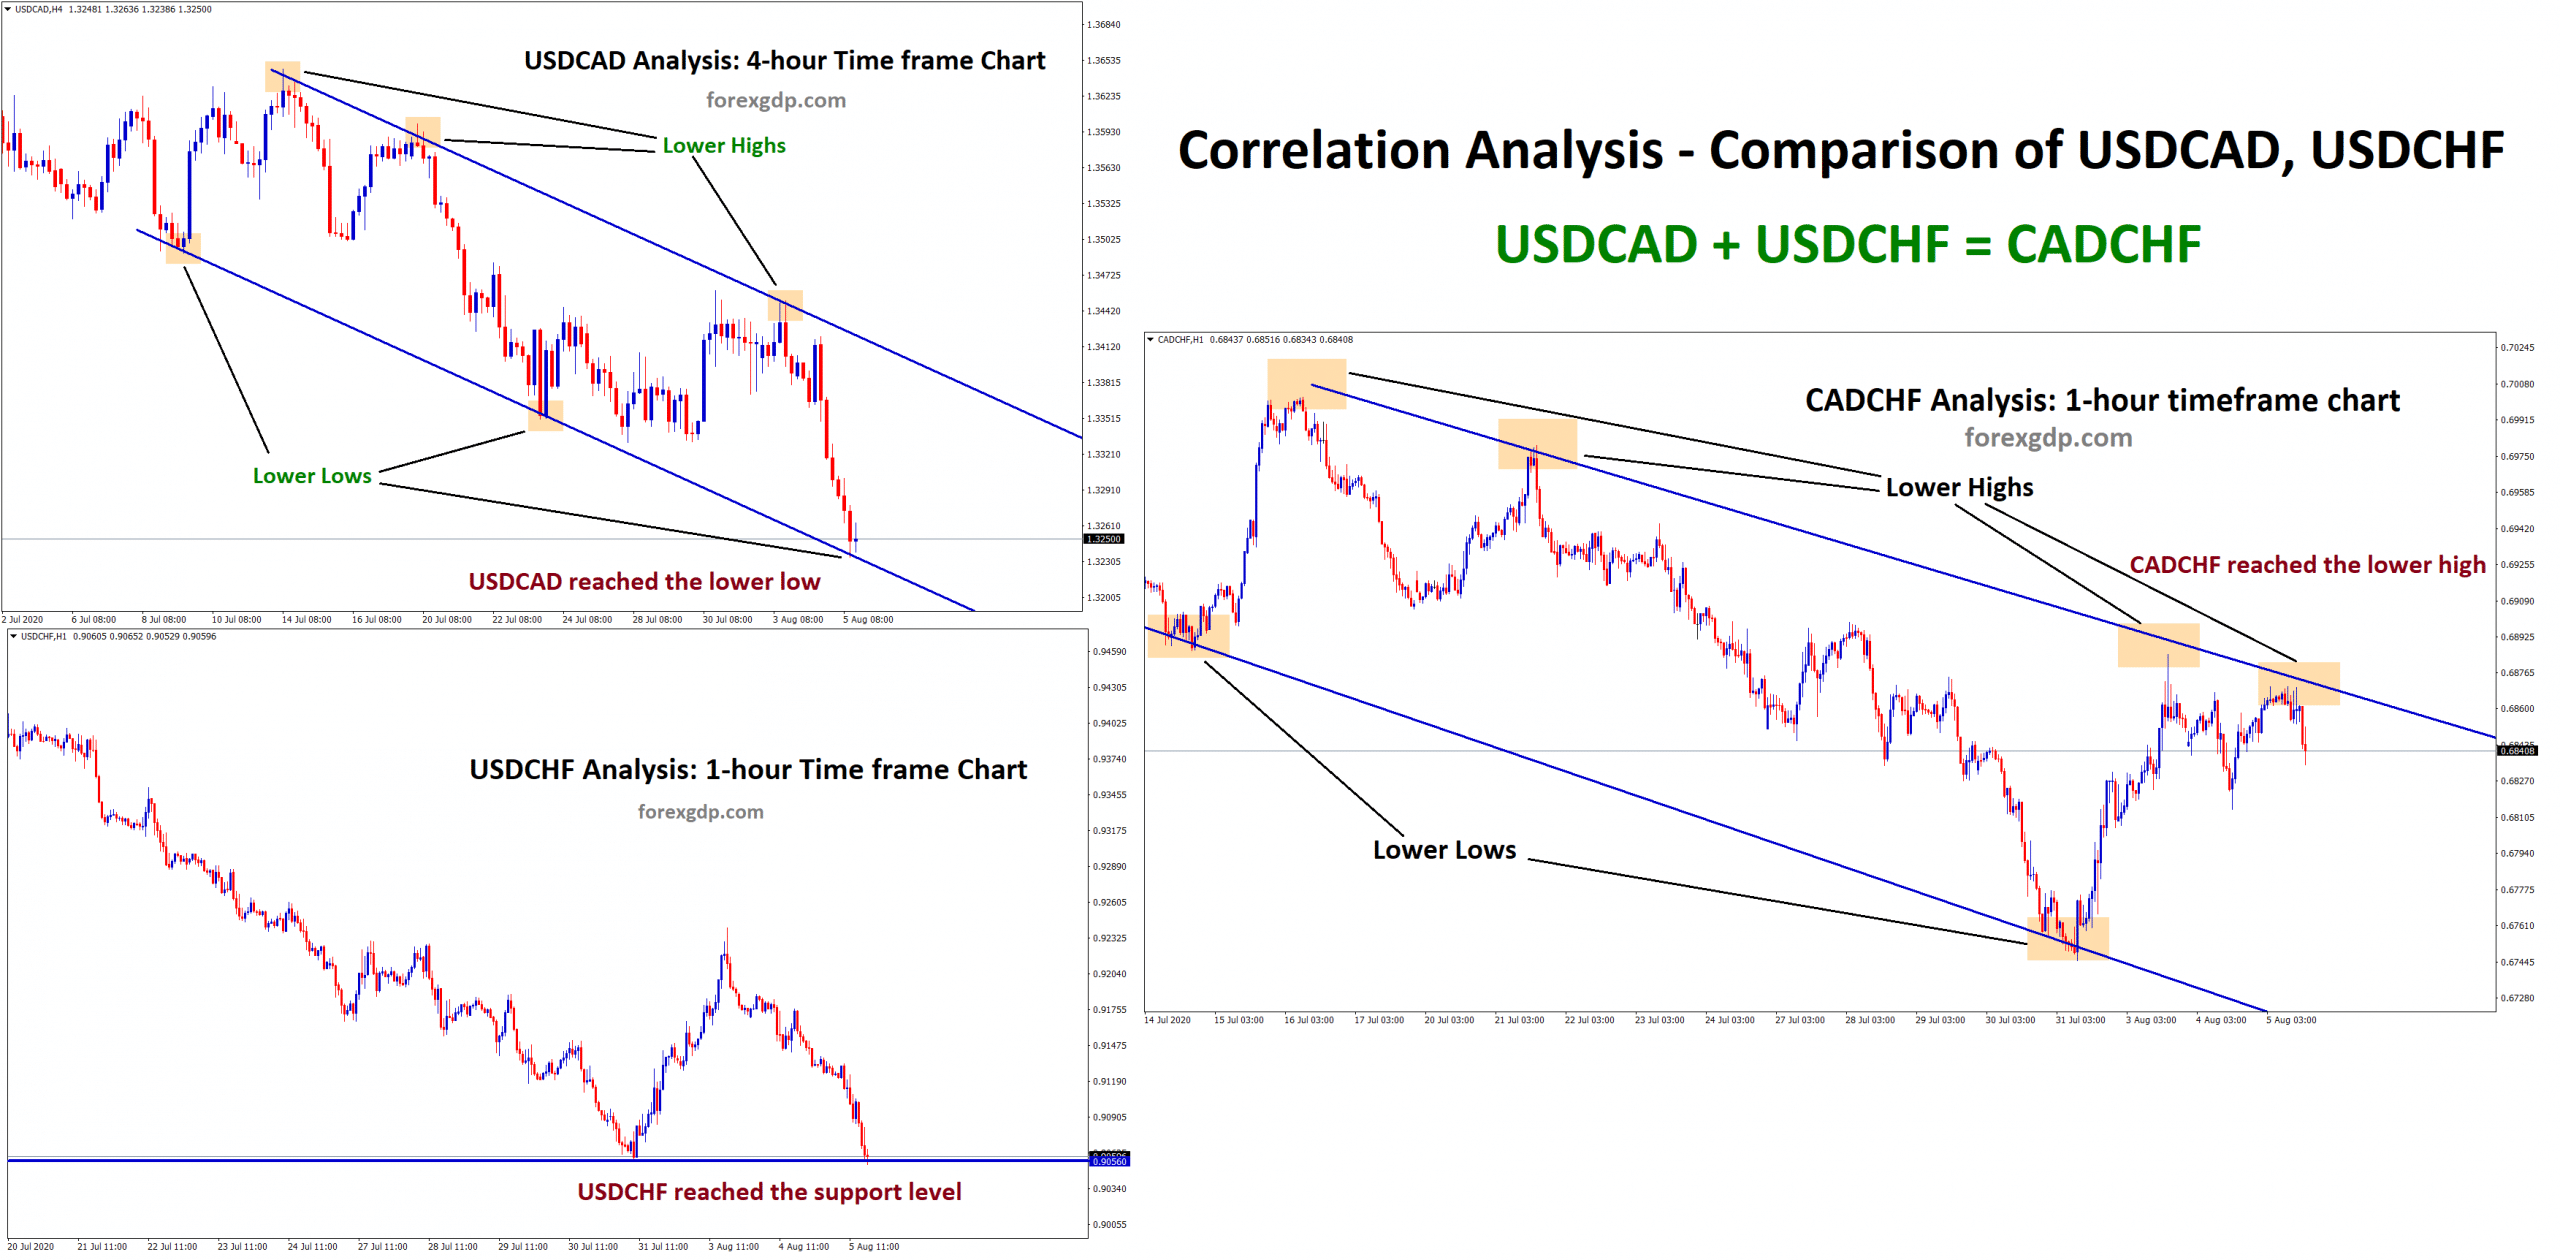
Correlation Analysis: USDCAD + USDCHF = CADCHF CADCHF is moving in a downtrend forming lower highs, lower lows in 1-hour…
-
USDCHF Reached -700 Points Loss in Buy Signal
USDCHF Technical Analysis for Buying USDCHF has moved in an Uptrend by forming higher high, higher low in 1-hour time…