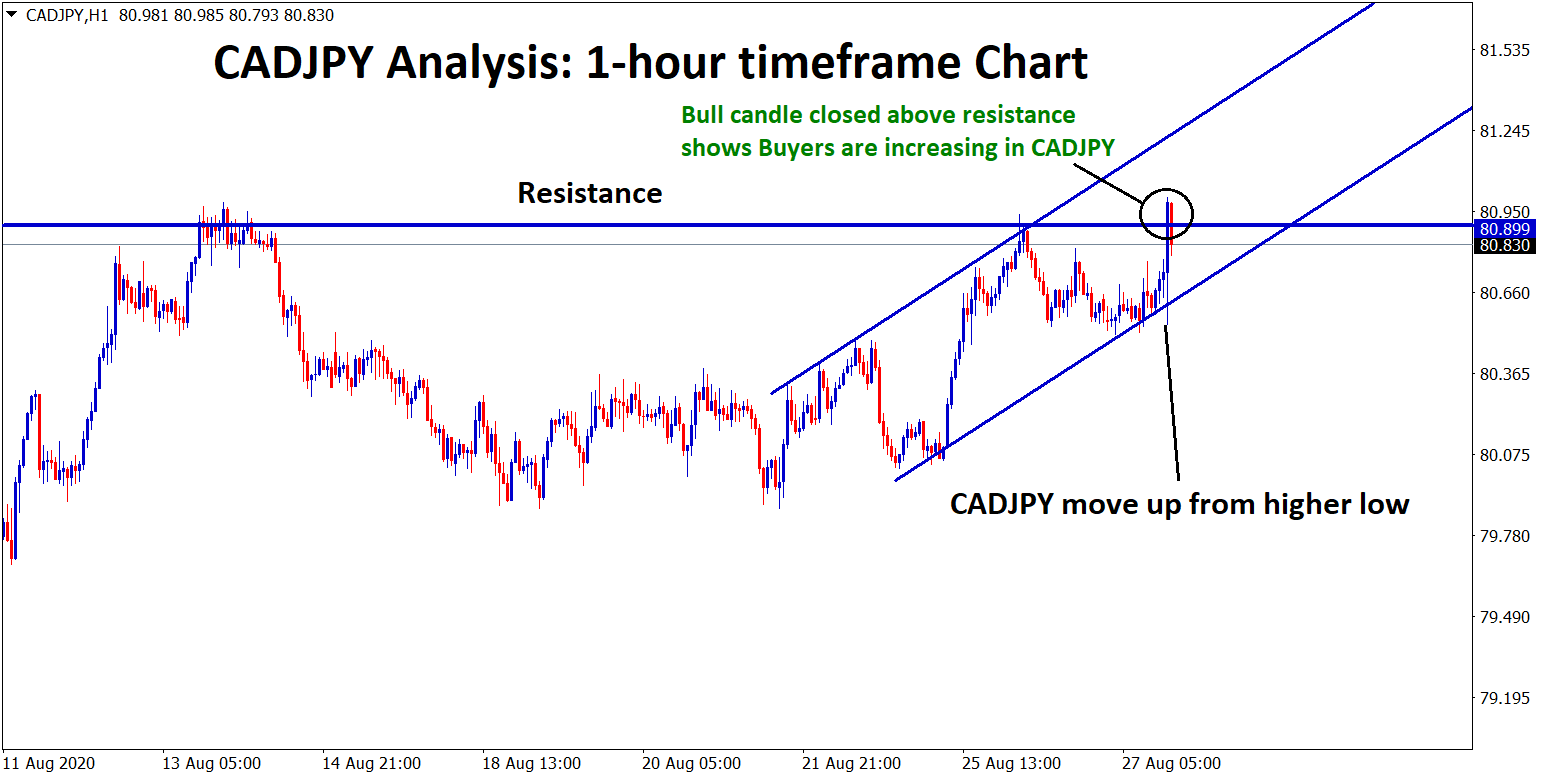
CADJPY Technical analysis
The Recent CADJPY candle closed above the resistance zone with buyers pressure and CADJPY move up from a higher low of Uptrend line. This shows that Buyers are increasing on CADJPY.
In the 4-hour timeframe chart, CADJPY is bouncing back from the resistance zone.

CADJPY old resistance level is converted into a new support level in 4 timeframe chart.
Last week, CADJPY moved up and down between small price ranges. This week CADJPY starts to rise with Buyers pressure.
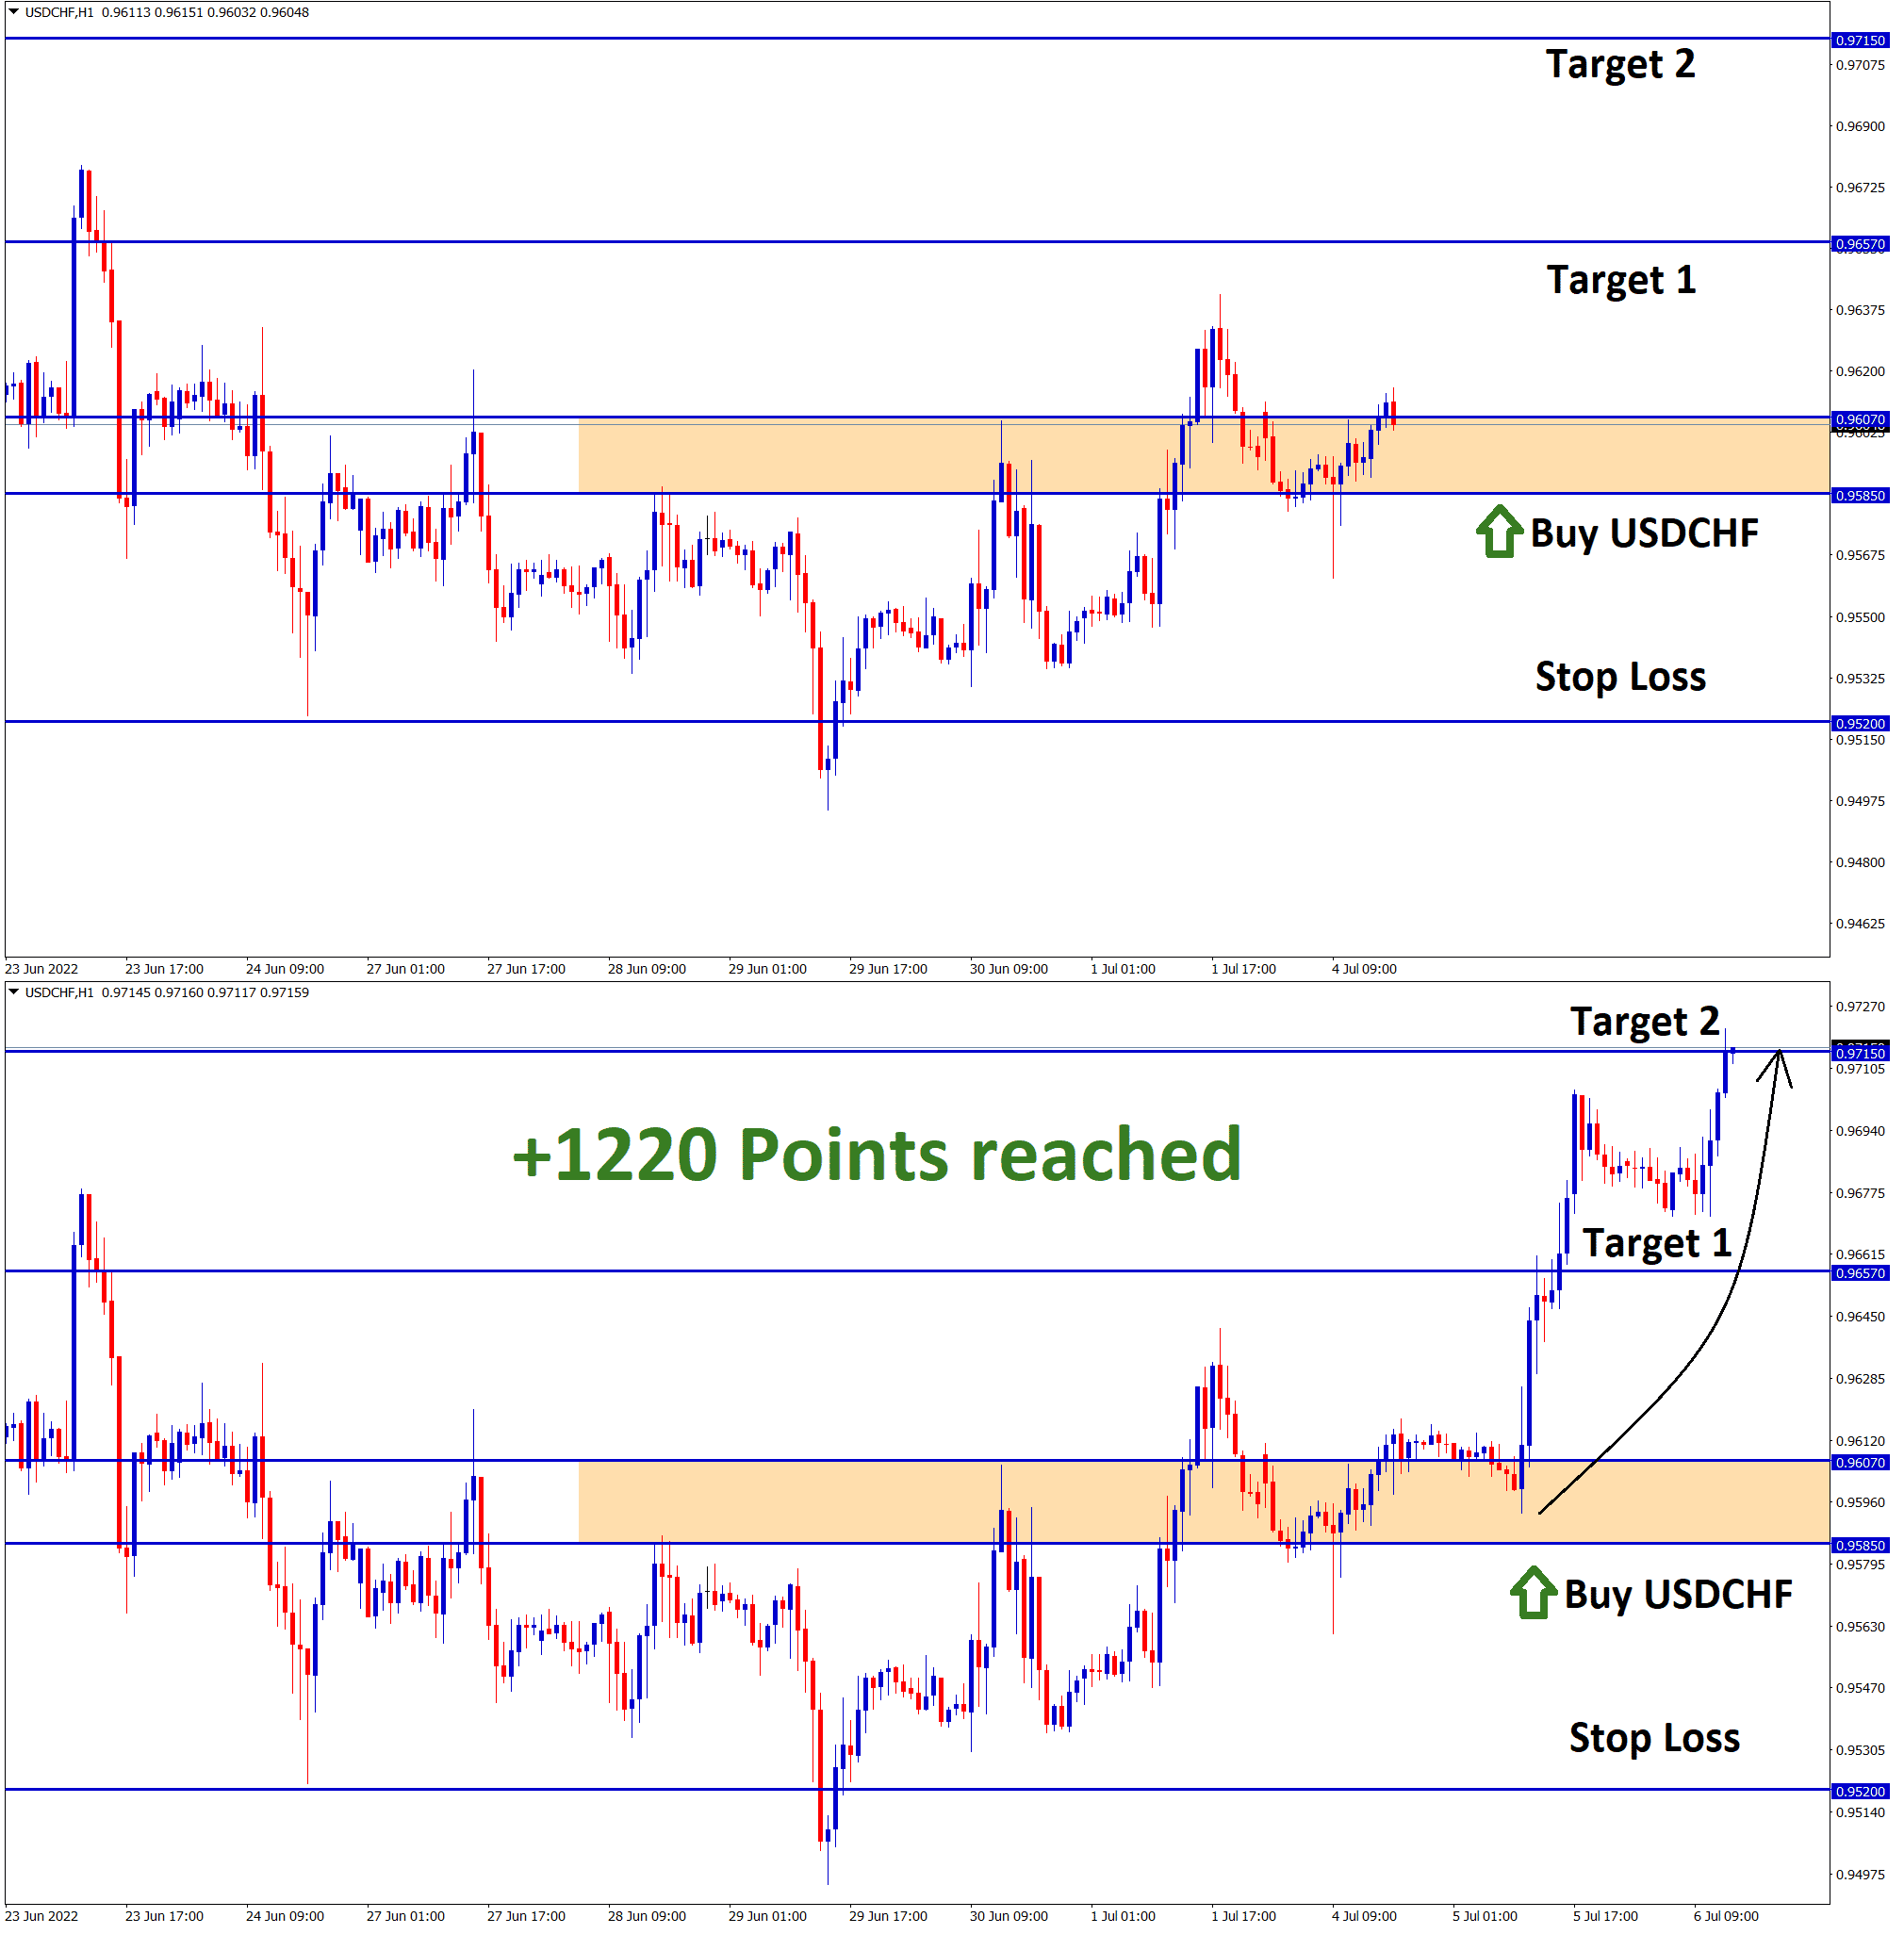
After the confirmation of breakout at the recent resistance, CADJPY Buy signal is given.

CADJPY reached the take profit successfully.
Get Each forex signal with Chart Analysis and Reason for buying or selling the trade which helps you to Trade with confidence on your account.
Please Don’t trade all the time, trade forex only at best trade setup.
It is better to do nothing, instead of taking wrong trades.
We are here to help you for taking the trades only at best trade setup.
Start to receive the forex signals now: forexgdp.com/forex-signals/