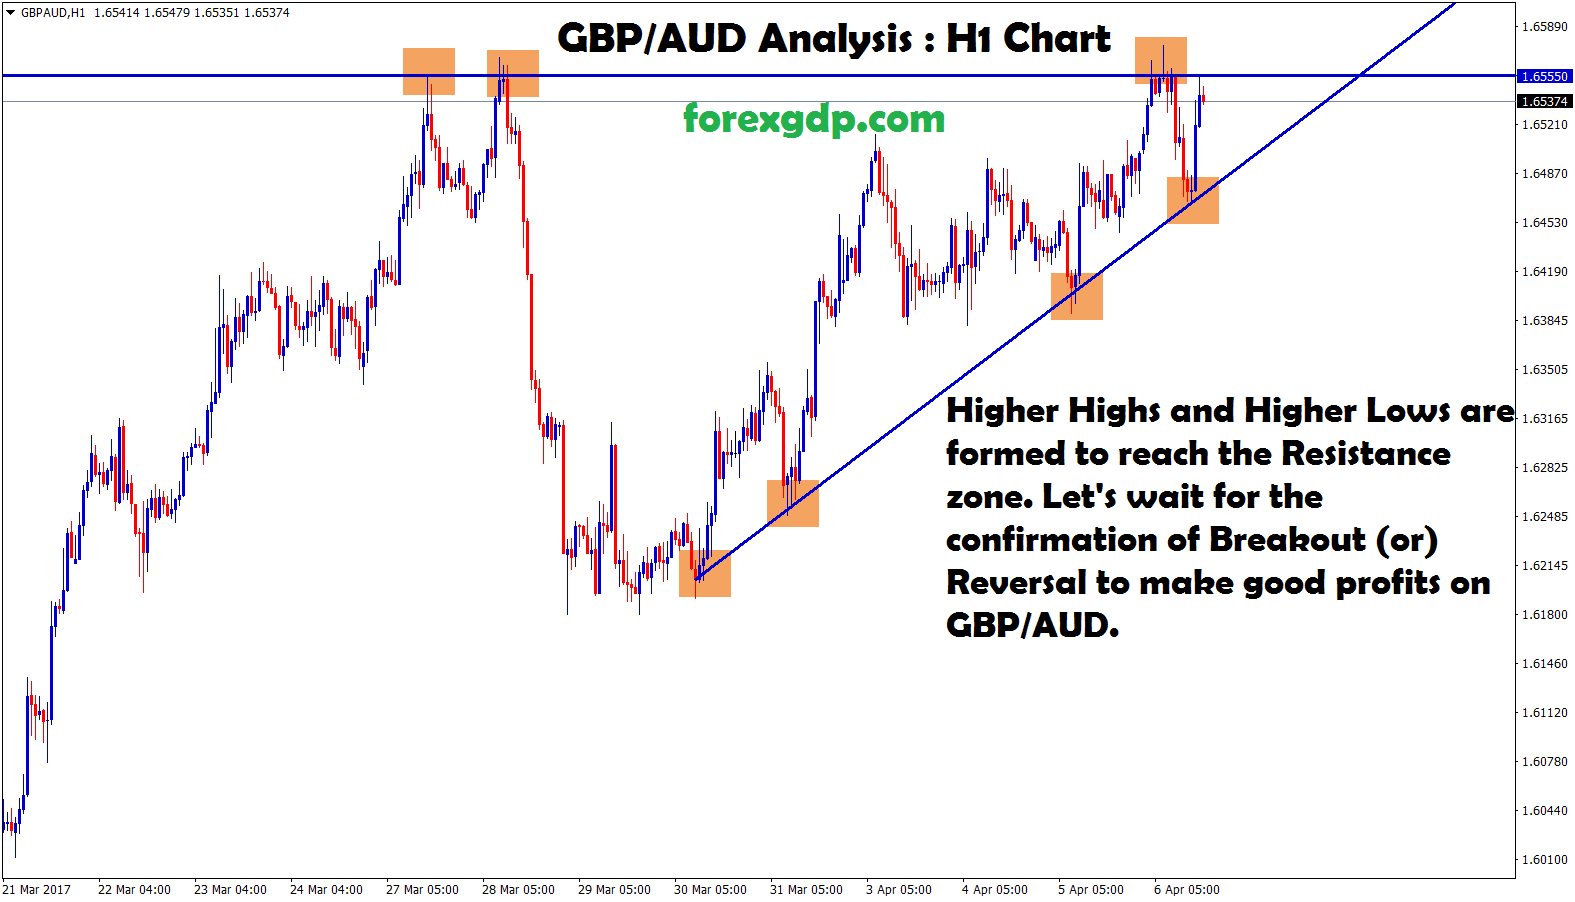
GBP/AUD Analysis :

GBP/AUD reaches the Top Zone now. Most of the GBP pairs reached the Resistance zone and making some up and down movements to pickup the right direction.
GBP/USD reaches the resistance Level : 1.26 and starts to fall again, however it is considered to be a temporary retracement.
Similary GBP/AUD has went up and reached the top zone on both Daily Chart and 1 Hour Chart.
GBP/AUD forms Higher Highs and Higher Lows in H1 Timeframe to reach the Resistance Level 1.655
Let’s wait for the market to Breakout the Top (or) Reversal to the bottom to make good profits on GBP/AUD.
Save your time on analysing the market, Start to trade forex in a technical trade setup’s.