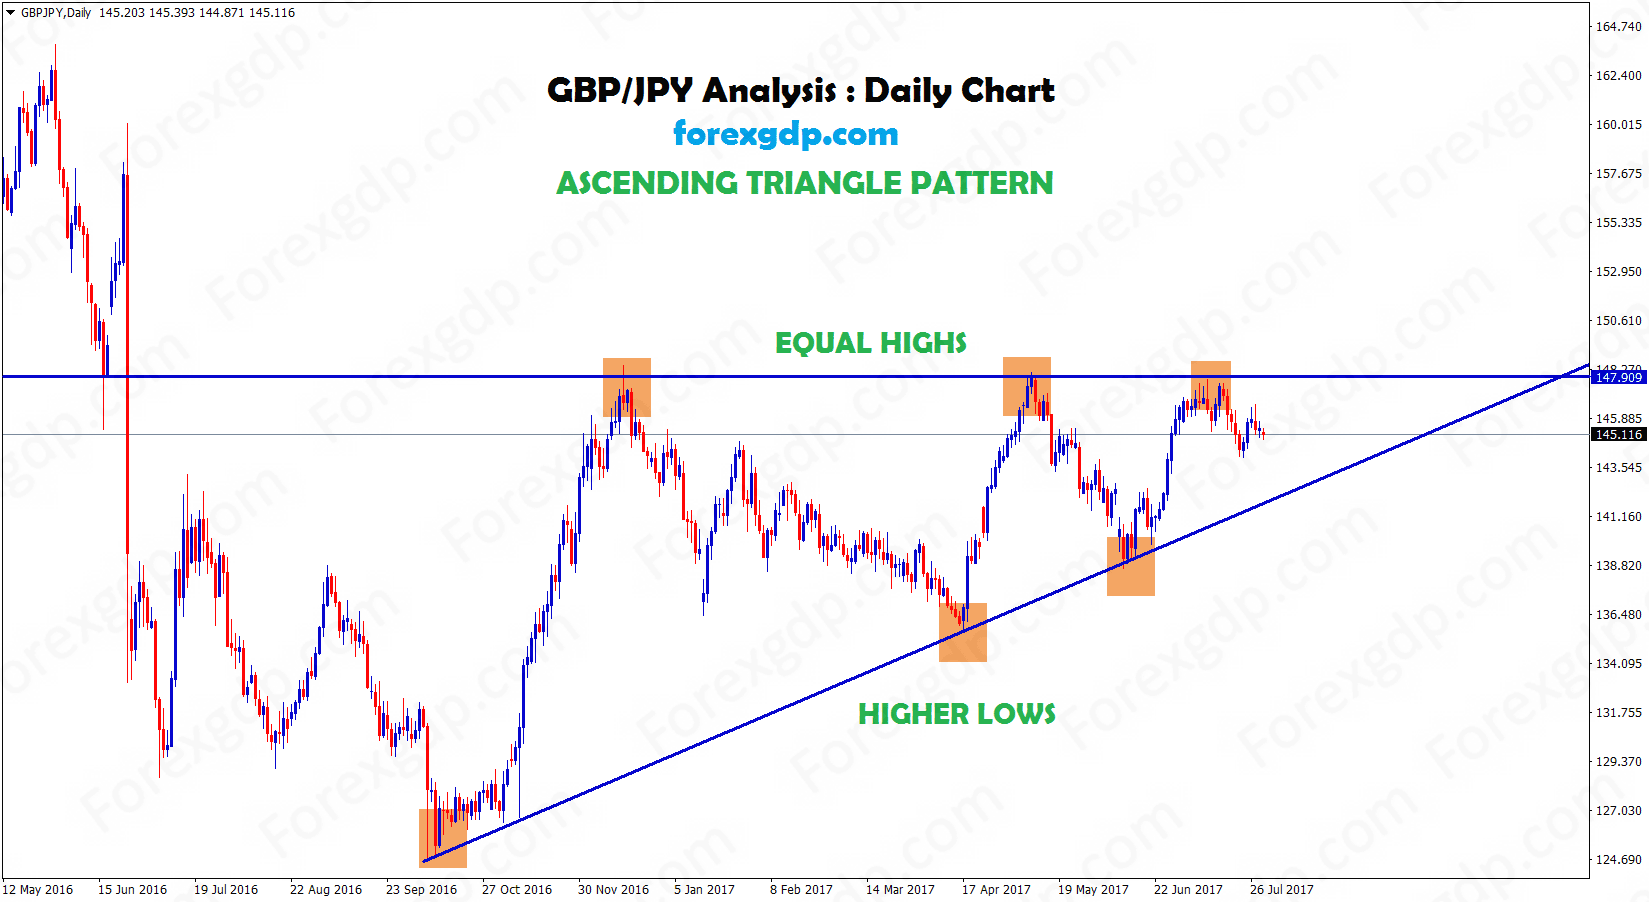
GBP/JPY Analysis :
From December 2016 to till now, GBP/JPY fails to Breakout the Major price level 148.00
Market try to breakout the top level 3 times, but it still fails.
GBP/JPY forms an Ascending Triangle by creating Equal Highs and Higher Lows in Daily chart.
Market going to end this Ascending Triangle very soon.
Let’s wait for the market to breakout from this Ascending triangle range to catch good profits on this pair.
Save your time on Analyzing the market, Start to Learn, Trade Forex market in a technical ways with the help of Forex Experts team.
Don’t Trade forex market all the time, trade forex only at good opportunities available in the market.
Save your time on analyzing the market and take your trades only at good opportunities available in the market.
If you want to receive forex trading signals at best trade setup with chart analysis, subscribe now to our forex signals.
Pingback:GBP/JPY forms Equal Highs and Higher Lows ( Ascending Triangle Pattern )
I like the helpful information you provide in your articles. I will bookmark your blog and check again here regularly.
Thank you