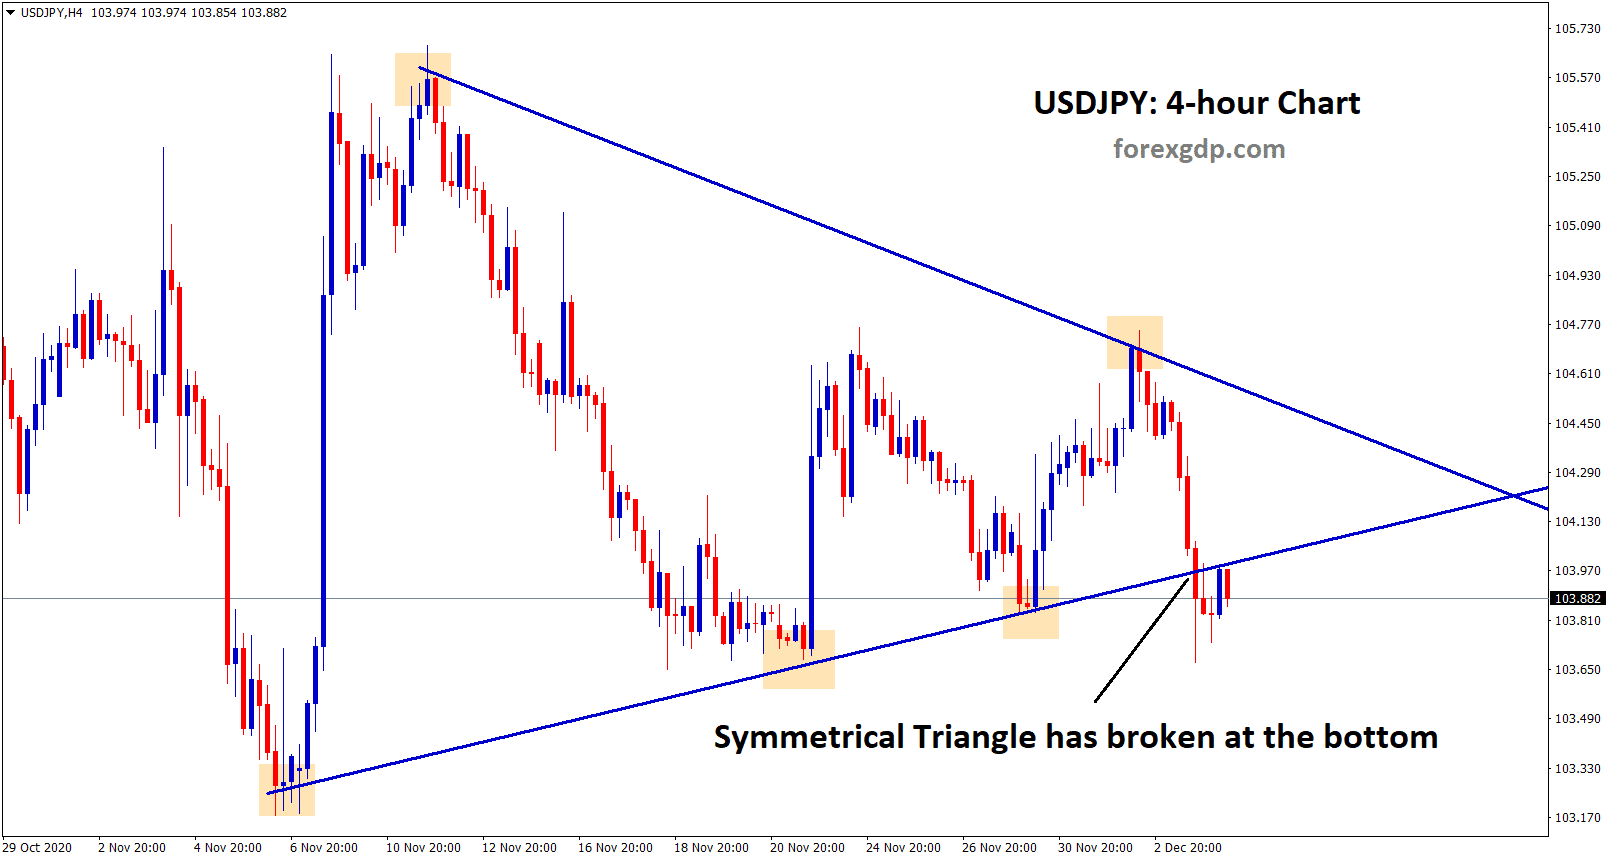
USDJPY Analysis
USDJPY has formed lower highs and higher lows which leads to the Symmetrical Triangle pattern.
Recently, USDJPY has broken the bottom level of the symmetrical triangle in the 4-hour time frame chart.
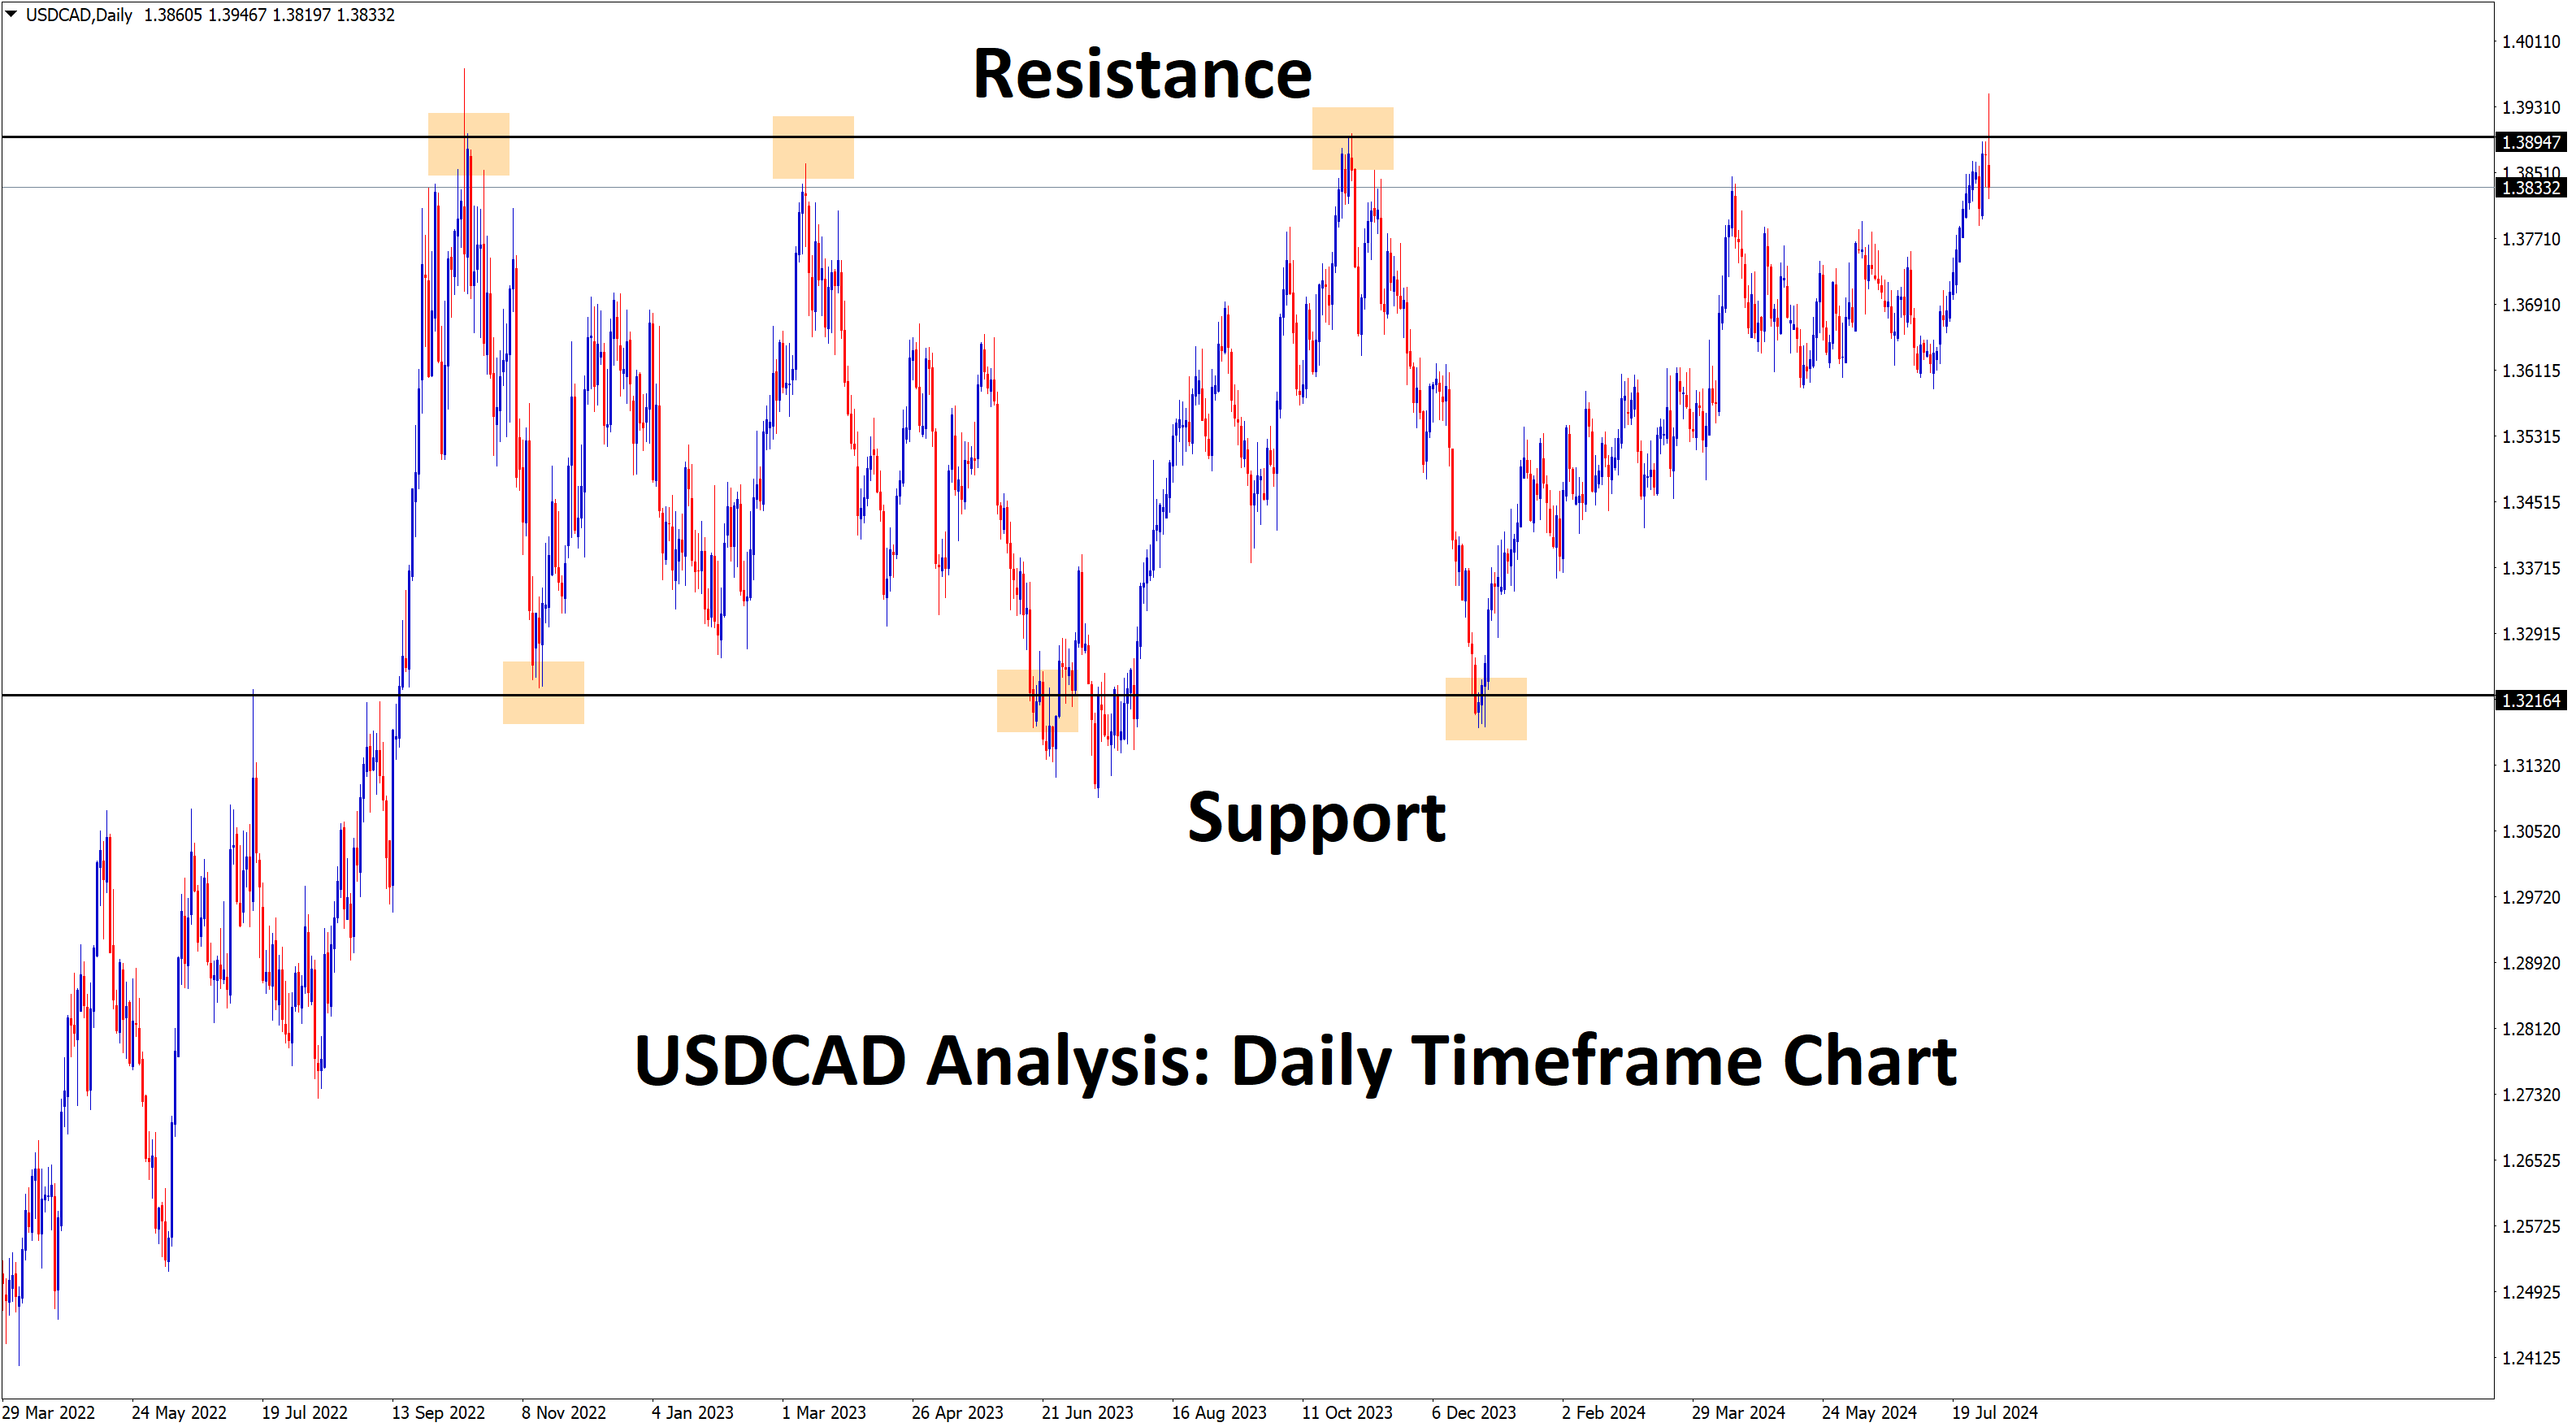
Most of the USD currency pairs broken the major resistance and support levels.
Expecting USDJPY to break the further major levels soon.
Get Each forex signal with Chart Analysis and Reason for buying or selling the trade which helps you to Trade with confidence on your trading account.
Want to boost your profits? Get more trading signals at premium or supreme signal plan at an accurate time. Try now: forexgdp.com/forex-signals/