USD/CHF Analysis (For Education Purpose):
USD/CHF reaches the top zone in different timeframe charts.
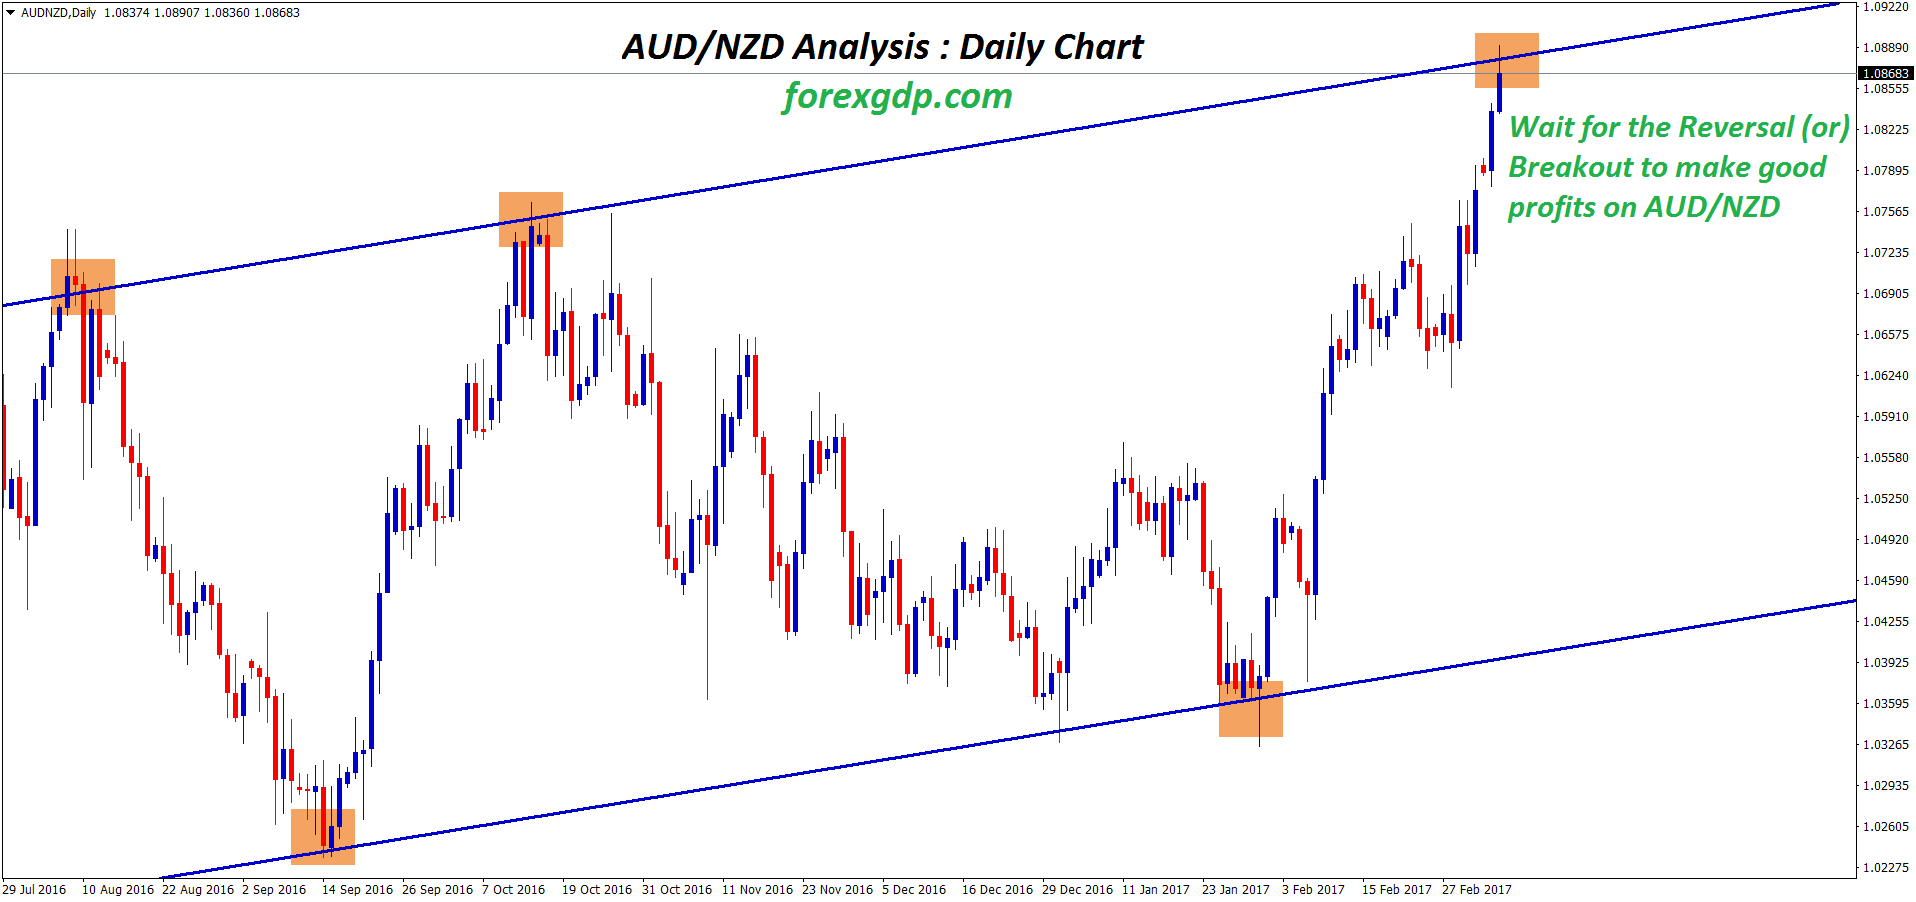
In Daily chart USD/CHF formed an Ascending Triangle pattern and the market is standing now at the top zone.
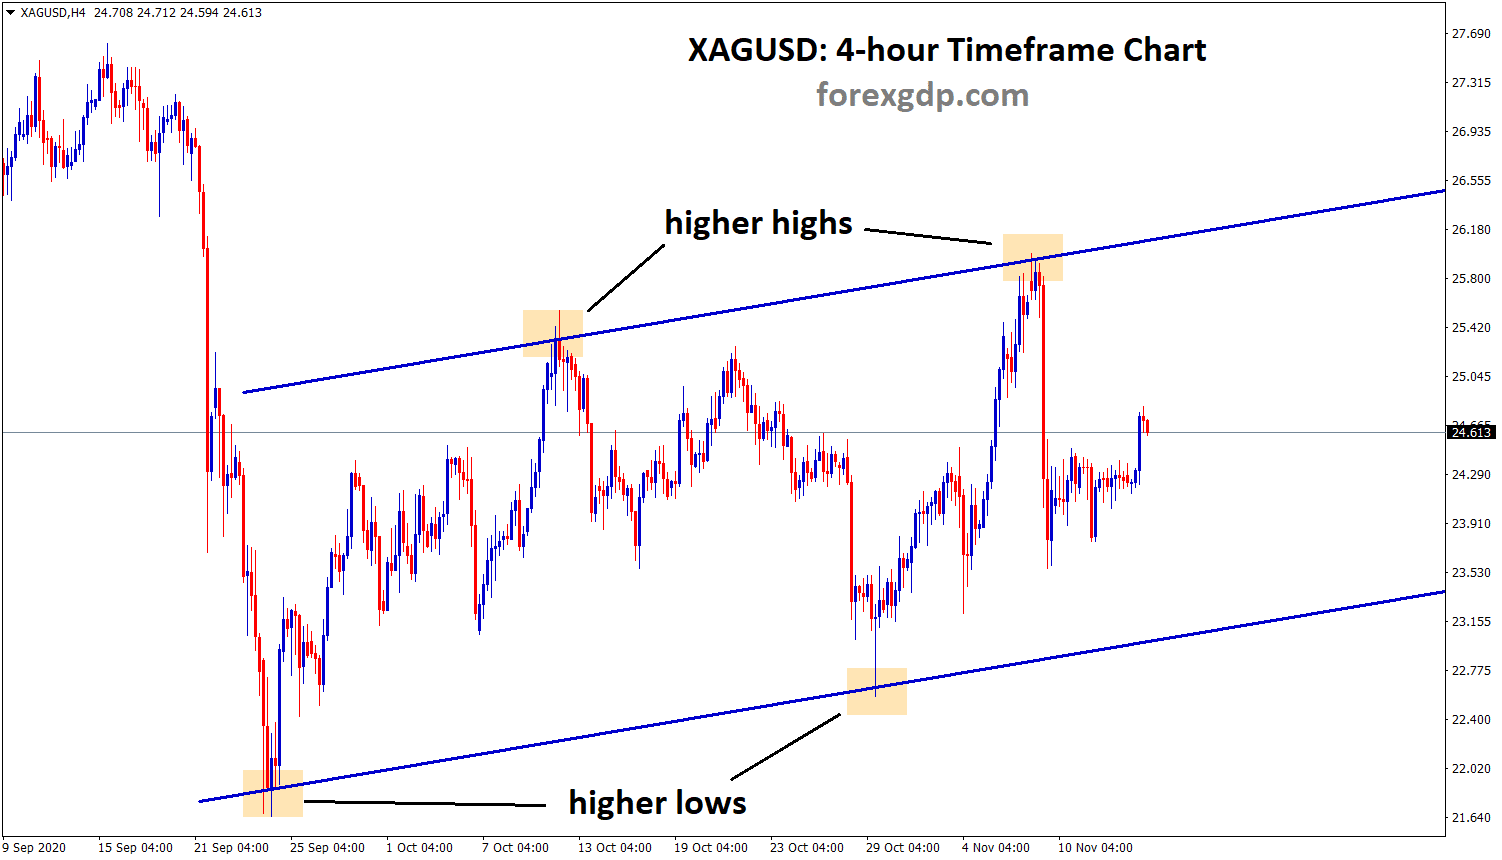
In H4 Timeframe, USD/CHF reaches the top zone of the uptrend range.

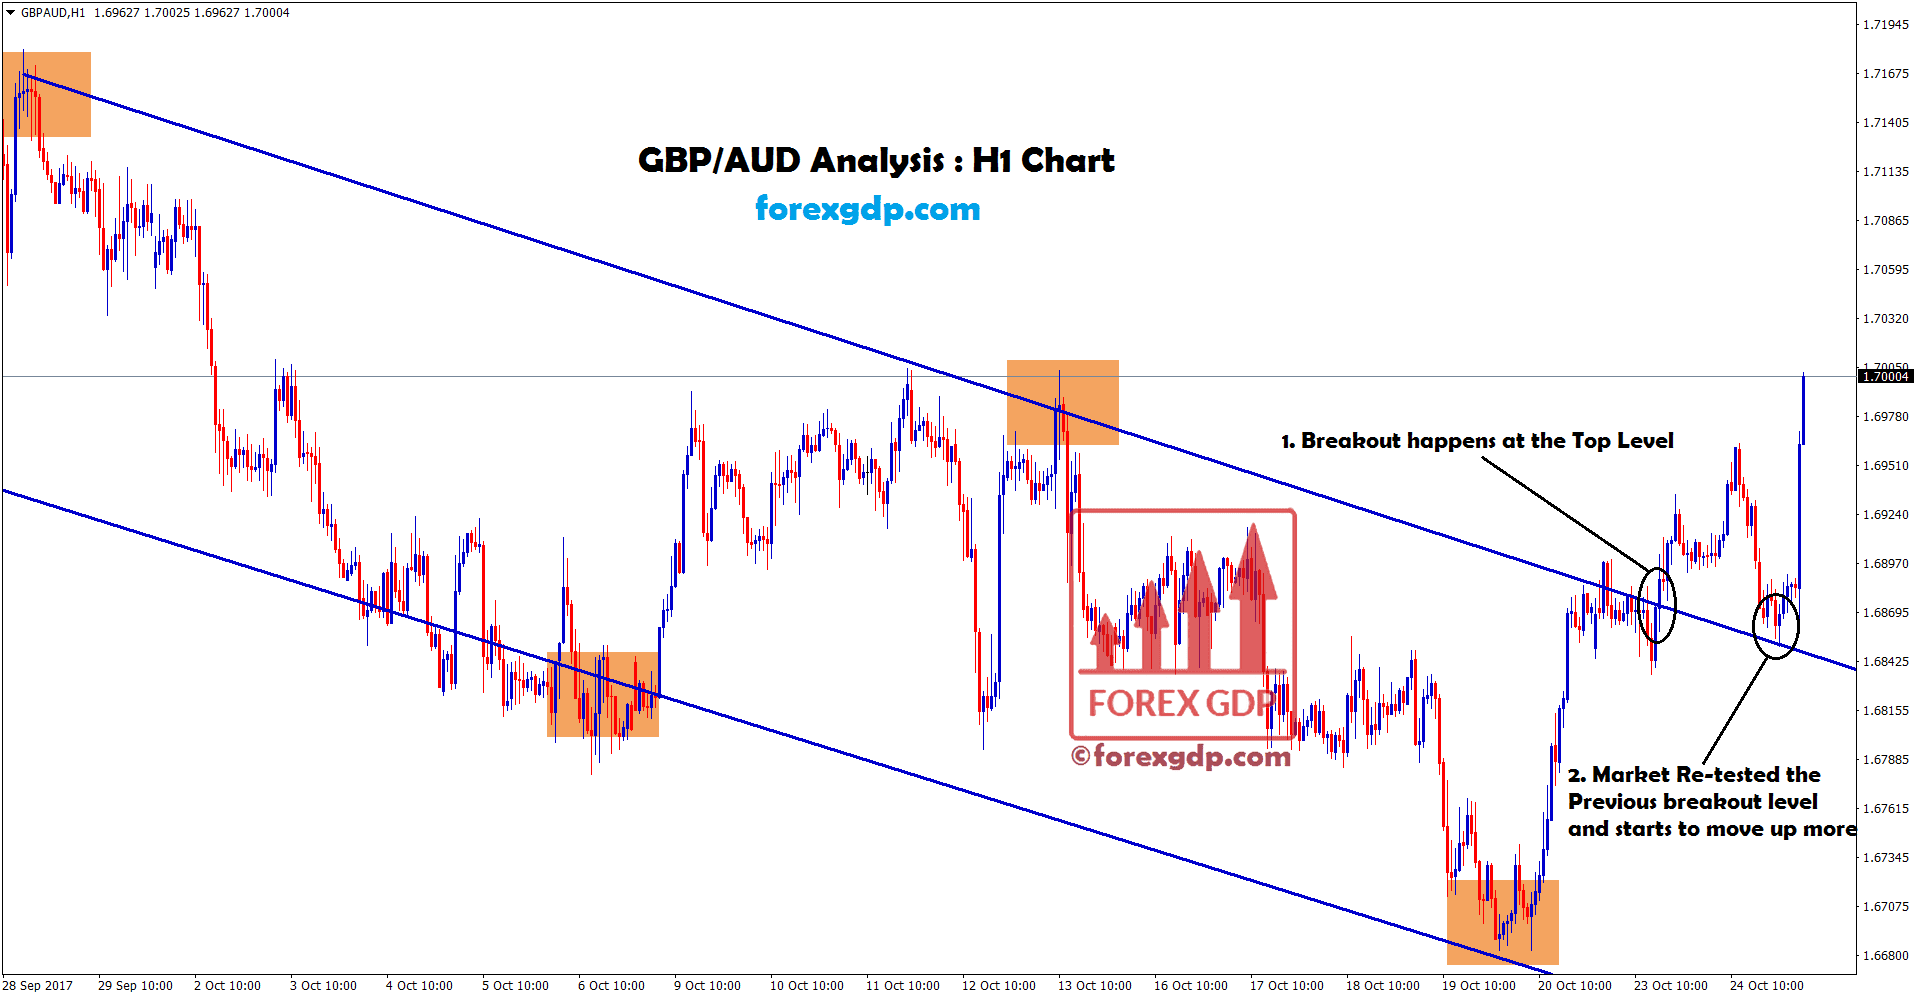
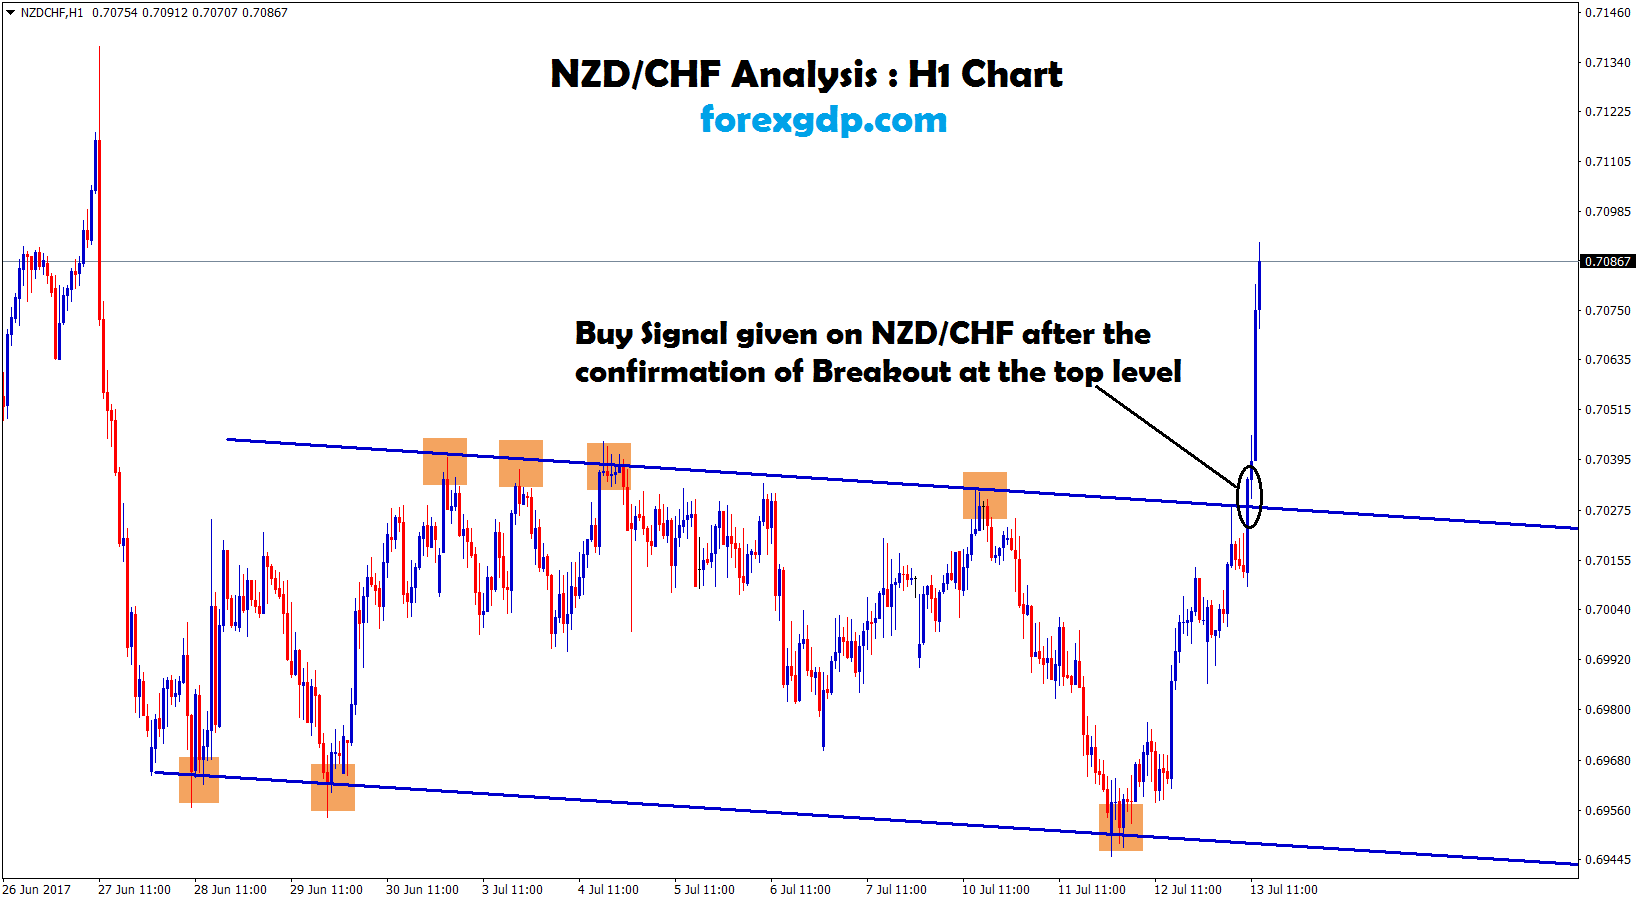
In H1 Timeframe, USD/CHF broken the bottom zone of the range.

All the above charts confirmed the downward movement on USD/CHF.
Save your Money, Energy, Time on Analyzing the market. We are here to help you always.
Start to Learn, Trade Forex market in technical ways with the help of Forex Experts team.
Please do not trade forex market all the time, trade forex only at good opportunities available in the market.
Don’t trade all the time, trade only at Best Setup. Join Free now. Let result speaks on your trading account. Start to receive the forex signals now: forexgdp.com/forex-signals/
Pingback:+643 Points Reached in USD/CHF Sell Signal - FOREX GDP