USD/JPY Descending Triangle pattern Analysis
USDJPY broken the bottom zone of descending Triangle in 1 hour chart. check here. USD JPY buy forex signals with stop loss was given.
As month end on yesterday, JPY was sold heavily.
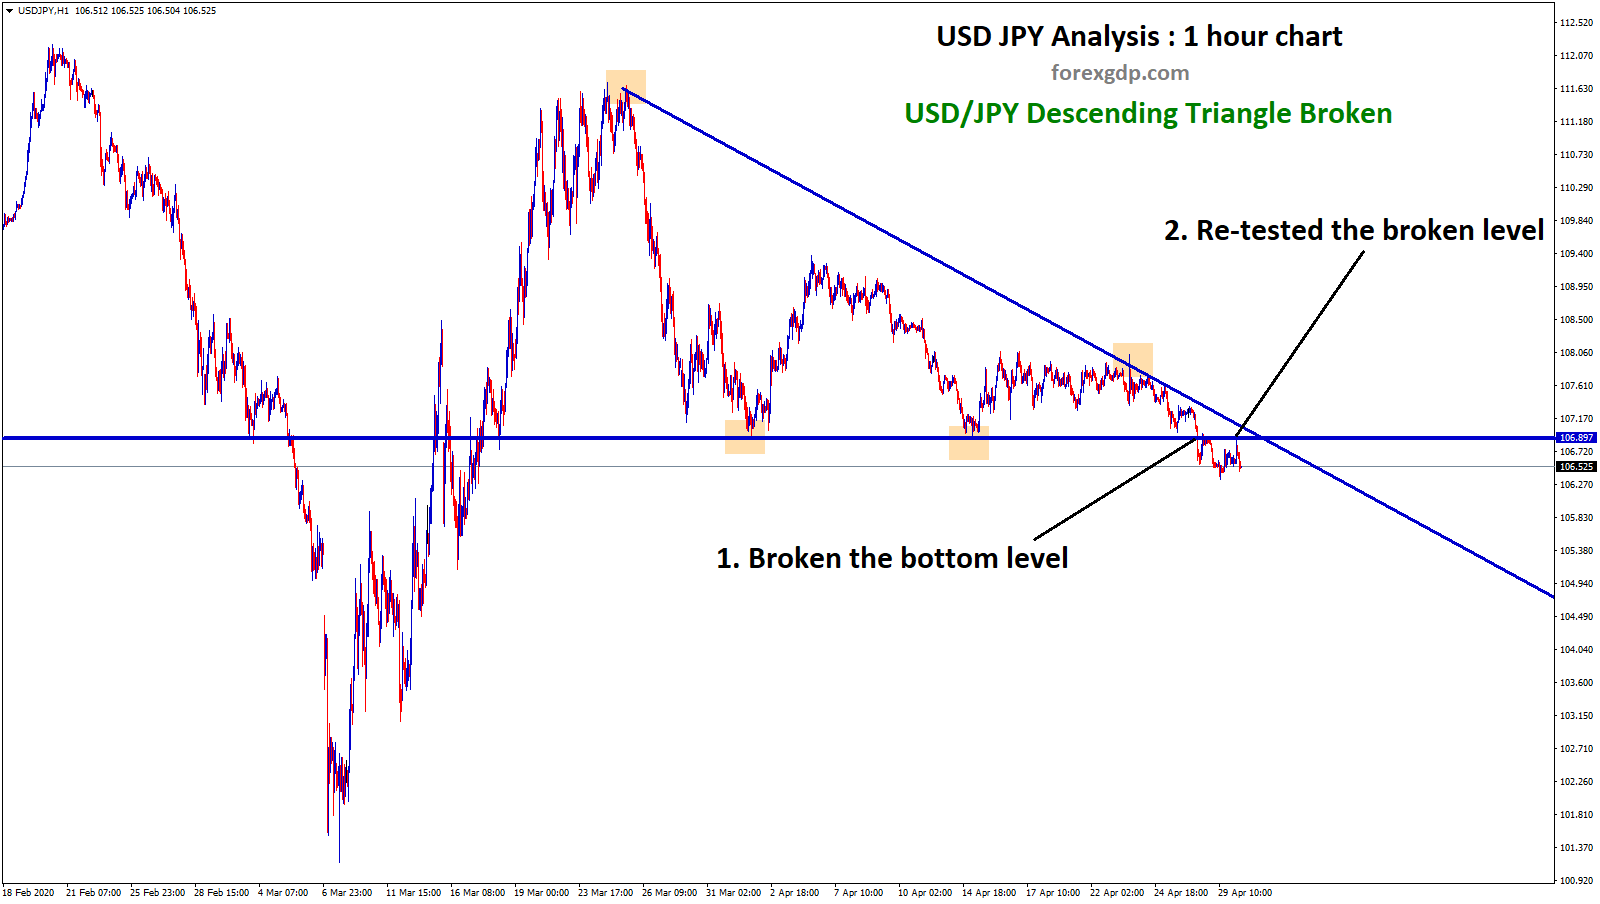
But, market failed to move down instead it made a pull back and entered into the Triangle zone again to reach our forex signals with stop loss price which was placed above the previous top zone.
The market is looking with the mixed results, US is negative on one side (jobless claims) and trump try to balance the US economy on other side.
Due to unstable economical impacts, the market is making big spikes around the important zones before it starts the technical move. Example : If you look out the EUR/CAD, soft breakout happened at the support zone in 1 hr chart, but the market made a bigger pull back and went up 2700 points.